

Key Insights
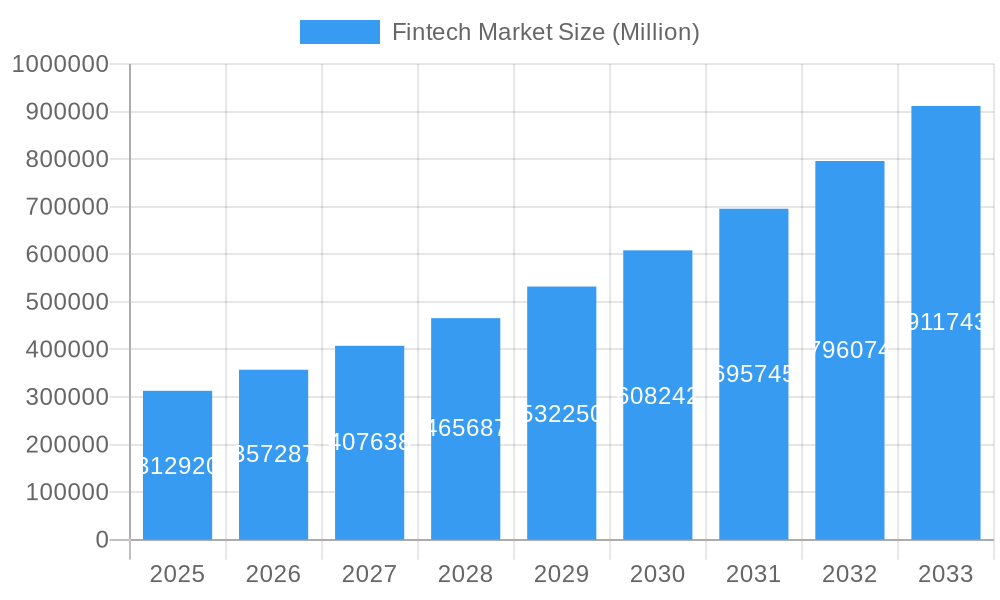
The global Fintech market, valued at $312.92 billion in 2025, is experiencing robust growth, projected to expand at a Compound Annual Growth Rate (CAGR) exceeding 14% from 2025 to 2033. This explosive growth is fueled by several key drivers. The increasing adoption of smartphones and internet penetration globally has created a fertile ground for Fintech solutions. Consumers and businesses alike are embracing digital payment methods, online lending platforms, and digital investment tools for their convenience, speed, and often lower costs compared to traditional financial services. Furthermore, supportive government regulations in many regions are encouraging innovation and competition within the Fintech sector. The market is segmented by service proposition (money transfer and payments, savings and investments, digital lending, online insurance, etc.) and end-user (consumers, SMEs, and large enterprises). The rapid expansion of e-commerce and the growing demand for personalized financial services further contribute to market expansion. While challenges exist, such as cybersecurity threats and regulatory uncertainties in some markets, the overall outlook for Fintech remains exceptionally positive, promising significant growth and transformation of the financial landscape.
Fintech Market Market Size (In Billion)
The competitive landscape is highly dynamic, with established players like PayPal and newcomers like Robinhood and Klarna vying for market share. Geographic distribution shows strong growth across North America, Europe, and Asia-Pacific, with emerging markets in South America and the Middle East and Africa exhibiting significant potential for future expansion. The increasing integration of Artificial Intelligence (AI) and machine learning into Fintech products is expected to further enhance efficiency, personalize services, and improve risk management. The focus on financial inclusion, particularly in underserved populations, is also driving innovation and attracting significant investment in the sector. Companies are continuously striving to improve user experience, security features, and expand their product offerings to maintain a competitive edge in this rapidly evolving market. The next decade is poised to witness even more disruptive innovations, further consolidating the Fintech market's position as a cornerstone of the global economy.
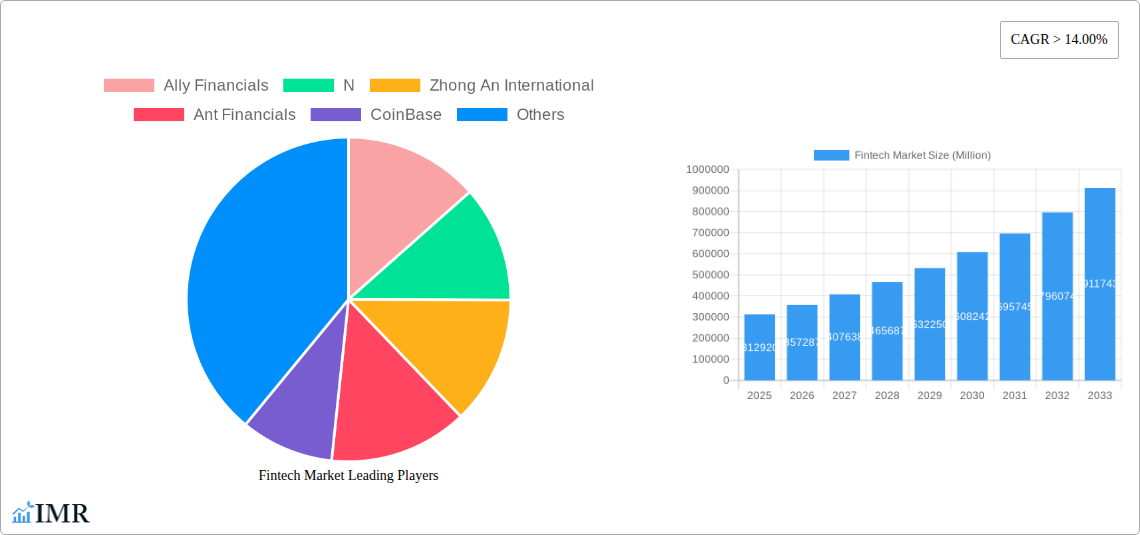
Fintech Market Company Market Share
Fintech Market: A Comprehensive Report (2019-2033)
This comprehensive report provides a detailed analysis of the Fintech market, encompassing its dynamics, growth trends, key players, and future outlook. With a study period spanning 2019-2033, a base year of 2025, and a forecast period of 2025-2033, this report offers invaluable insights for industry professionals, investors, and strategists. The report segments the market by Service Proposition (Money Transfer and Payments, Savings and Investments, Digital Lending and Lending Marketplaces, Online Insurance and Insurance Marketplaces, Other Service Propositions) and End User (Consumers/Individuals, Small and Medium-sized Enterprises (SMEs), Large Enterprises), providing granular analysis of each segment's growth trajectory. The market size is projected to reach xx Million by 2033.
Fintech Market Dynamics & Structure
The Fintech market is characterized by intense competition and rapid technological innovation. Market concentration is relatively high, with a few dominant players commanding significant market share. However, the emergence of numerous startups and disruptive technologies is constantly reshaping the competitive landscape. Regulatory frameworks, varying significantly across jurisdictions, play a crucial role in shaping market access and growth. The industry witnesses frequent mergers and acquisitions (M&A) activity, reflecting the consolidation trend and strategic expansion efforts of major players.
- Market Concentration: The top 5 players hold an estimated xx% of the global market share in 2025.
- Technological Innovation Drivers: AI, blockchain, cloud computing, and open banking are driving significant innovation.
- Regulatory Frameworks: Varying regulations across countries create both opportunities and challenges for market expansion.
- Competitive Product Substitutes: Traditional financial services remain key competitors, forcing Fintech firms to innovate continuously.
- End-User Demographics: Growing adoption among younger generations and SMEs is a significant growth driver.
- M&A Trends: An average of xx M&A deals were recorded annually during the historical period (2019-2024), with deal values totaling xx Million.
Fintech Market Growth Trends & Insights
The Fintech market has experienced remarkable growth over the past few years, driven by factors such as increasing smartphone penetration, rising internet adoption, and growing consumer preference for digital financial services. The market size has expanded significantly from xx Million in 2019 to an estimated xx Million in 2025, exhibiting a CAGR of xx% during the historical period. The adoption rate of various Fintech services, such as mobile payments and digital lending, has increased substantially, indicating a shift in consumer behavior towards digital channels. This trend is expected to continue during the forecast period (2025-2033), with significant market penetration projected across different regions and segments. Technological disruptions, such as the emergence of blockchain and AI-powered solutions, are further accelerating market growth and enhancing service capabilities.
Dominant Regions, Countries, or Segments in Fintech Market
The North American and European regions currently dominate the Fintech market, driven by factors such as robust technological infrastructure, advanced regulatory frameworks, and high consumer adoption rates. Within these regions, specific countries like the U.S., UK, and Germany exhibit particularly strong growth.
By Service Proposition:
- Money Transfer and Payments: This segment is the largest, with a market share of xx% in 2025, driven by increasing cross-border transactions and mobile payment adoption.
- Digital Lending and Lending Marketplaces: Growing demand for quick and convenient lending options fuels the expansion of this segment.
- Other Service Propositions: This segment includes wealth management and investment services.
By End User:
- Consumers/Individuals: Consumers are the largest end-user segment, largely driven by the convenience and accessibility of digital financial services.
- SMEs: This segment exhibits high growth potential due to increasing adoption of technology for business operations and management.
The growth of each segment is fueled by various drivers, including favorable economic policies, supportive infrastructure, and increasing consumer trust in digital financial services. Future dominance will depend on the speed of technological innovation, regulatory adjustments, and market penetration strategies.
Fintech Market Product Landscape
The Fintech product landscape is dynamic, with continuous innovation in payment solutions, lending platforms, investment apps, and insurance marketplaces. Key innovations include AI-powered fraud detection, personalized financial advice tools, and blockchain-based security solutions. These advancements enhance user experience, improve security, and broaden service offerings, ultimately driving market growth. Companies constantly strive to differentiate their products through unique selling propositions (USPs), including personalized offerings, competitive pricing, and seamless integration with existing financial ecosystems.
Key Drivers, Barriers & Challenges in Fintech Market
Key Drivers:
- Technological advancements, such as AI and blockchain, are revolutionizing financial services.
- Increasing smartphone and internet penetration are expanding the market reach.
- Favorable government policies and initiatives are encouraging Fintech adoption.
Key Challenges:
- Stringent regulatory frameworks can hinder innovation and market expansion.
- Cybersecurity threats pose a significant risk to customer data and financial stability.
- Intense competition among Fintech companies puts pressure on margins and profitability. The market share of smaller companies is constantly threatened by larger companies which often possess greater resources and brand recognition.
Emerging Opportunities in Fintech Market
Untapped markets in developing economies present significant growth opportunities. The increasing adoption of open banking and APIs is creating new avenues for innovation and collaboration. The integration of Fintech with other sectors, such as healthcare and e-commerce, is expanding the market scope. Consumer demand for personalized and customized financial products is driving innovation in this area.
Growth Accelerators in the Fintech Market Industry
Technological breakthroughs, particularly in AI and machine learning, are boosting efficiency and creating new service offerings. Strategic partnerships between traditional financial institutions and Fintech startups are fostering innovation and accelerating market expansion. Governments' initiatives to promote financial inclusion and digitalization are driving widespread adoption of Fintech services.
Key Players Shaping the Fintech Market Market
Notable Milestones in Fintech Market Sector
- March 2023: MANGOPAY and PayPal expanded their long-term strategic collaboration, enhancing international payment capabilities for marketplaces.
- May 2022: Mastercard partnered with Synctera to provide account validation solutions for Fintechs using Mastercard's open banking platform.
- March 2022: Envestnet collaborated with Productfy, giving Fintech creators access to Envestnet's services.
In-Depth Fintech Market Market Outlook
The Fintech market is poised for continued growth, driven by technological advancements, increasing digitalization, and evolving consumer preferences. Strategic partnerships, expansion into untapped markets, and the development of innovative products will be crucial for success. The market's future potential is significant, offering numerous opportunities for established players and emerging startups alike.
Fintech Market Segmentation
-
1. Service Proposition
- 1.1. Money Transfer and Payments
- 1.2. Savings and Investments
- 1.3. Digital Lending and Lending Marketplaces
- 1.4. Online Insurance and Insurance Marketplaces
- 1.5. Other Service Propositions
Fintech Market Segmentation By Geography
-
1. North America
- 1.1. United States
- 1.2. Canada
- 1.3. Rest of North America
-
2. Europe
- 2.1. United Kingdom
- 2.2. Germany
- 2.3. France
- 2.4. Spain
- 2.5. Rest of Europe
-
3. Latin America
- 3.1. Brazil
- 3.2. Argentina
- 3.3. Mexico
- 3.4. Rest of Latin America
-
4. Asia Pacific
- 4.1. China
- 4.2. India
- 4.3. Japan
- 4.4. South Korea
- 4.5. Rest of Asia Pacific
-
5. Middle East and Africa
- 5.1. United Arab Emirates
- 5.2. Saudi Arabia
- 5.3. Rest of Middle East and Africa
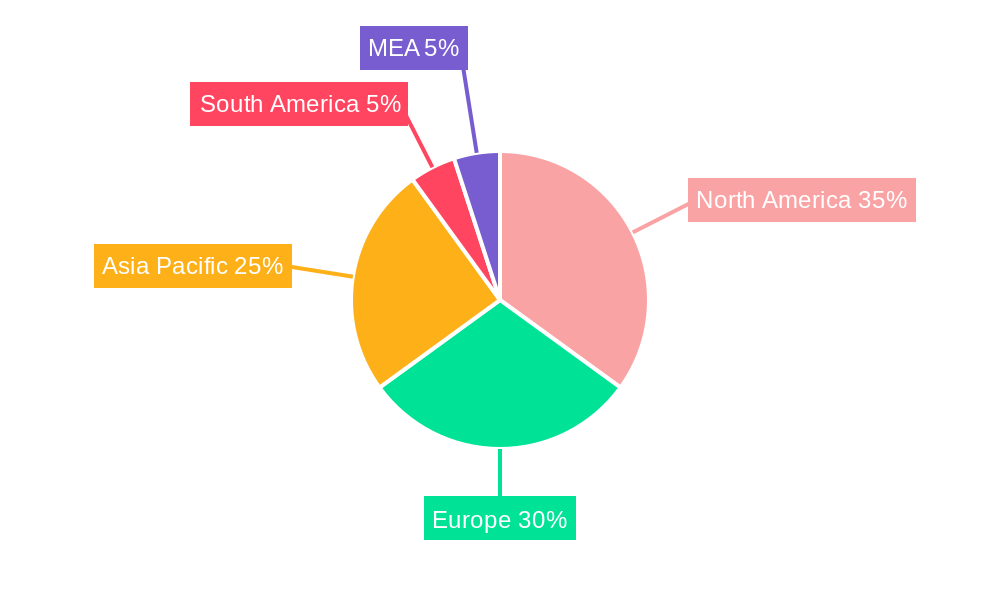
Fintech Market Regional Market Share
Geographic Coverage of Fintech Market
Fintech Market REPORT HIGHLIGHTS
| Aspects | Details |
|---|---|
| Study Period | 2020-2034 |
| Base Year | 2025 |
| Estimated Year | 2026 |
| Forecast Period | 2026-2034 |
| Historical Period | 2020-2025 |
| Growth Rate | CAGR of > 14.00% from 2020-2034 |
| Segmentation |
|
Table of Contents
- 1. Introduction
- 1.1. Research Scope
- 1.2. Market Segmentation
- 1.3. Research Objective
- 1.4. Definitions and Assumptions
- 2. Executive Summary
- 2.1. Market Snapshot
- 3. Market Dynamics
- 3.1. Market Drivers
- 3.2. Market Restrains
- 3.3. Market Trends
- 3.4. Market Opportunities
- 4. Market Factor Analysis
- 4.1. Porters Five Forces
- 4.1.1. Bargaining Power of Suppliers
- 4.1.2. Bargaining Power of Buyers
- 4.1.3. Threat of New Entrants
- 4.1.4. Threat of Substitutes
- 4.1.5. Competitive Rivalry
- 4.2. PESTEL analysis
- 4.3. BCG Analysis
- 4.3.1. Stars (High Growth, High Market Share)
- 4.3.2. Cash Cows (Low Growth, High Market Share)
- 4.3.3. Question Mark (High Growth, Low Market Share)
- 4.3.4. Dogs (Low Growth, Low Market Share)
- 4.4. Ansoff Matrix Analysis
- 4.5. Supply Chain Analysis
- 4.6. Regulatory Landscape
- 4.7. Current Market Potential and Opportunity Assessment (TAM–SAM–SOM Framework)
- 4.8. IMR Analyst Note
- 4.1. Porters Five Forces
- 5. Market Analysis, Insights and Forecast 2021-2033
- 5.1. Market Analysis, Insights and Forecast - by Service Proposition
- 5.1.1. Money Transfer and Payments
- 5.1.2. Savings and Investments
- 5.1.3. Digital Lending and Lending Marketplaces
- 5.1.4. Online Insurance and Insurance Marketplaces
- 5.1.5. Other Service Propositions
- 5.2. Market Analysis, Insights and Forecast - by Region
- 5.2.1. North America
- 5.2.2. Europe
- 5.2.3. Latin America
- 5.2.4. Asia Pacific
- 5.2.5. Middle East and Africa
- 5.1. Market Analysis, Insights and Forecast - by Service Proposition
- 6. Global Fintech Market Analysis, Insights and Forecast, 2021-2033
- 6.1. Market Analysis, Insights and Forecast - by Service Proposition
- 6.1.1. Money Transfer and Payments
- 6.1.2. Savings and Investments
- 6.1.3. Digital Lending and Lending Marketplaces
- 6.1.4. Online Insurance and Insurance Marketplaces
- 6.1.5. Other Service Propositions
- 6.1. Market Analysis, Insights and Forecast - by Service Proposition
- 7. North America Fintech Market Analysis, Insights and Forecast, 2020-2032
- 7.1. Market Analysis, Insights and Forecast - by Service Proposition
- 7.1.1. Money Transfer and Payments
- 7.1.2. Savings and Investments
- 7.1.3. Digital Lending and Lending Marketplaces
- 7.1.4. Online Insurance and Insurance Marketplaces
- 7.1.5. Other Service Propositions
- 7.1. Market Analysis, Insights and Forecast - by Service Proposition
- 8. Europe Fintech Market Analysis, Insights and Forecast, 2020-2032
- 8.1. Market Analysis, Insights and Forecast - by Service Proposition
- 8.1.1. Money Transfer and Payments
- 8.1.2. Savings and Investments
- 8.1.3. Digital Lending and Lending Marketplaces
- 8.1.4. Online Insurance and Insurance Marketplaces
- 8.1.5. Other Service Propositions
- 8.1. Market Analysis, Insights and Forecast - by Service Proposition
- 9. Latin America Fintech Market Analysis, Insights and Forecast, 2020-2032
- 9.1. Market Analysis, Insights and Forecast - by Service Proposition
- 9.1.1. Money Transfer and Payments
- 9.1.2. Savings and Investments
- 9.1.3. Digital Lending and Lending Marketplaces
- 9.1.4. Online Insurance and Insurance Marketplaces
- 9.1.5. Other Service Propositions
- 9.1. Market Analysis, Insights and Forecast - by Service Proposition
- 10. Asia Pacific Fintech Market Analysis, Insights and Forecast, 2020-2032
- 10.1. Market Analysis, Insights and Forecast - by Service Proposition
- 10.1.1. Money Transfer and Payments
- 10.1.2. Savings and Investments
- 10.1.3. Digital Lending and Lending Marketplaces
- 10.1.4. Online Insurance and Insurance Marketplaces
- 10.1.5. Other Service Propositions
- 10.1. Market Analysis, Insights and Forecast - by Service Proposition
- 11. Middle East and Africa Fintech Market Analysis, Insights and Forecast, 2020-2032
- 11.1. Market Analysis, Insights and Forecast - by Service Proposition
- 11.1.1. Money Transfer and Payments
- 11.1.2. Savings and Investments
- 11.1.3. Digital Lending and Lending Marketplaces
- 11.1.4. Online Insurance and Insurance Marketplaces
- 11.1.5. Other Service Propositions
- 11.1. Market Analysis, Insights and Forecast - by Service Proposition
- 12. Competitive Analysis
- 12.1. Company Profiles
- 12.1.1 Ally Financials
- 12.1.1.1. Company Overview
- 12.1.1.2. Products
- 12.1.1.3. Company Financials
- 12.1.1.4. SWOT Analysis
- 12.1.2 N
- 12.1.2.1. Company Overview
- 12.1.2.2. Products
- 12.1.2.3. Company Financials
- 12.1.2.4. SWOT Analysis
- 12.1.3 Zhong An International
- 12.1.3.1. Company Overview
- 12.1.3.2. Products
- 12.1.3.3. Company Financials
- 12.1.3.4. SWOT Analysis
- 12.1.4 Ant Financials
- 12.1.4.1. Company Overview
- 12.1.4.2. Products
- 12.1.4.3. Company Financials
- 12.1.4.4. SWOT Analysis
- 12.1.5 CoinBase
- 12.1.5.1. Company Overview
- 12.1.5.2. Products
- 12.1.5.3. Company Financials
- 12.1.5.4. SWOT Analysis
- 12.1.6 Klarna
- 12.1.6.1. Company Overview
- 12.1.6.2. Products
- 12.1.6.3. Company Financials
- 12.1.6.4. SWOT Analysis
- 12.1.7 Robinhood
- 12.1.7.1. Company Overview
- 12.1.7.2. Products
- 12.1.7.3. Company Financials
- 12.1.7.4. SWOT Analysis
- 12.1.8 SoFi
- 12.1.8.1. Company Overview
- 12.1.8.2. Products
- 12.1.8.3. Company Financials
- 12.1.8.4. SWOT Analysis
- 12.1.9 Oscar Health
- 12.1.9.1. Company Overview
- 12.1.9.2. Products
- 12.1.9.3. Company Financials
- 12.1.9.4. SWOT Analysis
- 12.1.10 Adyen
- 12.1.10.1. Company Overview
- 12.1.10.2. Products
- 12.1.10.3. Company Financials
- 12.1.10.4. SWOT Analysis
- 12.1.11 Avant**List Not Exhaustive
- 12.1.11.1. Company Overview
- 12.1.11.2. Products
- 12.1.11.3. Company Financials
- 12.1.11.4. SWOT Analysis
- 12.1.12 Paypal
- 12.1.12.1. Company Overview
- 12.1.12.2. Products
- 12.1.12.3. Company Financials
- 12.1.12.4. SWOT Analysis
- 12.1.13 Atom Bank
- 12.1.13.1. Company Overview
- 12.1.13.2. Products
- 12.1.13.3. Company Financials
- 12.1.13.4. SWOT Analysis
- 12.1.1 Ally Financials
- 12.2. Market Entropy
- 12.2.1 Company's Key Areas Served
- 12.2.2 Recent Developments
- 12.3. Company Market Share Analysis 2025
- 12.3.1 Top 5 Companies Market Share Analysis
- 12.3.2 Top 3 Companies Market Share Analysis
- 12.4. List of Potential Customers
- 13. Research Methodology
List of Figures
- Figure 1: Global Fintech Market Revenue Breakdown (Million, %) by Region 2025 & 2033
- Figure 2: North America Fintech Market Revenue (Million), by Service Proposition 2025 & 2033
- Figure 3: North America Fintech Market Revenue Share (%), by Service Proposition 2025 & 2033
- Figure 4: North America Fintech Market Revenue (Million), by Country 2025 & 2033
- Figure 5: North America Fintech Market Revenue Share (%), by Country 2025 & 2033
- Figure 6: Europe Fintech Market Revenue (Million), by Service Proposition 2025 & 2033
- Figure 7: Europe Fintech Market Revenue Share (%), by Service Proposition 2025 & 2033
- Figure 8: Europe Fintech Market Revenue (Million), by Country 2025 & 2033
- Figure 9: Europe Fintech Market Revenue Share (%), by Country 2025 & 2033
- Figure 10: Latin America Fintech Market Revenue (Million), by Service Proposition 2025 & 2033
- Figure 11: Latin America Fintech Market Revenue Share (%), by Service Proposition 2025 & 2033
- Figure 12: Latin America Fintech Market Revenue (Million), by Country 2025 & 2033
- Figure 13: Latin America Fintech Market Revenue Share (%), by Country 2025 & 2033
- Figure 14: Asia Pacific Fintech Market Revenue (Million), by Service Proposition 2025 & 2033
- Figure 15: Asia Pacific Fintech Market Revenue Share (%), by Service Proposition 2025 & 2033
- Figure 16: Asia Pacific Fintech Market Revenue (Million), by Country 2025 & 2033
- Figure 17: Asia Pacific Fintech Market Revenue Share (%), by Country 2025 & 2033
- Figure 18: Middle East and Africa Fintech Market Revenue (Million), by Service Proposition 2025 & 2033
- Figure 19: Middle East and Africa Fintech Market Revenue Share (%), by Service Proposition 2025 & 2033
- Figure 20: Middle East and Africa Fintech Market Revenue (Million), by Country 2025 & 2033
- Figure 21: Middle East and Africa Fintech Market Revenue Share (%), by Country 2025 & 2033
List of Tables
- Table 1: Global Fintech Market Revenue Million Forecast, by Service Proposition 2020 & 2033
- Table 2: Global Fintech Market Revenue Million Forecast, by Region 2020 & 2033
- Table 3: Global Fintech Market Revenue Million Forecast, by Service Proposition 2020 & 2033
- Table 4: Global Fintech Market Revenue Million Forecast, by Country 2020 & 2033
- Table 5: United States Fintech Market Revenue (Million) Forecast, by Application 2020 & 2033
- Table 6: Canada Fintech Market Revenue (Million) Forecast, by Application 2020 & 2033
- Table 7: Rest of North America Fintech Market Revenue (Million) Forecast, by Application 2020 & 2033
- Table 8: Global Fintech Market Revenue Million Forecast, by Service Proposition 2020 & 2033
- Table 9: Global Fintech Market Revenue Million Forecast, by Country 2020 & 2033
- Table 10: United Kingdom Fintech Market Revenue (Million) Forecast, by Application 2020 & 2033
- Table 11: Germany Fintech Market Revenue (Million) Forecast, by Application 2020 & 2033
- Table 12: France Fintech Market Revenue (Million) Forecast, by Application 2020 & 2033
- Table 13: Spain Fintech Market Revenue (Million) Forecast, by Application 2020 & 2033
- Table 14: Rest of Europe Fintech Market Revenue (Million) Forecast, by Application 2020 & 2033
- Table 15: Global Fintech Market Revenue Million Forecast, by Service Proposition 2020 & 2033
- Table 16: Global Fintech Market Revenue Million Forecast, by Country 2020 & 2033
- Table 17: Brazil Fintech Market Revenue (Million) Forecast, by Application 2020 & 2033
- Table 18: Argentina Fintech Market Revenue (Million) Forecast, by Application 2020 & 2033
- Table 19: Mexico Fintech Market Revenue (Million) Forecast, by Application 2020 & 2033
- Table 20: Rest of Latin America Fintech Market Revenue (Million) Forecast, by Application 2020 & 2033
- Table 21: Global Fintech Market Revenue Million Forecast, by Service Proposition 2020 & 2033
- Table 22: Global Fintech Market Revenue Million Forecast, by Country 2020 & 2033
- Table 23: China Fintech Market Revenue (Million) Forecast, by Application 2020 & 2033
- Table 24: India Fintech Market Revenue (Million) Forecast, by Application 2020 & 2033
- Table 25: Japan Fintech Market Revenue (Million) Forecast, by Application 2020 & 2033
- Table 26: South Korea Fintech Market Revenue (Million) Forecast, by Application 2020 & 2033
- Table 27: Rest of Asia Pacific Fintech Market Revenue (Million) Forecast, by Application 2020 & 2033
- Table 28: Global Fintech Market Revenue Million Forecast, by Service Proposition 2020 & 2033
- Table 29: Global Fintech Market Revenue Million Forecast, by Country 2020 & 2033
- Table 30: United Arab Emirates Fintech Market Revenue (Million) Forecast, by Application 2020 & 2033
- Table 31: Saudi Arabia Fintech Market Revenue (Million) Forecast, by Application 2020 & 2033
- Table 32: Rest of Middle East and Africa Fintech Market Revenue (Million) Forecast, by Application 2020 & 2033
Frequently Asked Questions
1. What is the projected Compound Annual Growth Rate (CAGR) of the Fintech Market?
The projected CAGR is approximately > 14.00%.
2. Which companies are prominent players in the Fintech Market?
Key companies in the market include Ally Financials, N, Zhong An International, Ant Financials, CoinBase, Klarna, Robinhood, SoFi, Oscar Health, Adyen, Avant**List Not Exhaustive, Paypal, Atom Bank.
3. What are the main segments of the Fintech Market?
The market segments include Service Proposition.
4. Can you provide details about the market size?
The market size is estimated to be USD 312.92 Million as of 2022.
5. What are some drivers contributing to market growth?
Rise of Digital Payments; Rising Investments in FinTech Firms.
6. What are the notable trends driving market growth?
Surging Adoption of Digital Payments is Driving the Market.
7. Are there any restraints impacting market growth?
Intense Competition; Increasing Cybersecurity Risks.
8. Can you provide examples of recent developments in the market?
March 2023: MANGOPAY and PayPal expanded their long-term strategic collaboration to give marketplaces instant access to PayPal's international payment capabilities.
9. What pricing options are available for accessing the report?
Pricing options include single-user, multi-user, and enterprise licenses priced at USD 4750, USD 5250, and USD 8750 respectively.
10. Is the market size provided in terms of value or volume?
The market size is provided in terms of value, measured in Million.
11. Are there any specific market keywords associated with the report?
Yes, the market keyword associated with the report is "Fintech Market," which aids in identifying and referencing the specific market segment covered.
12. How do I determine which pricing option suits my needs best?
The pricing options vary based on user requirements and access needs. Individual users may opt for single-user licenses, while businesses requiring broader access may choose multi-user or enterprise licenses for cost-effective access to the report.
13. Are there any additional resources or data provided in the Fintech Market report?
While the report offers comprehensive insights, it's advisable to review the specific contents or supplementary materials provided to ascertain if additional resources or data are available.
14. How can I stay updated on further developments or reports in the Fintech Market?
To stay informed about further developments, trends, and reports in the Fintech Market, consider subscribing to industry newsletters, following relevant companies and organizations, or regularly checking reputable industry news sources and publications.
Methodology
Step 1 - Identification of Relevant Samples Size from Population Database


Step 2 - Approaches for Defining Global Market Size (Value, Volume* & Price*)

Note*: In applicable scenarios
Step 3 - Data Sources
Primary Research
- Web Analytics
- Survey Reports
- Research Institute
- Latest Research Reports
- Opinion Leaders
Secondary Research
- Annual Reports
- White Paper
- Latest Press Release
- Industry Association
- Paid Database
- Investor Presentations

Step 4 - Data Triangulation
Involves using different sources of information in order to increase the validity of a study
These sources are likely to be stakeholders in a program - participants, other researchers, program staff, other community members, and so on.
Then we put all data in single framework & apply various statistical tools to find out the dynamic on the market.
During the analysis stage, feedback from the stakeholder groups would be compared to determine areas of agreement as well as areas of divergence