

Key Insights
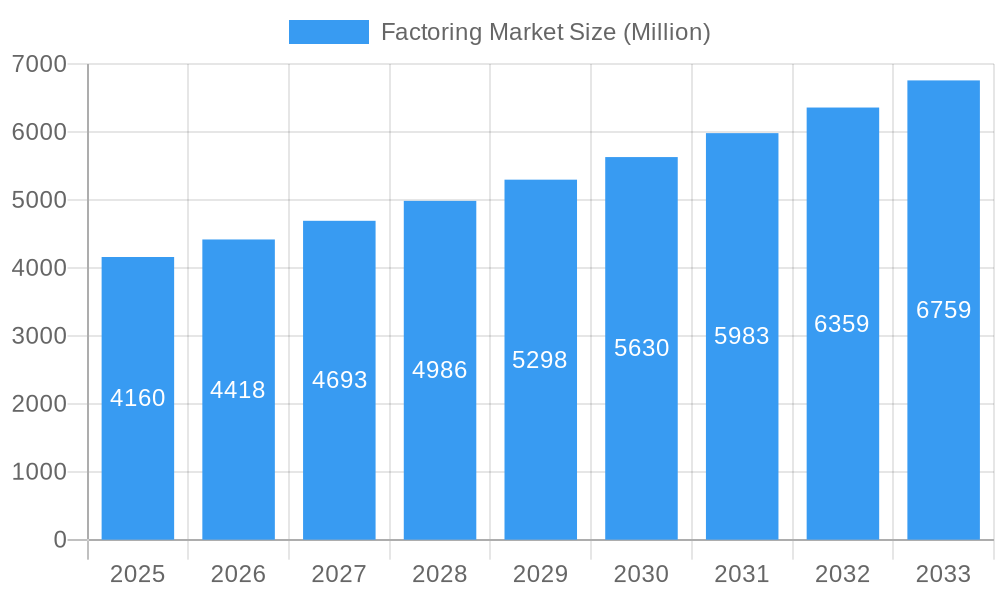
The global factoring market, valued at $4.16 billion in 2025, is projected to experience robust growth, exhibiting a Compound Annual Growth Rate (CAGR) of 6.05% from 2025 to 2033. This growth is driven by several key factors. The increasing preference for streamlined financing solutions among small and medium-sized enterprises (SMEs) fuels demand for factoring services, which offer quicker access to capital compared to traditional bank loans. Furthermore, the expanding e-commerce sector and the rise of digital platforms are facilitating the adoption of online factoring solutions, enhancing efficiency and transparency in the process. The growing globalization of businesses also contributes to market expansion, as companies seek efficient ways to manage international trade receivables. While regulatory hurdles and potential credit risks associated with factoring pose some challenges, the overall market outlook remains positive, driven by the continuous demand for flexible and accessible financing options.
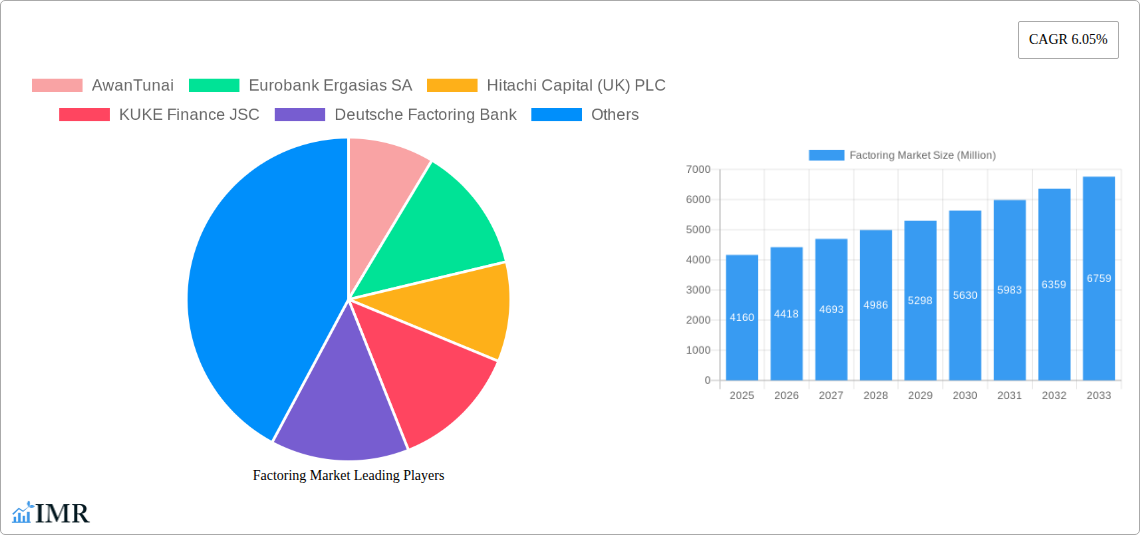
Factoring Market Market Size (In Billion)
The competitive landscape is marked by the presence of both established financial institutions and specialized factoring companies. Major players like AwanTunai, Eurobank Ergasias SA, Hitachi Capital (UK) PLC, KUKE Finance JSC, Deutsche Factoring Bank, Barclays PLC, BNP Paribas, Mizuho Financial Group Inc, and RTS Financial Service Inc. are actively competing to capture market share. These companies are constantly innovating their service offerings, leveraging technological advancements to improve their efficiency and expand their reach. The strategic partnerships between factoring companies and technology providers are further enhancing the overall market dynamics. Future growth will likely be shaped by the evolution of fintech, the increasing adoption of artificial intelligence (AI) and machine learning (ML) in credit risk assessment, and the ongoing expansion of factoring services into new geographical markets.
Factoring Market Company Market Share
Factoring Market: A Comprehensive Report (2019-2033)
This in-depth report provides a comprehensive analysis of the Factoring Market, encompassing market dynamics, growth trends, regional dominance, product landscape, key players, and future outlook. The study period spans from 2019 to 2033, with 2025 serving as the base and estimated year. The report leverages extensive data analysis to offer valuable insights for industry professionals and investors seeking to navigate this dynamic market. The report covers both the parent market (Financial Services) and the child market (Factoring).
Factoring Market Dynamics & Structure
The Factoring Market exhibits a moderately consolidated structure, with several major players vying for market share. Technological innovation, driven by fintech advancements, is a key driver, while regulatory frameworks significantly impact market operations. The market witnesses continuous M&A activity, reshaping the competitive landscape. Substitute products, such as traditional lending, pose a challenge, although factoring’s speed and efficiency offer a distinct advantage. End-user demographics are diverse, encompassing SMEs and large enterprises across various industries.
- Market Concentration: xx% of the market is held by the top 5 players (estimated).
- Technological Innovation: Fintech solutions are streamlining processes, boosting efficiency, and enhancing accessibility.
- Regulatory Framework: Varying regulations across jurisdictions influence market growth and operations.
- Competitive Product Substitutes: Traditional bank loans and other forms of financing present competitive pressure.
- M&A Trends: A steady stream of mergers and acquisitions reflects market consolidation and expansion strategies. xx major deals were recorded between 2019 and 2024 (estimated).
- End-User Demographics: The market caters to a broad range of businesses, from SMEs to large corporations, spanning diverse sectors.
Factoring Market Growth Trends & Insights
The Factoring Market has witnessed robust growth over the historical period (2019-2024), with a CAGR of xx%. This growth is fueled by increasing adoption rates among SMEs seeking flexible financing options. Technological disruptions, such as AI-powered credit assessment and automated invoice processing, are further accelerating market expansion. Consumer behavior shifts toward faster payment cycles and improved cash flow management are also contributing factors. The market is expected to maintain a healthy CAGR of xx% during the forecast period (2025-2033), reaching a market size of xx Million by 2033. Market penetration is expected to reach xx% by 2033.
Dominant Regions, Countries, or Segments in Factoring Market
North America currently holds the largest market share, driven by strong economic activity and the high adoption of factoring services among SMEs and large corporations. Europe follows as a significant market, with consistent growth propelled by favorable regulatory environments and a thriving entrepreneurial ecosystem. Asia-Pacific presents considerable growth potential due to rapid economic expansion and increasing awareness of factoring solutions.
- North America: High adoption rates, strong economic activity, advanced technological infrastructure.
- Europe: Favorable regulatory landscape, robust SME sector, increasing demand for efficient financing.
- Asia-Pacific: Rapid economic growth, burgeoning SME sector, untapped market potential.
Factoring Market Product Landscape
The Factoring Market offers a variety of products tailored to diverse client needs. These include invoice discounting, recourse factoring, and non-recourse factoring, among others. Recent innovations involve the integration of AI and machine learning for enhanced risk assessment and automated processes. Unique selling propositions often center around speed, efficiency, and flexible financing terms.
Key Drivers, Barriers & Challenges in Factoring Market
Key Drivers: Increasing demand for fast and efficient financing solutions by SMEs, technological advancements leading to automation and improved efficiency, and favorable regulatory environments in certain regions are key drivers.
Key Challenges: Competition from traditional lenders, stringent regulatory compliance requirements, and economic downturns that impact borrower creditworthiness pose significant challenges. Supply chain disruptions can also impact the factoring market negatively. The overall impact of these challenges on market growth is estimated at xx% (predicted).
Emerging Opportunities in Factoring Market
Untapped markets in developing economies, the increasing adoption of digital platforms and cross-border transactions present significant opportunities. Innovative applications of blockchain technology for secure and transparent invoice processing also offer considerable potential.
Growth Accelerators in the Factoring Market Industry
Technological breakthroughs in AI and machine learning are streamlining operations and enhancing risk assessment. Strategic partnerships between fintech companies and traditional financial institutions are fostering market expansion. Expanding into underserved markets and offering tailored solutions to specific industry segments are also significant growth catalysts.
Key Players Shaping the Factoring Market Market
- AwanTunai
- Eurobank Ergasias SA
- Hitachi Capital (UK) PLC
- KUKE Finance JSC
- Deutsche Factoring Bank
- Barclays PLC
- BNP Paribas
- Mizuho Financial Group Inc
- RTS Financial Service Inc
- List Not Exhaustive
Notable Milestones in Factoring Market Sector
- November 2023: Eurobank's investment in Plum Fintech signals increased interest in fintech integration within the factoring sector.
- January 2023: The GE and KUKE partnership highlights the role of factoring in supporting large-scale, sustainable energy projects.
- October 2022: BNP Paribas' acquisition of Kantox underscores the importance of technological innovation in streamlining corporate FX and cross-border payments within the broader factoring ecosystem.
In-Depth Factoring Market Market Outlook
The Factoring Market is poised for sustained growth, driven by technological advancements and expanding adoption across various sectors. Strategic partnerships and market expansion initiatives will further fuel growth. The untapped potential in emerging markets and the increasing demand for innovative financing solutions promise substantial future opportunities.
Factoring Market Segmentation
-
1. Provider
- 1.1. Banks
- 1.2. NBFCs
-
2. Enterprise Size
- 2.1. Large Enterprises
- 2.2. SMEs
-
3. Application
- 3.1. Domestic
- 3.2. International
-
4. End User
- 4.1. Construction
- 4.2. Manufacturing
- 4.3. Healthcare
- 4.4. Transportation and Logistics
- 4.5. Energy and Utilities
- 4.6. IT and Telecom
- 4.7. Staffing
- 4.8. Other En
Factoring Market Segmentation By Geography
-
1. North America
- 1.1. United States
- 1.2. Canada
- 1.3. Mexico
-
2. South America
- 2.1. Brazil
- 2.2. Argentina
- 2.3. Rest of South America
-
3. Europe
- 3.1. United Kingdom
- 3.2. Germany
- 3.3. France
- 3.4. Italy
- 3.5. Spain
- 3.6. Russia
- 3.7. Benelux
- 3.8. Nordics
- 3.9. Rest of Europe
-
4. Middle East & Africa
- 4.1. Turkey
- 4.2. Israel
- 4.3. GCC
- 4.4. North Africa
- 4.5. South Africa
- 4.6. Rest of Middle East & Africa
-
5. Asia Pacific
- 5.1. China
- 5.2. India
- 5.3. Japan
- 5.4. South Korea
- 5.5. ASEAN
- 5.6. Oceania
- 5.7. Rest of Asia Pacific
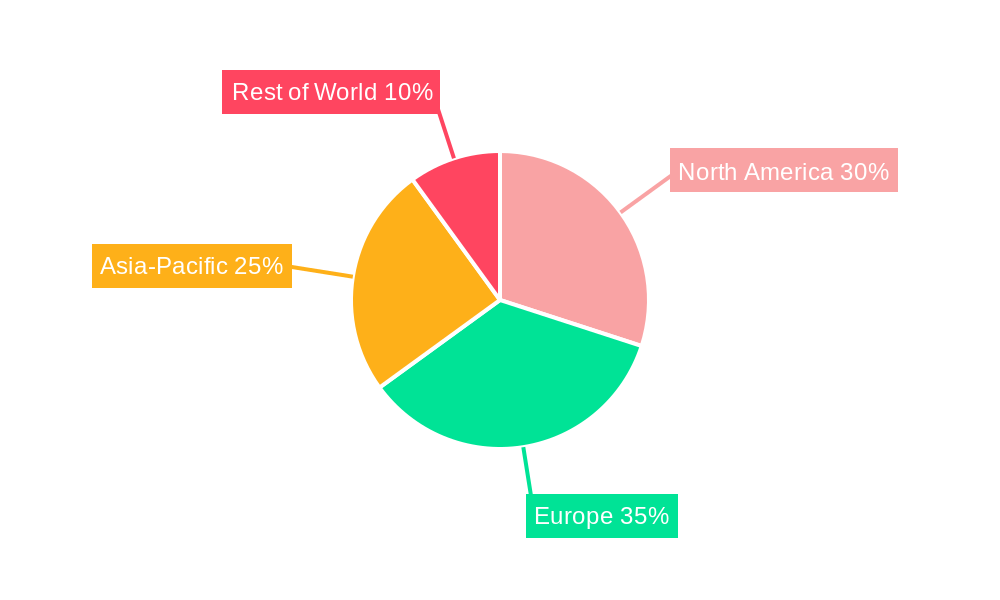
Factoring Market Regional Market Share
Geographic Coverage of Factoring Market
Factoring Market REPORT HIGHLIGHTS
| Aspects | Details |
|---|---|
| Study Period | 2020-2034 |
| Base Year | 2025 |
| Estimated Year | 2026 |
| Forecast Period | 2026-2034 |
| Historical Period | 2020-2025 |
| Growth Rate | CAGR of 6.05% from 2020-2034 |
| Segmentation |
|
Table of Contents
- 1. Introduction
- 1.1. Research Scope
- 1.2. Market Segmentation
- 1.3. Research Objective
- 1.4. Definitions and Assumptions
- 2. Executive Summary
- 2.1. Market Snapshot
- 3. Market Dynamics
- 3.1. Market Drivers
- 3.2. Market Restrains
- 3.3. Market Trends
- 3.4. Market Opportunities
- 4. Market Factor Analysis
- 4.1. Porters Five Forces
- 4.1.1. Bargaining Power of Suppliers
- 4.1.2. Bargaining Power of Buyers
- 4.1.3. Threat of New Entrants
- 4.1.4. Threat of Substitutes
- 4.1.5. Competitive Rivalry
- 4.2. PESTEL analysis
- 4.3. BCG Analysis
- 4.3.1. Stars (High Growth, High Market Share)
- 4.3.2. Cash Cows (Low Growth, High Market Share)
- 4.3.3. Question Mark (High Growth, Low Market Share)
- 4.3.4. Dogs (Low Growth, Low Market Share)
- 4.4. Ansoff Matrix Analysis
- 4.5. Supply Chain Analysis
- 4.6. Regulatory Landscape
- 4.7. Current Market Potential and Opportunity Assessment (TAM–SAM–SOM Framework)
- 4.8. IMR Analyst Note
- 4.1. Porters Five Forces
- 5. Market Analysis, Insights and Forecast 2021-2033
- 5.1. Market Analysis, Insights and Forecast - by Provider
- 5.1.1. Banks
- 5.1.2. NBFCs
- 5.2. Market Analysis, Insights and Forecast - by Enterprise Size
- 5.2.1. Large Enterprises
- 5.2.2. SMEs
- 5.3. Market Analysis, Insights and Forecast - by Application
- 5.3.1. Domestic
- 5.3.2. International
- 5.4. Market Analysis, Insights and Forecast - by End User
- 5.4.1. Construction
- 5.4.2. Manufacturing
- 5.4.3. Healthcare
- 5.4.4. Transportation and Logistics
- 5.4.5. Energy and Utilities
- 5.4.6. IT and Telecom
- 5.4.7. Staffing
- 5.4.8. Other En
- 5.5. Market Analysis, Insights and Forecast - by Region
- 5.5.1. North America
- 5.5.2. South America
- 5.5.3. Europe
- 5.5.4. Middle East & Africa
- 5.5.5. Asia Pacific
- 5.1. Market Analysis, Insights and Forecast - by Provider
- 6. Global Factoring Market Analysis, Insights and Forecast, 2021-2033
- 6.1. Market Analysis, Insights and Forecast - by Provider
- 6.1.1. Banks
- 6.1.2. NBFCs
- 6.2. Market Analysis, Insights and Forecast - by Enterprise Size
- 6.2.1. Large Enterprises
- 6.2.2. SMEs
- 6.3. Market Analysis, Insights and Forecast - by Application
- 6.3.1. Domestic
- 6.3.2. International
- 6.4. Market Analysis, Insights and Forecast - by End User
- 6.4.1. Construction
- 6.4.2. Manufacturing
- 6.4.3. Healthcare
- 6.4.4. Transportation and Logistics
- 6.4.5. Energy and Utilities
- 6.4.6. IT and Telecom
- 6.4.7. Staffing
- 6.4.8. Other En
- 6.1. Market Analysis, Insights and Forecast - by Provider
- 7. North America Factoring Market Analysis, Insights and Forecast, 2020-2032
- 7.1. Market Analysis, Insights and Forecast - by Provider
- 7.1.1. Banks
- 7.1.2. NBFCs
- 7.2. Market Analysis, Insights and Forecast - by Enterprise Size
- 7.2.1. Large Enterprises
- 7.2.2. SMEs
- 7.3. Market Analysis, Insights and Forecast - by Application
- 7.3.1. Domestic
- 7.3.2. International
- 7.4. Market Analysis, Insights and Forecast - by End User
- 7.4.1. Construction
- 7.4.2. Manufacturing
- 7.4.3. Healthcare
- 7.4.4. Transportation and Logistics
- 7.4.5. Energy and Utilities
- 7.4.6. IT and Telecom
- 7.4.7. Staffing
- 7.4.8. Other En
- 7.1. Market Analysis, Insights and Forecast - by Provider
- 8. South America Factoring Market Analysis, Insights and Forecast, 2020-2032
- 8.1. Market Analysis, Insights and Forecast - by Provider
- 8.1.1. Banks
- 8.1.2. NBFCs
- 8.2. Market Analysis, Insights and Forecast - by Enterprise Size
- 8.2.1. Large Enterprises
- 8.2.2. SMEs
- 8.3. Market Analysis, Insights and Forecast - by Application
- 8.3.1. Domestic
- 8.3.2. International
- 8.4. Market Analysis, Insights and Forecast - by End User
- 8.4.1. Construction
- 8.4.2. Manufacturing
- 8.4.3. Healthcare
- 8.4.4. Transportation and Logistics
- 8.4.5. Energy and Utilities
- 8.4.6. IT and Telecom
- 8.4.7. Staffing
- 8.4.8. Other En
- 8.1. Market Analysis, Insights and Forecast - by Provider
- 9. Europe Factoring Market Analysis, Insights and Forecast, 2020-2032
- 9.1. Market Analysis, Insights and Forecast - by Provider
- 9.1.1. Banks
- 9.1.2. NBFCs
- 9.2. Market Analysis, Insights and Forecast - by Enterprise Size
- 9.2.1. Large Enterprises
- 9.2.2. SMEs
- 9.3. Market Analysis, Insights and Forecast - by Application
- 9.3.1. Domestic
- 9.3.2. International
- 9.4. Market Analysis, Insights and Forecast - by End User
- 9.4.1. Construction
- 9.4.2. Manufacturing
- 9.4.3. Healthcare
- 9.4.4. Transportation and Logistics
- 9.4.5. Energy and Utilities
- 9.4.6. IT and Telecom
- 9.4.7. Staffing
- 9.4.8. Other En
- 9.1. Market Analysis, Insights and Forecast - by Provider
- 10. Middle East & Africa Factoring Market Analysis, Insights and Forecast, 2020-2032
- 10.1. Market Analysis, Insights and Forecast - by Provider
- 10.1.1. Banks
- 10.1.2. NBFCs
- 10.2. Market Analysis, Insights and Forecast - by Enterprise Size
- 10.2.1. Large Enterprises
- 10.2.2. SMEs
- 10.3. Market Analysis, Insights and Forecast - by Application
- 10.3.1. Domestic
- 10.3.2. International
- 10.4. Market Analysis, Insights and Forecast - by End User
- 10.4.1. Construction
- 10.4.2. Manufacturing
- 10.4.3. Healthcare
- 10.4.4. Transportation and Logistics
- 10.4.5. Energy and Utilities
- 10.4.6. IT and Telecom
- 10.4.7. Staffing
- 10.4.8. Other En
- 10.1. Market Analysis, Insights and Forecast - by Provider
- 11. Asia Pacific Factoring Market Analysis, Insights and Forecast, 2020-2032
- 11.1. Market Analysis, Insights and Forecast - by Provider
- 11.1.1. Banks
- 11.1.2. NBFCs
- 11.2. Market Analysis, Insights and Forecast - by Enterprise Size
- 11.2.1. Large Enterprises
- 11.2.2. SMEs
- 11.3. Market Analysis, Insights and Forecast - by Application
- 11.3.1. Domestic
- 11.3.2. International
- 11.4. Market Analysis, Insights and Forecast - by End User
- 11.4.1. Construction
- 11.4.2. Manufacturing
- 11.4.3. Healthcare
- 11.4.4. Transportation and Logistics
- 11.4.5. Energy and Utilities
- 11.4.6. IT and Telecom
- 11.4.7. Staffing
- 11.4.8. Other En
- 11.1. Market Analysis, Insights and Forecast - by Provider
- 12. Competitive Analysis
- 12.1. Company Profiles
- 12.1.1 AwanTunai
- 12.1.1.1. Company Overview
- 12.1.1.2. Products
- 12.1.1.3. Company Financials
- 12.1.1.4. SWOT Analysis
- 12.1.2 Eurobank Ergasias SA
- 12.1.2.1. Company Overview
- 12.1.2.2. Products
- 12.1.2.3. Company Financials
- 12.1.2.4. SWOT Analysis
- 12.1.3 Hitachi Capital (UK) PLC
- 12.1.3.1. Company Overview
- 12.1.3.2. Products
- 12.1.3.3. Company Financials
- 12.1.3.4. SWOT Analysis
- 12.1.4 KUKE Finance JSC
- 12.1.4.1. Company Overview
- 12.1.4.2. Products
- 12.1.4.3. Company Financials
- 12.1.4.4. SWOT Analysis
- 12.1.5 Deutsche Factoring Bank
- 12.1.5.1. Company Overview
- 12.1.5.2. Products
- 12.1.5.3. Company Financials
- 12.1.5.4. SWOT Analysis
- 12.1.6 Deutsche Factoring Bank
- 12.1.6.1. Company Overview
- 12.1.6.2. Products
- 12.1.6.3. Company Financials
- 12.1.6.4. SWOT Analysis
- 12.1.7 Barclays PLC
- 12.1.7.1. Company Overview
- 12.1.7.2. Products
- 12.1.7.3. Company Financials
- 12.1.7.4. SWOT Analysis
- 12.1.8 BNP Paribas
- 12.1.8.1. Company Overview
- 12.1.8.2. Products
- 12.1.8.3. Company Financials
- 12.1.8.4. SWOT Analysis
- 12.1.9 Mizuho Financial Group Inc
- 12.1.9.1. Company Overview
- 12.1.9.2. Products
- 12.1.9.3. Company Financials
- 12.1.9.4. SWOT Analysis
- 12.1.10 RTS Financial Service Inc *List Not Exhaustive
- 12.1.10.1. Company Overview
- 12.1.10.2. Products
- 12.1.10.3. Company Financials
- 12.1.10.4. SWOT Analysis
- 12.1.1 AwanTunai
- 12.2. Market Entropy
- 12.2.1 Company's Key Areas Served
- 12.2.2 Recent Developments
- 12.3. Company Market Share Analysis 2025
- 12.3.1 Top 5 Companies Market Share Analysis
- 12.3.2 Top 3 Companies Market Share Analysis
- 12.4. List of Potential Customers
- 13. Research Methodology
List of Figures
- Figure 1: Global Factoring Market Revenue Breakdown (Million, %) by Region 2025 & 2033
- Figure 2: Global Factoring Market Volume Breakdown (Trillion, %) by Region 2025 & 2033
- Figure 3: North America Factoring Market Revenue (Million), by Provider 2025 & 2033
- Figure 4: North America Factoring Market Volume (Trillion), by Provider 2025 & 2033
- Figure 5: North America Factoring Market Revenue Share (%), by Provider 2025 & 2033
- Figure 6: North America Factoring Market Volume Share (%), by Provider 2025 & 2033
- Figure 7: North America Factoring Market Revenue (Million), by Enterprise Size 2025 & 2033
- Figure 8: North America Factoring Market Volume (Trillion), by Enterprise Size 2025 & 2033
- Figure 9: North America Factoring Market Revenue Share (%), by Enterprise Size 2025 & 2033
- Figure 10: North America Factoring Market Volume Share (%), by Enterprise Size 2025 & 2033
- Figure 11: North America Factoring Market Revenue (Million), by Application 2025 & 2033
- Figure 12: North America Factoring Market Volume (Trillion), by Application 2025 & 2033
- Figure 13: North America Factoring Market Revenue Share (%), by Application 2025 & 2033
- Figure 14: North America Factoring Market Volume Share (%), by Application 2025 & 2033
- Figure 15: North America Factoring Market Revenue (Million), by End User 2025 & 2033
- Figure 16: North America Factoring Market Volume (Trillion), by End User 2025 & 2033
- Figure 17: North America Factoring Market Revenue Share (%), by End User 2025 & 2033
- Figure 18: North America Factoring Market Volume Share (%), by End User 2025 & 2033
- Figure 19: North America Factoring Market Revenue (Million), by Country 2025 & 2033
- Figure 20: North America Factoring Market Volume (Trillion), by Country 2025 & 2033
- Figure 21: North America Factoring Market Revenue Share (%), by Country 2025 & 2033
- Figure 22: North America Factoring Market Volume Share (%), by Country 2025 & 2033
- Figure 23: South America Factoring Market Revenue (Million), by Provider 2025 & 2033
- Figure 24: South America Factoring Market Volume (Trillion), by Provider 2025 & 2033
- Figure 25: South America Factoring Market Revenue Share (%), by Provider 2025 & 2033
- Figure 26: South America Factoring Market Volume Share (%), by Provider 2025 & 2033
- Figure 27: South America Factoring Market Revenue (Million), by Enterprise Size 2025 & 2033
- Figure 28: South America Factoring Market Volume (Trillion), by Enterprise Size 2025 & 2033
- Figure 29: South America Factoring Market Revenue Share (%), by Enterprise Size 2025 & 2033
- Figure 30: South America Factoring Market Volume Share (%), by Enterprise Size 2025 & 2033
- Figure 31: South America Factoring Market Revenue (Million), by Application 2025 & 2033
- Figure 32: South America Factoring Market Volume (Trillion), by Application 2025 & 2033
- Figure 33: South America Factoring Market Revenue Share (%), by Application 2025 & 2033
- Figure 34: South America Factoring Market Volume Share (%), by Application 2025 & 2033
- Figure 35: South America Factoring Market Revenue (Million), by End User 2025 & 2033
- Figure 36: South America Factoring Market Volume (Trillion), by End User 2025 & 2033
- Figure 37: South America Factoring Market Revenue Share (%), by End User 2025 & 2033
- Figure 38: South America Factoring Market Volume Share (%), by End User 2025 & 2033
- Figure 39: South America Factoring Market Revenue (Million), by Country 2025 & 2033
- Figure 40: South America Factoring Market Volume (Trillion), by Country 2025 & 2033
- Figure 41: South America Factoring Market Revenue Share (%), by Country 2025 & 2033
- Figure 42: South America Factoring Market Volume Share (%), by Country 2025 & 2033
- Figure 43: Europe Factoring Market Revenue (Million), by Provider 2025 & 2033
- Figure 44: Europe Factoring Market Volume (Trillion), by Provider 2025 & 2033
- Figure 45: Europe Factoring Market Revenue Share (%), by Provider 2025 & 2033
- Figure 46: Europe Factoring Market Volume Share (%), by Provider 2025 & 2033
- Figure 47: Europe Factoring Market Revenue (Million), by Enterprise Size 2025 & 2033
- Figure 48: Europe Factoring Market Volume (Trillion), by Enterprise Size 2025 & 2033
- Figure 49: Europe Factoring Market Revenue Share (%), by Enterprise Size 2025 & 2033
- Figure 50: Europe Factoring Market Volume Share (%), by Enterprise Size 2025 & 2033
- Figure 51: Europe Factoring Market Revenue (Million), by Application 2025 & 2033
- Figure 52: Europe Factoring Market Volume (Trillion), by Application 2025 & 2033
- Figure 53: Europe Factoring Market Revenue Share (%), by Application 2025 & 2033
- Figure 54: Europe Factoring Market Volume Share (%), by Application 2025 & 2033
- Figure 55: Europe Factoring Market Revenue (Million), by End User 2025 & 2033
- Figure 56: Europe Factoring Market Volume (Trillion), by End User 2025 & 2033
- Figure 57: Europe Factoring Market Revenue Share (%), by End User 2025 & 2033
- Figure 58: Europe Factoring Market Volume Share (%), by End User 2025 & 2033
- Figure 59: Europe Factoring Market Revenue (Million), by Country 2025 & 2033
- Figure 60: Europe Factoring Market Volume (Trillion), by Country 2025 & 2033
- Figure 61: Europe Factoring Market Revenue Share (%), by Country 2025 & 2033
- Figure 62: Europe Factoring Market Volume Share (%), by Country 2025 & 2033
- Figure 63: Middle East & Africa Factoring Market Revenue (Million), by Provider 2025 & 2033
- Figure 64: Middle East & Africa Factoring Market Volume (Trillion), by Provider 2025 & 2033
- Figure 65: Middle East & Africa Factoring Market Revenue Share (%), by Provider 2025 & 2033
- Figure 66: Middle East & Africa Factoring Market Volume Share (%), by Provider 2025 & 2033
- Figure 67: Middle East & Africa Factoring Market Revenue (Million), by Enterprise Size 2025 & 2033
- Figure 68: Middle East & Africa Factoring Market Volume (Trillion), by Enterprise Size 2025 & 2033
- Figure 69: Middle East & Africa Factoring Market Revenue Share (%), by Enterprise Size 2025 & 2033
- Figure 70: Middle East & Africa Factoring Market Volume Share (%), by Enterprise Size 2025 & 2033
- Figure 71: Middle East & Africa Factoring Market Revenue (Million), by Application 2025 & 2033
- Figure 72: Middle East & Africa Factoring Market Volume (Trillion), by Application 2025 & 2033
- Figure 73: Middle East & Africa Factoring Market Revenue Share (%), by Application 2025 & 2033
- Figure 74: Middle East & Africa Factoring Market Volume Share (%), by Application 2025 & 2033
- Figure 75: Middle East & Africa Factoring Market Revenue (Million), by End User 2025 & 2033
- Figure 76: Middle East & Africa Factoring Market Volume (Trillion), by End User 2025 & 2033
- Figure 77: Middle East & Africa Factoring Market Revenue Share (%), by End User 2025 & 2033
- Figure 78: Middle East & Africa Factoring Market Volume Share (%), by End User 2025 & 2033
- Figure 79: Middle East & Africa Factoring Market Revenue (Million), by Country 2025 & 2033
- Figure 80: Middle East & Africa Factoring Market Volume (Trillion), by Country 2025 & 2033
- Figure 81: Middle East & Africa Factoring Market Revenue Share (%), by Country 2025 & 2033
- Figure 82: Middle East & Africa Factoring Market Volume Share (%), by Country 2025 & 2033
- Figure 83: Asia Pacific Factoring Market Revenue (Million), by Provider 2025 & 2033
- Figure 84: Asia Pacific Factoring Market Volume (Trillion), by Provider 2025 & 2033
- Figure 85: Asia Pacific Factoring Market Revenue Share (%), by Provider 2025 & 2033
- Figure 86: Asia Pacific Factoring Market Volume Share (%), by Provider 2025 & 2033
- Figure 87: Asia Pacific Factoring Market Revenue (Million), by Enterprise Size 2025 & 2033
- Figure 88: Asia Pacific Factoring Market Volume (Trillion), by Enterprise Size 2025 & 2033
- Figure 89: Asia Pacific Factoring Market Revenue Share (%), by Enterprise Size 2025 & 2033
- Figure 90: Asia Pacific Factoring Market Volume Share (%), by Enterprise Size 2025 & 2033
- Figure 91: Asia Pacific Factoring Market Revenue (Million), by Application 2025 & 2033
- Figure 92: Asia Pacific Factoring Market Volume (Trillion), by Application 2025 & 2033
- Figure 93: Asia Pacific Factoring Market Revenue Share (%), by Application 2025 & 2033
- Figure 94: Asia Pacific Factoring Market Volume Share (%), by Application 2025 & 2033
- Figure 95: Asia Pacific Factoring Market Revenue (Million), by End User 2025 & 2033
- Figure 96: Asia Pacific Factoring Market Volume (Trillion), by End User 2025 & 2033
- Figure 97: Asia Pacific Factoring Market Revenue Share (%), by End User 2025 & 2033
- Figure 98: Asia Pacific Factoring Market Volume Share (%), by End User 2025 & 2033
- Figure 99: Asia Pacific Factoring Market Revenue (Million), by Country 2025 & 2033
- Figure 100: Asia Pacific Factoring Market Volume (Trillion), by Country 2025 & 2033
- Figure 101: Asia Pacific Factoring Market Revenue Share (%), by Country 2025 & 2033
- Figure 102: Asia Pacific Factoring Market Volume Share (%), by Country 2025 & 2033
List of Tables
- Table 1: Global Factoring Market Revenue Million Forecast, by Provider 2020 & 2033
- Table 2: Global Factoring Market Volume Trillion Forecast, by Provider 2020 & 2033
- Table 3: Global Factoring Market Revenue Million Forecast, by Enterprise Size 2020 & 2033
- Table 4: Global Factoring Market Volume Trillion Forecast, by Enterprise Size 2020 & 2033
- Table 5: Global Factoring Market Revenue Million Forecast, by Application 2020 & 2033
- Table 6: Global Factoring Market Volume Trillion Forecast, by Application 2020 & 2033
- Table 7: Global Factoring Market Revenue Million Forecast, by End User 2020 & 2033
- Table 8: Global Factoring Market Volume Trillion Forecast, by End User 2020 & 2033
- Table 9: Global Factoring Market Revenue Million Forecast, by Region 2020 & 2033
- Table 10: Global Factoring Market Volume Trillion Forecast, by Region 2020 & 2033
- Table 11: Global Factoring Market Revenue Million Forecast, by Provider 2020 & 2033
- Table 12: Global Factoring Market Volume Trillion Forecast, by Provider 2020 & 2033
- Table 13: Global Factoring Market Revenue Million Forecast, by Enterprise Size 2020 & 2033
- Table 14: Global Factoring Market Volume Trillion Forecast, by Enterprise Size 2020 & 2033
- Table 15: Global Factoring Market Revenue Million Forecast, by Application 2020 & 2033
- Table 16: Global Factoring Market Volume Trillion Forecast, by Application 2020 & 2033
- Table 17: Global Factoring Market Revenue Million Forecast, by End User 2020 & 2033
- Table 18: Global Factoring Market Volume Trillion Forecast, by End User 2020 & 2033
- Table 19: Global Factoring Market Revenue Million Forecast, by Country 2020 & 2033
- Table 20: Global Factoring Market Volume Trillion Forecast, by Country 2020 & 2033
- Table 21: United States Factoring Market Revenue (Million) Forecast, by Application 2020 & 2033
- Table 22: United States Factoring Market Volume (Trillion) Forecast, by Application 2020 & 2033
- Table 23: Canada Factoring Market Revenue (Million) Forecast, by Application 2020 & 2033
- Table 24: Canada Factoring Market Volume (Trillion) Forecast, by Application 2020 & 2033
- Table 25: Mexico Factoring Market Revenue (Million) Forecast, by Application 2020 & 2033
- Table 26: Mexico Factoring Market Volume (Trillion) Forecast, by Application 2020 & 2033
- Table 27: Global Factoring Market Revenue Million Forecast, by Provider 2020 & 2033
- Table 28: Global Factoring Market Volume Trillion Forecast, by Provider 2020 & 2033
- Table 29: Global Factoring Market Revenue Million Forecast, by Enterprise Size 2020 & 2033
- Table 30: Global Factoring Market Volume Trillion Forecast, by Enterprise Size 2020 & 2033
- Table 31: Global Factoring Market Revenue Million Forecast, by Application 2020 & 2033
- Table 32: Global Factoring Market Volume Trillion Forecast, by Application 2020 & 2033
- Table 33: Global Factoring Market Revenue Million Forecast, by End User 2020 & 2033
- Table 34: Global Factoring Market Volume Trillion Forecast, by End User 2020 & 2033
- Table 35: Global Factoring Market Revenue Million Forecast, by Country 2020 & 2033
- Table 36: Global Factoring Market Volume Trillion Forecast, by Country 2020 & 2033
- Table 37: Brazil Factoring Market Revenue (Million) Forecast, by Application 2020 & 2033
- Table 38: Brazil Factoring Market Volume (Trillion) Forecast, by Application 2020 & 2033
- Table 39: Argentina Factoring Market Revenue (Million) Forecast, by Application 2020 & 2033
- Table 40: Argentina Factoring Market Volume (Trillion) Forecast, by Application 2020 & 2033
- Table 41: Rest of South America Factoring Market Revenue (Million) Forecast, by Application 2020 & 2033
- Table 42: Rest of South America Factoring Market Volume (Trillion) Forecast, by Application 2020 & 2033
- Table 43: Global Factoring Market Revenue Million Forecast, by Provider 2020 & 2033
- Table 44: Global Factoring Market Volume Trillion Forecast, by Provider 2020 & 2033
- Table 45: Global Factoring Market Revenue Million Forecast, by Enterprise Size 2020 & 2033
- Table 46: Global Factoring Market Volume Trillion Forecast, by Enterprise Size 2020 & 2033
- Table 47: Global Factoring Market Revenue Million Forecast, by Application 2020 & 2033
- Table 48: Global Factoring Market Volume Trillion Forecast, by Application 2020 & 2033
- Table 49: Global Factoring Market Revenue Million Forecast, by End User 2020 & 2033
- Table 50: Global Factoring Market Volume Trillion Forecast, by End User 2020 & 2033
- Table 51: Global Factoring Market Revenue Million Forecast, by Country 2020 & 2033
- Table 52: Global Factoring Market Volume Trillion Forecast, by Country 2020 & 2033
- Table 53: United Kingdom Factoring Market Revenue (Million) Forecast, by Application 2020 & 2033
- Table 54: United Kingdom Factoring Market Volume (Trillion) Forecast, by Application 2020 & 2033
- Table 55: Germany Factoring Market Revenue (Million) Forecast, by Application 2020 & 2033
- Table 56: Germany Factoring Market Volume (Trillion) Forecast, by Application 2020 & 2033
- Table 57: France Factoring Market Revenue (Million) Forecast, by Application 2020 & 2033
- Table 58: France Factoring Market Volume (Trillion) Forecast, by Application 2020 & 2033
- Table 59: Italy Factoring Market Revenue (Million) Forecast, by Application 2020 & 2033
- Table 60: Italy Factoring Market Volume (Trillion) Forecast, by Application 2020 & 2033
- Table 61: Spain Factoring Market Revenue (Million) Forecast, by Application 2020 & 2033
- Table 62: Spain Factoring Market Volume (Trillion) Forecast, by Application 2020 & 2033
- Table 63: Russia Factoring Market Revenue (Million) Forecast, by Application 2020 & 2033
- Table 64: Russia Factoring Market Volume (Trillion) Forecast, by Application 2020 & 2033
- Table 65: Benelux Factoring Market Revenue (Million) Forecast, by Application 2020 & 2033
- Table 66: Benelux Factoring Market Volume (Trillion) Forecast, by Application 2020 & 2033
- Table 67: Nordics Factoring Market Revenue (Million) Forecast, by Application 2020 & 2033
- Table 68: Nordics Factoring Market Volume (Trillion) Forecast, by Application 2020 & 2033
- Table 69: Rest of Europe Factoring Market Revenue (Million) Forecast, by Application 2020 & 2033
- Table 70: Rest of Europe Factoring Market Volume (Trillion) Forecast, by Application 2020 & 2033
- Table 71: Global Factoring Market Revenue Million Forecast, by Provider 2020 & 2033
- Table 72: Global Factoring Market Volume Trillion Forecast, by Provider 2020 & 2033
- Table 73: Global Factoring Market Revenue Million Forecast, by Enterprise Size 2020 & 2033
- Table 74: Global Factoring Market Volume Trillion Forecast, by Enterprise Size 2020 & 2033
- Table 75: Global Factoring Market Revenue Million Forecast, by Application 2020 & 2033
- Table 76: Global Factoring Market Volume Trillion Forecast, by Application 2020 & 2033
- Table 77: Global Factoring Market Revenue Million Forecast, by End User 2020 & 2033
- Table 78: Global Factoring Market Volume Trillion Forecast, by End User 2020 & 2033
- Table 79: Global Factoring Market Revenue Million Forecast, by Country 2020 & 2033
- Table 80: Global Factoring Market Volume Trillion Forecast, by Country 2020 & 2033
- Table 81: Turkey Factoring Market Revenue (Million) Forecast, by Application 2020 & 2033
- Table 82: Turkey Factoring Market Volume (Trillion) Forecast, by Application 2020 & 2033
- Table 83: Israel Factoring Market Revenue (Million) Forecast, by Application 2020 & 2033
- Table 84: Israel Factoring Market Volume (Trillion) Forecast, by Application 2020 & 2033
- Table 85: GCC Factoring Market Revenue (Million) Forecast, by Application 2020 & 2033
- Table 86: GCC Factoring Market Volume (Trillion) Forecast, by Application 2020 & 2033
- Table 87: North Africa Factoring Market Revenue (Million) Forecast, by Application 2020 & 2033
- Table 88: North Africa Factoring Market Volume (Trillion) Forecast, by Application 2020 & 2033
- Table 89: South Africa Factoring Market Revenue (Million) Forecast, by Application 2020 & 2033
- Table 90: South Africa Factoring Market Volume (Trillion) Forecast, by Application 2020 & 2033
- Table 91: Rest of Middle East & Africa Factoring Market Revenue (Million) Forecast, by Application 2020 & 2033
- Table 92: Rest of Middle East & Africa Factoring Market Volume (Trillion) Forecast, by Application 2020 & 2033
- Table 93: Global Factoring Market Revenue Million Forecast, by Provider 2020 & 2033
- Table 94: Global Factoring Market Volume Trillion Forecast, by Provider 2020 & 2033
- Table 95: Global Factoring Market Revenue Million Forecast, by Enterprise Size 2020 & 2033
- Table 96: Global Factoring Market Volume Trillion Forecast, by Enterprise Size 2020 & 2033
- Table 97: Global Factoring Market Revenue Million Forecast, by Application 2020 & 2033
- Table 98: Global Factoring Market Volume Trillion Forecast, by Application 2020 & 2033
- Table 99: Global Factoring Market Revenue Million Forecast, by End User 2020 & 2033
- Table 100: Global Factoring Market Volume Trillion Forecast, by End User 2020 & 2033
- Table 101: Global Factoring Market Revenue Million Forecast, by Country 2020 & 2033
- Table 102: Global Factoring Market Volume Trillion Forecast, by Country 2020 & 2033
- Table 103: China Factoring Market Revenue (Million) Forecast, by Application 2020 & 2033
- Table 104: China Factoring Market Volume (Trillion) Forecast, by Application 2020 & 2033
- Table 105: India Factoring Market Revenue (Million) Forecast, by Application 2020 & 2033
- Table 106: India Factoring Market Volume (Trillion) Forecast, by Application 2020 & 2033
- Table 107: Japan Factoring Market Revenue (Million) Forecast, by Application 2020 & 2033
- Table 108: Japan Factoring Market Volume (Trillion) Forecast, by Application 2020 & 2033
- Table 109: South Korea Factoring Market Revenue (Million) Forecast, by Application 2020 & 2033
- Table 110: South Korea Factoring Market Volume (Trillion) Forecast, by Application 2020 & 2033
- Table 111: ASEAN Factoring Market Revenue (Million) Forecast, by Application 2020 & 2033
- Table 112: ASEAN Factoring Market Volume (Trillion) Forecast, by Application 2020 & 2033
- Table 113: Oceania Factoring Market Revenue (Million) Forecast, by Application 2020 & 2033
- Table 114: Oceania Factoring Market Volume (Trillion) Forecast, by Application 2020 & 2033
- Table 115: Rest of Asia Pacific Factoring Market Revenue (Million) Forecast, by Application 2020 & 2033
- Table 116: Rest of Asia Pacific Factoring Market Volume (Trillion) Forecast, by Application 2020 & 2033
Frequently Asked Questions
1. What is the projected Compound Annual Growth Rate (CAGR) of the Factoring Market?
The projected CAGR is approximately 6.05%.
2. Which companies are prominent players in the Factoring Market?
Key companies in the market include AwanTunai, Eurobank Ergasias SA, Hitachi Capital (UK) PLC, KUKE Finance JSC, Deutsche Factoring Bank, Deutsche Factoring Bank, Barclays PLC, BNP Paribas, Mizuho Financial Group Inc, RTS Financial Service Inc *List Not Exhaustive.
3. What are the main segments of the Factoring Market?
The market segments include Provider, Enterprise Size, Application, End User.
4. Can you provide details about the market size?
The market size is estimated to be USD 4.16 Million as of 2022.
5. What are some drivers contributing to market growth?
Rising Adoption of Fintech Among SMEs is Driving Market Growth; Rising International Trade and Digitalization are Driving Market Growth.
6. What are the notable trends driving market growth?
Banks have the Largest Market Share in the Factoring Market.
7. Are there any restraints impacting market growth?
Rising Adoption of Fintech Among SMEs is Driving Market Growth; Rising International Trade and Digitalization are Driving Market Growth.
8. Can you provide examples of recent developments in the market?
November 2023 - Eurobank SA ("Eurobank") disclosed its decision to purchase a minority interest in Plum Fintech Limited ("Plum"), an inventive fintech firm situated in the United Kingdom that provides a sophisticated money management application. Per the agreement's conditions, Eurobank will make an initial investment of EUR 5 million (USD 5.33 million) for its share in Plum, with an additional EUR 5 million (USD 5.33 million) to follow, contingent upon the satisfaction of specific requirements, in the future.
9. What pricing options are available for accessing the report?
Pricing options include single-user, multi-user, and enterprise licenses priced at USD 3800, USD 4500, and USD 5800 respectively.
10. Is the market size provided in terms of value or volume?
The market size is provided in terms of value, measured in Million and volume, measured in Trillion.
11. Are there any specific market keywords associated with the report?
Yes, the market keyword associated with the report is "Factoring Market," which aids in identifying and referencing the specific market segment covered.
12. How do I determine which pricing option suits my needs best?
The pricing options vary based on user requirements and access needs. Individual users may opt for single-user licenses, while businesses requiring broader access may choose multi-user or enterprise licenses for cost-effective access to the report.
13. Are there any additional resources or data provided in the Factoring Market report?
While the report offers comprehensive insights, it's advisable to review the specific contents or supplementary materials provided to ascertain if additional resources or data are available.
14. How can I stay updated on further developments or reports in the Factoring Market?
To stay informed about further developments, trends, and reports in the Factoring Market, consider subscribing to industry newsletters, following relevant companies and organizations, or regularly checking reputable industry news sources and publications.
Methodology
Step 1 - Identification of Relevant Samples Size from Population Database


Step 2 - Approaches for Defining Global Market Size (Value, Volume* & Price*)

Note*: In applicable scenarios
Step 3 - Data Sources
Primary Research
- Web Analytics
- Survey Reports
- Research Institute
- Latest Research Reports
- Opinion Leaders
Secondary Research
- Annual Reports
- White Paper
- Latest Press Release
- Industry Association
- Paid Database
- Investor Presentations

Step 4 - Data Triangulation
Involves using different sources of information in order to increase the validity of a study
These sources are likely to be stakeholders in a program - participants, other researchers, program staff, other community members, and so on.
Then we put all data in single framework & apply various statistical tools to find out the dynamic on the market.
During the analysis stage, feedback from the stakeholder groups would be compared to determine areas of agreement as well as areas of divergence