

Key Insights
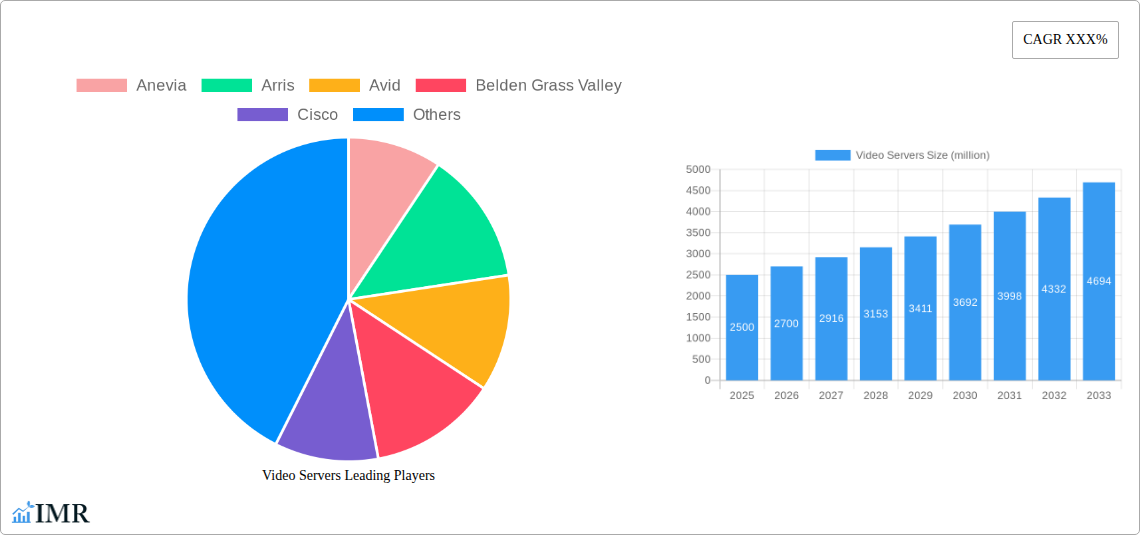
The global video server market is experiencing robust growth, driven by the increasing demand for high-quality video content across various sectors. The surge in streaming services, live event broadcasting, and the proliferation of 4K and 8K video resolutions are key factors propelling market expansion. Technological advancements, such as the adoption of cloud-based solutions and improved video compression techniques, are further enhancing efficiency and scalability, leading to wider adoption. The market is segmented by type (hardware, software), application (broadcast, surveillance, corporate), and deployment (on-premise, cloud). Key players such as Anevia, Arris, Avid, and Cisco are actively engaged in innovation and strategic partnerships to maintain their market positions. We estimate the 2025 market size to be approximately $2.5 billion, based on industry reports showing similar markets (e.g., video encoding/decoding) with comparable growth rates. A conservative Compound Annual Growth Rate (CAGR) of 8% is projected for the forecast period (2025-2033), indicating a substantial market expansion in the coming years.
Despite the positive growth trajectory, certain restraints hinder market growth. High initial investment costs for advanced video server solutions can be a barrier for entry for smaller companies. Furthermore, the increasing complexity of video streaming technologies and the need for skilled personnel to manage and maintain these systems pose challenges for some organizations. However, ongoing technological advancements, along with increasing adoption of cloud-based solutions, are expected to mitigate these limitations over time. The competitive landscape remains dynamic, with established players facing competition from emerging technology providers offering innovative and cost-effective solutions. Future growth will depend on successfully adapting to evolving technological landscapes and consumer demands for higher resolution and more immersive viewing experiences.
Video Servers Market Report: 2019-2033
This comprehensive report provides an in-depth analysis of the global video servers market, encompassing market dynamics, growth trends, regional dominance, product landscapes, and key players. With a study period spanning 2019-2033, a base year of 2025, and a forecast period of 2025-2033, this report is an indispensable resource for industry professionals, investors, and strategists seeking to navigate this dynamic market. The report analyzes the parent market of Media and Entertainment Technology and the child market of Broadcast Equipment. The total market size is predicted to reach xx million units by 2033.
Video Servers Market Dynamics & Structure
The video servers market is characterized by a moderately concentrated landscape with key players like Cisco, Harmonic, and EVS holding significant market share. Technological innovation, driven by advancements in cloud computing, 5G, and AI, is a major growth driver. Regulatory frameworks concerning broadcasting standards and data security influence market dynamics. Competitive product substitutes, such as cloud-based video platforms, pose a challenge. The end-user demographics are primarily broadcasting companies, media production houses, and telecommunication providers. Mergers and acquisitions (M&A) activity has been moderate, with xx deals recorded between 2019 and 2024, resulting in a xx% increase in market concentration.
- Market Concentration: Moderately concentrated, with top 5 players holding approximately xx% of market share in 2024.
- Technological Innovation: Cloud-based solutions, AI-powered video processing, and 5G integration are key drivers.
- Regulatory Landscape: Compliance with broadcasting standards and data privacy regulations is crucial.
- Competitive Substitutes: Cloud-based video platforms and Software Defined Video Encoding solutions are posing a competitive challenge.
- M&A Activity: xx deals between 2019 and 2024.
Video Servers Growth Trends & Insights
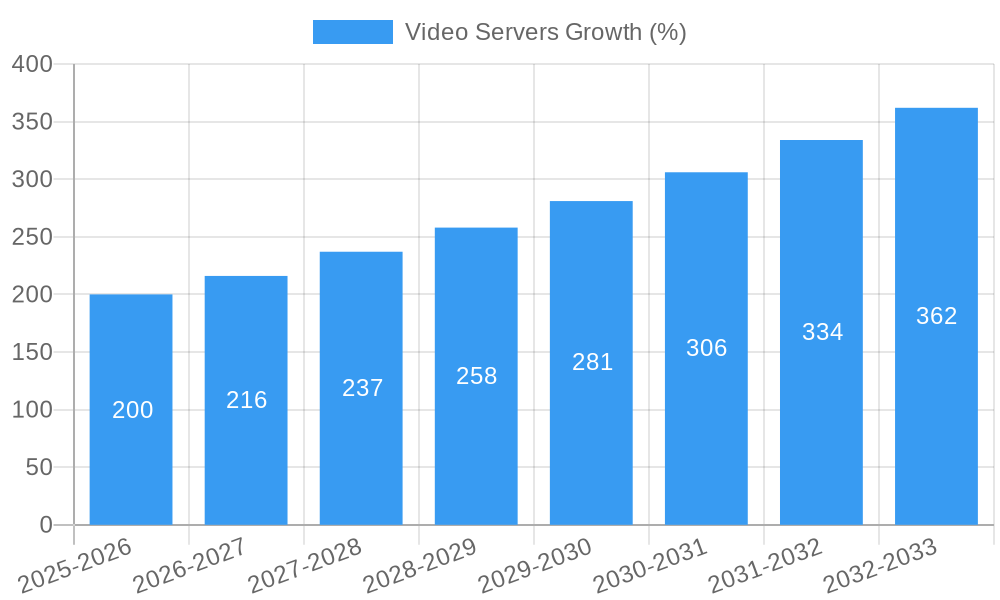
The global video server market experienced a CAGR of xx% during the historical period (2019-2024), reaching an estimated market size of xx million units in 2025. This growth is attributed to rising video consumption, increased adoption of high-definition and 4K video, and the expansion of IP-based broadcasting infrastructure. Technological disruptions, such as the shift towards software-defined video encoding and cloud-based solutions, are reshaping the market. Consumer behavior shifts towards on-demand streaming and personalized content further fuel market growth. The forecast period (2025-2033) projects a CAGR of xx%, driven by the adoption of 8K resolution and immersive technologies such as VR and AR. Market penetration is expected to increase significantly, especially in emerging markets.
Dominant Regions, Countries, or Segments in Video Servers
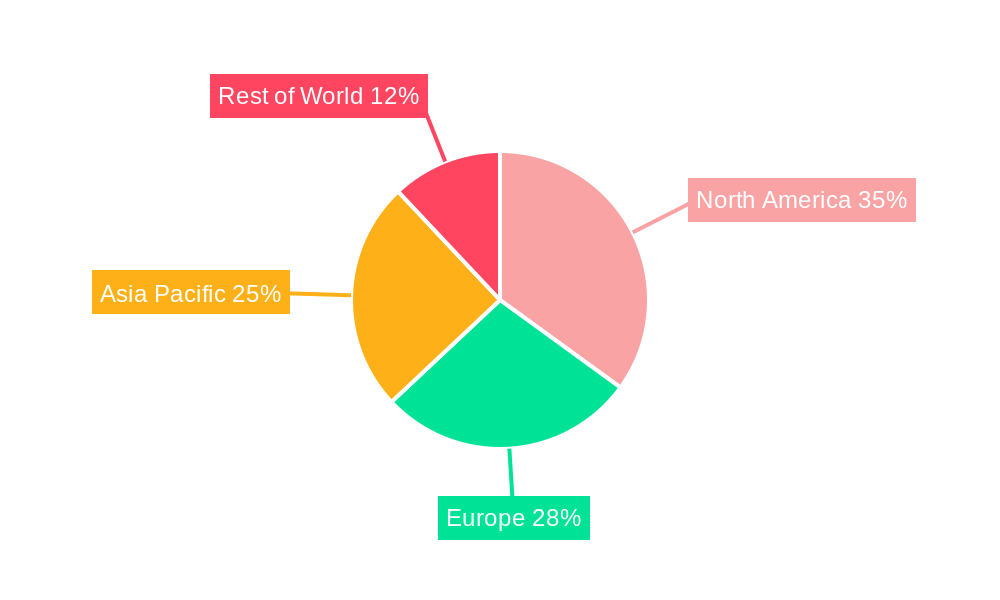
North America currently holds the largest market share in video servers, followed by Europe and Asia-Pacific. This dominance is primarily due to the presence of established broadcasting industries, advanced technological infrastructure, and high per capita video consumption. However, rapid growth is expected in Asia-Pacific, driven by increasing investments in infrastructure development, expanding digital media consumption, and the rise of OTT platforms.
- North America: Strong broadcasting sector, advanced infrastructure, high video consumption.
- Europe: Mature market with a focus on high-quality video production.
- Asia-Pacific: Rapid growth driven by infrastructure development and increasing video consumption.
- Key Drivers: Government investments in infrastructure, rising disposable incomes, and increasing adoption of OTT services.
Video Servers Product Landscape
Video servers are evolving from traditional hardware-based solutions to more flexible software-defined and cloud-based systems. Modern video servers offer advanced features such as high-capacity storage, real-time encoding and transcoding capabilities, and robust content management functionalities. Key performance indicators include latency, encoding efficiency, and scalability. Unique selling propositions often include integration with cloud platforms, support for multiple codecs, and advanced analytics capabilities.
Key Drivers, Barriers & Challenges in Video Servers
Key Drivers: The increasing demand for high-quality video content across various platforms (broadcast, OTT, and corporate), the growing adoption of IP-based broadcasting, and advancements in video compression technologies are driving market growth. Furthermore, government initiatives promoting digital media and infrastructure development are also significant contributors.
Challenges: The high initial investment cost of video servers, the complexity of integration with existing infrastructure, and the competitive pressure from cloud-based alternatives pose significant challenges to market expansion. Supply chain disruptions and cybersecurity concerns also add complexity. Approximately xx% of potential customers face budgetary limitations restricting adoption.
Emerging Opportunities in Video Servers
The increasing adoption of 8K video, the growth of virtual and augmented reality applications, and the expanding market for live streaming services present significant growth opportunities. Furthermore, the integration of AI and machine learning into video processing pipelines offers potential for improved efficiency and automation. Untapped markets in developing economies also represent a significant growth potential.
Growth Accelerators in the Video Servers Industry
Strategic partnerships between video server vendors and cloud providers are accelerating market growth. Technological breakthroughs, such as advancements in AI-powered video processing and low-latency streaming technologies, are also fueling expansion. Moreover, the increasing adoption of software-defined video encoding is driving flexibility and reducing deployment costs.
Key Players Shaping the Video Servers Market
- Anevia
- Arris
- Avid
- Belden Grass Valley
- Cisco
- Concurrent
- EVS
- Edgeware
- Espial
- Harmonic
- Imagine
- Ross Video
- SAM
- XOR Media
Notable Milestones in Video Servers Sector
- 2020: Introduction of AI-powered video processing capabilities by Harmonic.
- 2021: Cisco launched its next-generation cloud-based video server platform.
- 2022: Acquisition of a smaller video server company by EVS.
- 2023: Several companies announced support for 8K video in their server offerings.
In-Depth Video Servers Market Outlook
The future of the video server market looks promising, driven by the ongoing convergence of broadcasting and streaming technologies, the adoption of advanced video formats (8K, HDR), and the increasing demand for personalized and immersive video experiences. Strategic partnerships and investments in R&D will continue to shape the market, creating significant opportunities for both established players and new entrants. The market is poised for substantial growth throughout the forecast period, with particular potential in emerging markets and niche applications.
Video Servers Segmentation
-
1. Application
- 1.1. Internet Cafes
- 1.2. Enterprise
- 1.3. Other
-
2. Type
- 2.1. M-JPEG Technology
- 2.2. MPEG-4 Technology
- 2.3. H.264 Technology
Video Servers Segmentation By Geography
-
1. North America
- 1.1. United States
- 1.2. Canada
- 1.3. Mexico
-
2. South America
- 2.1. Brazil
- 2.2. Argentina
- 2.3. Rest of South America
-
3. Europe
- 3.1. United Kingdom
- 3.2. Germany
- 3.3. France
- 3.4. Italy
- 3.5. Spain
- 3.6. Russia
- 3.7. Benelux
- 3.8. Nordics
- 3.9. Rest of Europe
-
4. Middle East & Africa
- 4.1. Turkey
- 4.2. Israel
- 4.3. GCC
- 4.4. North Africa
- 4.5. South Africa
- 4.6. Rest of Middle East & Africa
-
5. Asia Pacific
- 5.1. China
- 5.2. India
- 5.3. Japan
- 5.4. South Korea
- 5.5. ASEAN
- 5.6. Oceania
- 5.7. Rest of Asia Pacific
Video Servers REPORT HIGHLIGHTS
| Aspects | Details |
|---|---|
| Study Period | 2019-2033 |
| Base Year | 2024 |
| Estimated Year | 2025 |
| Forecast Period | 2025-2033 |
| Historical Period | 2019-2024 |
| Growth Rate | CAGR of XXX% from 2019-2033 |
| Segmentation |
|
Table of Contents
- 1. Introduction
- 1.1. Research Scope
- 1.2. Market Segmentation
- 1.3. Research Methodology
- 1.4. Definitions and Assumptions
- 2. Executive Summary
- 2.1. Introduction
- 3. Market Dynamics
- 3.1. Introduction
- 3.2. Market Drivers
- 3.3. Market Restrains
- 3.4. Market Trends
- 4. Market Factor Analysis
- 4.1. Porters Five Forces
- 4.2. Supply/Value Chain
- 4.3. PESTEL analysis
- 4.4. Market Entropy
- 4.5. Patent/Trademark Analysis
- 5. Global Video Servers Analysis, Insights and Forecast, 2019-2031
- 5.1. Market Analysis, Insights and Forecast - by Application
- 5.1.1. Internet Cafes
- 5.1.2. Enterprise
- 5.1.3. Other
- 5.2. Market Analysis, Insights and Forecast - by Type
- 5.2.1. M-JPEG Technology
- 5.2.2. MPEG-4 Technology
- 5.2.3. H.264 Technology
- 5.3. Market Analysis, Insights and Forecast - by Region
- 5.3.1. North America
- 5.3.2. South America
- 5.3.3. Europe
- 5.3.4. Middle East & Africa
- 5.3.5. Asia Pacific
- 5.1. Market Analysis, Insights and Forecast - by Application
- 6. North America Video Servers Analysis, Insights and Forecast, 2019-2031
- 6.1. Market Analysis, Insights and Forecast - by Application
- 6.1.1. Internet Cafes
- 6.1.2. Enterprise
- 6.1.3. Other
- 6.2. Market Analysis, Insights and Forecast - by Type
- 6.2.1. M-JPEG Technology
- 6.2.2. MPEG-4 Technology
- 6.2.3. H.264 Technology
- 6.1. Market Analysis, Insights and Forecast - by Application
- 7. South America Video Servers Analysis, Insights and Forecast, 2019-2031
- 7.1. Market Analysis, Insights and Forecast - by Application
- 7.1.1. Internet Cafes
- 7.1.2. Enterprise
- 7.1.3. Other
- 7.2. Market Analysis, Insights and Forecast - by Type
- 7.2.1. M-JPEG Technology
- 7.2.2. MPEG-4 Technology
- 7.2.3. H.264 Technology
- 7.1. Market Analysis, Insights and Forecast - by Application
- 8. Europe Video Servers Analysis, Insights and Forecast, 2019-2031
- 8.1. Market Analysis, Insights and Forecast - by Application
- 8.1.1. Internet Cafes
- 8.1.2. Enterprise
- 8.1.3. Other
- 8.2. Market Analysis, Insights and Forecast - by Type
- 8.2.1. M-JPEG Technology
- 8.2.2. MPEG-4 Technology
- 8.2.3. H.264 Technology
- 8.1. Market Analysis, Insights and Forecast - by Application
- 9. Middle East & Africa Video Servers Analysis, Insights and Forecast, 2019-2031
- 9.1. Market Analysis, Insights and Forecast - by Application
- 9.1.1. Internet Cafes
- 9.1.2. Enterprise
- 9.1.3. Other
- 9.2. Market Analysis, Insights and Forecast - by Type
- 9.2.1. M-JPEG Technology
- 9.2.2. MPEG-4 Technology
- 9.2.3. H.264 Technology
- 9.1. Market Analysis, Insights and Forecast - by Application
- 10. Asia Pacific Video Servers Analysis, Insights and Forecast, 2019-2031
- 10.1. Market Analysis, Insights and Forecast - by Application
- 10.1.1. Internet Cafes
- 10.1.2. Enterprise
- 10.1.3. Other
- 10.2. Market Analysis, Insights and Forecast - by Type
- 10.2.1. M-JPEG Technology
- 10.2.2. MPEG-4 Technology
- 10.2.3. H.264 Technology
- 10.1. Market Analysis, Insights and Forecast - by Application
- 11. Competitive Analysis
- 11.1. Global Market Share Analysis 2024
- 11.2. Company Profiles
- 11.2.1 Anevia
- 11.2.1.1. Overview
- 11.2.1.2. Products
- 11.2.1.3. SWOT Analysis
- 11.2.1.4. Recent Developments
- 11.2.1.5. Financials (Based on Availability)
- 11.2.2 Arris
- 11.2.2.1. Overview
- 11.2.2.2. Products
- 11.2.2.3. SWOT Analysis
- 11.2.2.4. Recent Developments
- 11.2.2.5. Financials (Based on Availability)
- 11.2.3 Avid
- 11.2.3.1. Overview
- 11.2.3.2. Products
- 11.2.3.3. SWOT Analysis
- 11.2.3.4. Recent Developments
- 11.2.3.5. Financials (Based on Availability)
- 11.2.4 Belden Grass Valley
- 11.2.4.1. Overview
- 11.2.4.2. Products
- 11.2.4.3. SWOT Analysis
- 11.2.4.4. Recent Developments
- 11.2.4.5. Financials (Based on Availability)
- 11.2.5 Cisco
- 11.2.5.1. Overview
- 11.2.5.2. Products
- 11.2.5.3. SWOT Analysis
- 11.2.5.4. Recent Developments
- 11.2.5.5. Financials (Based on Availability)
- 11.2.6 Concurrent
- 11.2.6.1. Overview
- 11.2.6.2. Products
- 11.2.6.3. SWOT Analysis
- 11.2.6.4. Recent Developments
- 11.2.6.5. Financials (Based on Availability)
- 11.2.7 EVS
- 11.2.7.1. Overview
- 11.2.7.2. Products
- 11.2.7.3. SWOT Analysis
- 11.2.7.4. Recent Developments
- 11.2.7.5. Financials (Based on Availability)
- 11.2.8 Edgeware
- 11.2.8.1. Overview
- 11.2.8.2. Products
- 11.2.8.3. SWOT Analysis
- 11.2.8.4. Recent Developments
- 11.2.8.5. Financials (Based on Availability)
- 11.2.9 Espial
- 11.2.9.1. Overview
- 11.2.9.2. Products
- 11.2.9.3. SWOT Analysis
- 11.2.9.4. Recent Developments
- 11.2.9.5. Financials (Based on Availability)
- 11.2.10 Harmonic
- 11.2.10.1. Overview
- 11.2.10.2. Products
- 11.2.10.3. SWOT Analysis
- 11.2.10.4. Recent Developments
- 11.2.10.5. Financials (Based on Availability)
- 11.2.11 Imagine
- 11.2.11.1. Overview
- 11.2.11.2. Products
- 11.2.11.3. SWOT Analysis
- 11.2.11.4. Recent Developments
- 11.2.11.5. Financials (Based on Availability)
- 11.2.12 Ross Video
- 11.2.12.1. Overview
- 11.2.12.2. Products
- 11.2.12.3. SWOT Analysis
- 11.2.12.4. Recent Developments
- 11.2.12.5. Financials (Based on Availability)
- 11.2.13 SAM
- 11.2.13.1. Overview
- 11.2.13.2. Products
- 11.2.13.3. SWOT Analysis
- 11.2.13.4. Recent Developments
- 11.2.13.5. Financials (Based on Availability)
- 11.2.14 XOR Media
- 11.2.14.1. Overview
- 11.2.14.2. Products
- 11.2.14.3. SWOT Analysis
- 11.2.14.4. Recent Developments
- 11.2.14.5. Financials (Based on Availability)
- 11.2.1 Anevia
List of Figures
- Figure 1: Global Video Servers Revenue Breakdown (million, %) by Region 2024 & 2032
- Figure 2: North America Video Servers Revenue (million), by Application 2024 & 2032
- Figure 3: North America Video Servers Revenue Share (%), by Application 2024 & 2032
- Figure 4: North America Video Servers Revenue (million), by Type 2024 & 2032
- Figure 5: North America Video Servers Revenue Share (%), by Type 2024 & 2032
- Figure 6: North America Video Servers Revenue (million), by Country 2024 & 2032
- Figure 7: North America Video Servers Revenue Share (%), by Country 2024 & 2032
- Figure 8: South America Video Servers Revenue (million), by Application 2024 & 2032
- Figure 9: South America Video Servers Revenue Share (%), by Application 2024 & 2032
- Figure 10: South America Video Servers Revenue (million), by Type 2024 & 2032
- Figure 11: South America Video Servers Revenue Share (%), by Type 2024 & 2032
- Figure 12: South America Video Servers Revenue (million), by Country 2024 & 2032
- Figure 13: South America Video Servers Revenue Share (%), by Country 2024 & 2032
- Figure 14: Europe Video Servers Revenue (million), by Application 2024 & 2032
- Figure 15: Europe Video Servers Revenue Share (%), by Application 2024 & 2032
- Figure 16: Europe Video Servers Revenue (million), by Type 2024 & 2032
- Figure 17: Europe Video Servers Revenue Share (%), by Type 2024 & 2032
- Figure 18: Europe Video Servers Revenue (million), by Country 2024 & 2032
- Figure 19: Europe Video Servers Revenue Share (%), by Country 2024 & 2032
- Figure 20: Middle East & Africa Video Servers Revenue (million), by Application 2024 & 2032
- Figure 21: Middle East & Africa Video Servers Revenue Share (%), by Application 2024 & 2032
- Figure 22: Middle East & Africa Video Servers Revenue (million), by Type 2024 & 2032
- Figure 23: Middle East & Africa Video Servers Revenue Share (%), by Type 2024 & 2032
- Figure 24: Middle East & Africa Video Servers Revenue (million), by Country 2024 & 2032
- Figure 25: Middle East & Africa Video Servers Revenue Share (%), by Country 2024 & 2032
- Figure 26: Asia Pacific Video Servers Revenue (million), by Application 2024 & 2032
- Figure 27: Asia Pacific Video Servers Revenue Share (%), by Application 2024 & 2032
- Figure 28: Asia Pacific Video Servers Revenue (million), by Type 2024 & 2032
- Figure 29: Asia Pacific Video Servers Revenue Share (%), by Type 2024 & 2032
- Figure 30: Asia Pacific Video Servers Revenue (million), by Country 2024 & 2032
- Figure 31: Asia Pacific Video Servers Revenue Share (%), by Country 2024 & 2032
List of Tables
- Table 1: Global Video Servers Revenue million Forecast, by Region 2019 & 2032
- Table 2: Global Video Servers Revenue million Forecast, by Application 2019 & 2032
- Table 3: Global Video Servers Revenue million Forecast, by Type 2019 & 2032
- Table 4: Global Video Servers Revenue million Forecast, by Region 2019 & 2032
- Table 5: Global Video Servers Revenue million Forecast, by Application 2019 & 2032
- Table 6: Global Video Servers Revenue million Forecast, by Type 2019 & 2032
- Table 7: Global Video Servers Revenue million Forecast, by Country 2019 & 2032
- Table 8: United States Video Servers Revenue (million) Forecast, by Application 2019 & 2032
- Table 9: Canada Video Servers Revenue (million) Forecast, by Application 2019 & 2032
- Table 10: Mexico Video Servers Revenue (million) Forecast, by Application 2019 & 2032
- Table 11: Global Video Servers Revenue million Forecast, by Application 2019 & 2032
- Table 12: Global Video Servers Revenue million Forecast, by Type 2019 & 2032
- Table 13: Global Video Servers Revenue million Forecast, by Country 2019 & 2032
- Table 14: Brazil Video Servers Revenue (million) Forecast, by Application 2019 & 2032
- Table 15: Argentina Video Servers Revenue (million) Forecast, by Application 2019 & 2032
- Table 16: Rest of South America Video Servers Revenue (million) Forecast, by Application 2019 & 2032
- Table 17: Global Video Servers Revenue million Forecast, by Application 2019 & 2032
- Table 18: Global Video Servers Revenue million Forecast, by Type 2019 & 2032
- Table 19: Global Video Servers Revenue million Forecast, by Country 2019 & 2032
- Table 20: United Kingdom Video Servers Revenue (million) Forecast, by Application 2019 & 2032
- Table 21: Germany Video Servers Revenue (million) Forecast, by Application 2019 & 2032
- Table 22: France Video Servers Revenue (million) Forecast, by Application 2019 & 2032
- Table 23: Italy Video Servers Revenue (million) Forecast, by Application 2019 & 2032
- Table 24: Spain Video Servers Revenue (million) Forecast, by Application 2019 & 2032
- Table 25: Russia Video Servers Revenue (million) Forecast, by Application 2019 & 2032
- Table 26: Benelux Video Servers Revenue (million) Forecast, by Application 2019 & 2032
- Table 27: Nordics Video Servers Revenue (million) Forecast, by Application 2019 & 2032
- Table 28: Rest of Europe Video Servers Revenue (million) Forecast, by Application 2019 & 2032
- Table 29: Global Video Servers Revenue million Forecast, by Application 2019 & 2032
- Table 30: Global Video Servers Revenue million Forecast, by Type 2019 & 2032
- Table 31: Global Video Servers Revenue million Forecast, by Country 2019 & 2032
- Table 32: Turkey Video Servers Revenue (million) Forecast, by Application 2019 & 2032
- Table 33: Israel Video Servers Revenue (million) Forecast, by Application 2019 & 2032
- Table 34: GCC Video Servers Revenue (million) Forecast, by Application 2019 & 2032
- Table 35: North Africa Video Servers Revenue (million) Forecast, by Application 2019 & 2032
- Table 36: South Africa Video Servers Revenue (million) Forecast, by Application 2019 & 2032
- Table 37: Rest of Middle East & Africa Video Servers Revenue (million) Forecast, by Application 2019 & 2032
- Table 38: Global Video Servers Revenue million Forecast, by Application 2019 & 2032
- Table 39: Global Video Servers Revenue million Forecast, by Type 2019 & 2032
- Table 40: Global Video Servers Revenue million Forecast, by Country 2019 & 2032
- Table 41: China Video Servers Revenue (million) Forecast, by Application 2019 & 2032
- Table 42: India Video Servers Revenue (million) Forecast, by Application 2019 & 2032
- Table 43: Japan Video Servers Revenue (million) Forecast, by Application 2019 & 2032
- Table 44: South Korea Video Servers Revenue (million) Forecast, by Application 2019 & 2032
- Table 45: ASEAN Video Servers Revenue (million) Forecast, by Application 2019 & 2032
- Table 46: Oceania Video Servers Revenue (million) Forecast, by Application 2019 & 2032
- Table 47: Rest of Asia Pacific Video Servers Revenue (million) Forecast, by Application 2019 & 2032
Frequently Asked Questions
1. What is the projected Compound Annual Growth Rate (CAGR) of the Video Servers?
The projected CAGR is approximately XXX%.
2. Which companies are prominent players in the Video Servers?
Key companies in the market include Anevia, Arris, Avid, Belden Grass Valley, Cisco, Concurrent, EVS, Edgeware, Espial, Harmonic, Imagine, Ross Video, SAM, XOR Media.
3. What are the main segments of the Video Servers?
The market segments include Application, Type.
4. Can you provide details about the market size?
The market size is estimated to be USD XXX million as of 2022.
5. What are some drivers contributing to market growth?
N/A
6. What are the notable trends driving market growth?
N/A
7. Are there any restraints impacting market growth?
N/A
8. Can you provide examples of recent developments in the market?
N/A
9. What pricing options are available for accessing the report?
Pricing options include single-user, multi-user, and enterprise licenses priced at USD 2900.00, USD 4350.00, and USD 5800.00 respectively.
10. Is the market size provided in terms of value or volume?
The market size is provided in terms of value, measured in million.
11. Are there any specific market keywords associated with the report?
Yes, the market keyword associated with the report is "Video Servers," which aids in identifying and referencing the specific market segment covered.
12. How do I determine which pricing option suits my needs best?
The pricing options vary based on user requirements and access needs. Individual users may opt for single-user licenses, while businesses requiring broader access may choose multi-user or enterprise licenses for cost-effective access to the report.
13. Are there any additional resources or data provided in the Video Servers report?
While the report offers comprehensive insights, it's advisable to review the specific contents or supplementary materials provided to ascertain if additional resources or data are available.
14. How can I stay updated on further developments or reports in the Video Servers?
To stay informed about further developments, trends, and reports in the Video Servers, consider subscribing to industry newsletters, following relevant companies and organizations, or regularly checking reputable industry news sources and publications.
Methodology
Step 1 - Identification of Relevant Samples Size from Population Database


Step 2 - Approaches for Defining Global Market Size (Value, Volume* & Price*)

Note*: In applicable scenarios
Step 3 - Data Sources
Primary Research
- Web Analytics
- Survey Reports
- Research Institute
- Latest Research Reports
- Opinion Leaders
Secondary Research
- Annual Reports
- White Paper
- Latest Press Release
- Industry Association
- Paid Database
- Investor Presentations

Step 4 - Data Triangulation
Involves using different sources of information in order to increase the validity of a study
These sources are likely to be stakeholders in a program - participants, other researchers, program staff, other community members, and so on.
Then we put all data in single framework & apply various statistical tools to find out the dynamic on the market.
During the analysis stage, feedback from the stakeholder groups would be compared to determine areas of agreement as well as areas of divergence
