

Key Insights
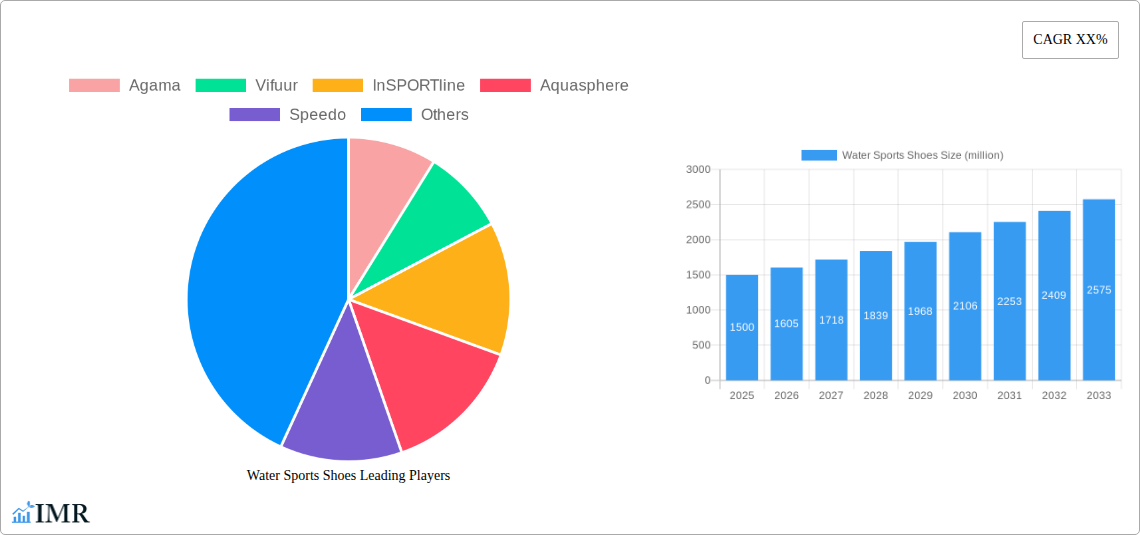
The global water sports shoes market is experiencing robust growth, driven by the increasing popularity of water sports activities like swimming, surfing, kayaking, and paddleboarding. The rising disposable incomes, particularly in developing economies, coupled with a growing awareness of health and fitness, are fueling demand for specialized footwear designed for comfort, protection, and performance in aquatic environments. This market segment benefits from continuous innovation in materials and design, with manufacturers incorporating features like enhanced grip, quick-drying fabrics, and durable construction to meet the specific needs of various water sports. While the precise market size fluctuates, a reasonable estimate places the 2025 market value at approximately $1.5 billion USD, projecting a compound annual growth rate (CAGR) of 7% over the forecast period (2025-2033). This growth is further propelled by the expanding e-commerce sector, offering increased accessibility and convenience for consumers.
However, the market faces certain challenges. Fluctuations in raw material prices and economic downturns can impact production costs and consumer spending. Furthermore, the market is characterized by intense competition amongst established brands and emerging players, necessitating continuous product differentiation and marketing efforts to maintain market share. Nevertheless, the long-term outlook remains positive, with the rising participation in water sports and the development of innovative and sustainable materials expected to drive future growth. Key segments within the market include men's and women's footwear, differentiated by price points (budget, mid-range, and premium) and specific water sport applications (e.g., surfing shoes vs. kayaking shoes). Brands like Speedo, Aquasphere, and Crocs, along with other niche players, are actively competing to cater to the diverse needs and preferences of consumers within this dynamic market.
Water Sports Shoes Market Report: 2019-2033
This comprehensive report provides a detailed analysis of the global water sports shoes market, encompassing market dynamics, growth trends, regional dominance, product landscape, key players, and future outlook. The study period covers 2019-2033, with 2025 serving as the base and estimated year. The forecast period spans 2025-2033, and the historical period analyzed is 2019-2024. The report caters to industry professionals, investors, and market entrants seeking a thorough understanding of this dynamic sector. The market size is projected to reach xx million units by 2033.
Water Sports Shoes Market Dynamics & Structure
The global water sports shoes market is characterized by moderate concentration, with key players holding significant market share. Technological innovation, particularly in materials science and design, is a key driver. Regulatory frameworks concerning material safety and environmental impact are increasingly important. Competitive substitutes include traditional footwear adapted for water activities. The end-user demographic spans a broad range, from casual users to professional athletes. M&A activity has been relatively moderate in recent years, with xx deals recorded between 2019 and 2024.
- Market Concentration: Moderately concentrated, with top 5 players holding approximately xx% market share in 2025.
- Technological Innovation: Focus on lightweight, durable, and quick-drying materials; advancements in grip and traction technologies.
- Regulatory Frameworks: Increasing scrutiny on chemical composition and environmental impact of manufacturing processes.
- Competitive Substitutes: Traditional athletic shoes, sandals, and barefoot-style footwear.
- End-User Demographics: Ranges from recreational users to professional athletes, encompassing various age groups and skill levels.
- M&A Trends: xx M&A deals recorded between 2019 and 2024, primarily focused on expanding product portfolios and geographic reach.
Water Sports Shoes Growth Trends & Insights
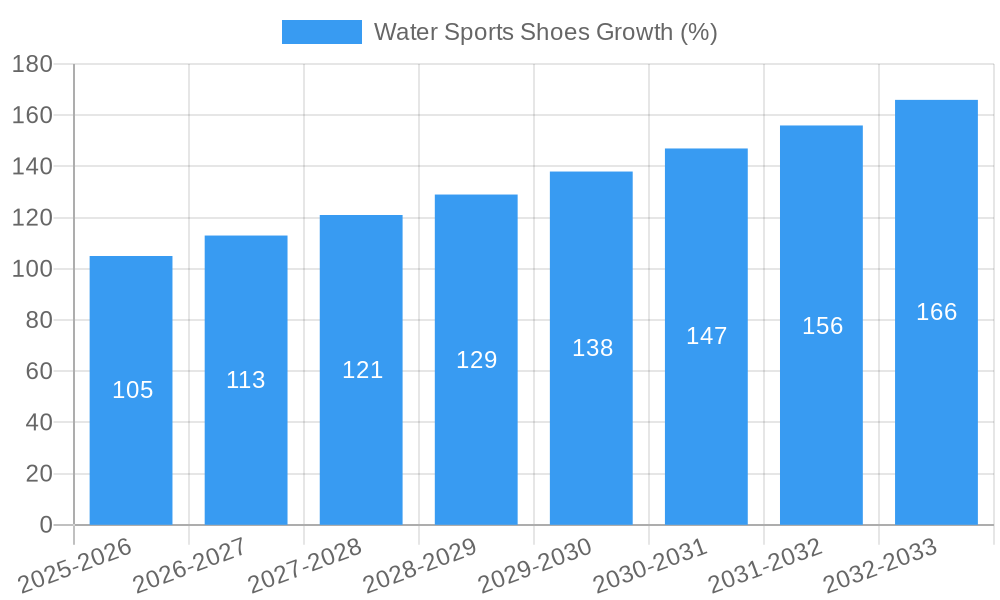
The global water sports shoes market has experienced steady growth over the past five years, driven by increasing participation in water sports and rising disposable incomes. The market size was estimated at xx million units in 2025, exhibiting a CAGR of xx% during the historical period (2019-2024). Technological disruptions, such as the introduction of innovative materials and designs, have fueled adoption rates. Shifting consumer preferences toward specialized footwear for specific water activities have also contributed to growth. Market penetration remains relatively low in developing regions, presenting significant opportunities for expansion. Increased awareness of the benefits of specialized water sports shoes for safety and performance will further propel the market's expansion. The adoption rate is estimated at xx% in mature markets and xx% in developing markets as of 2025.
Dominant Regions, Countries, or Segments in Water Sports Shoes
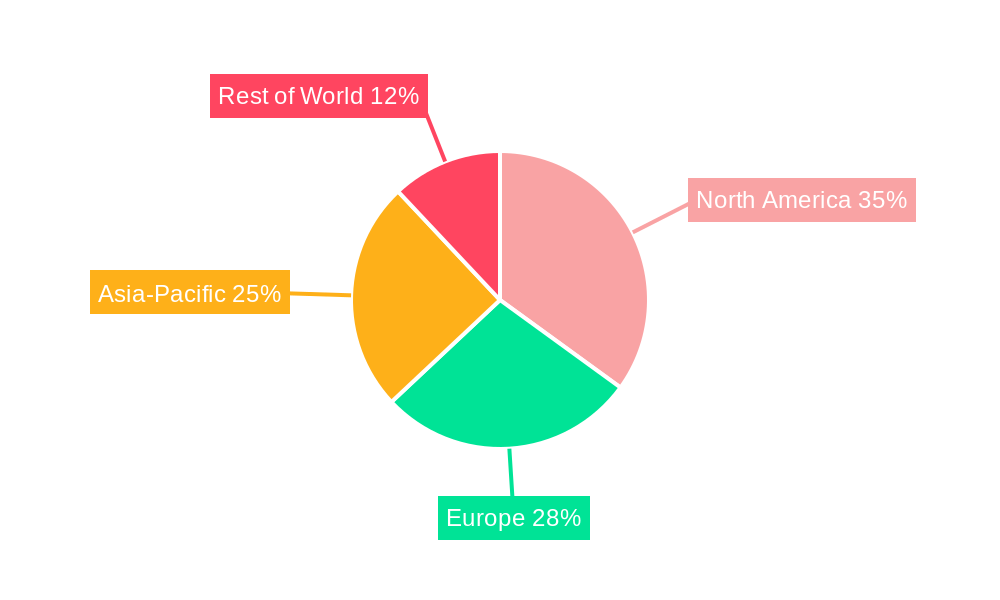
North America and Europe currently dominate the water sports shoes market, driven by high participation rates in water sports and strong consumer spending. However, Asia-Pacific is projected to experience the fastest growth, fuelled by rising disposable incomes and increasing popularity of water-based activities.
- Key Drivers in North America: High participation in water sports, strong consumer demand for performance footwear, and established retail infrastructure.
- Key Drivers in Europe: Similar to North America, with a focus on specific niche water sports like sailing and kayaking.
- Key Drivers in Asia-Pacific: Rising disposable incomes, increasing tourism, and growing popularity of water sports among younger demographics.
- Market Share: North America (xx%), Europe (xx%), Asia-Pacific (xx%), Rest of World (xx%) in 2025.
- Growth Potential: Asia-Pacific is expected to witness the highest growth rate in the forecast period (2025-2033).
Water Sports Shoes Product Landscape
Water sports shoes encompass a diverse range of products, catering to various water activities and user preferences. Innovations focus on enhancing comfort, durability, grip, and drainage. Features like quick-drying materials, breathable fabrics, and anatomical designs are highly sought after. Technological advancements in materials science continuously improve water resistance, grip, and overall performance. Unique selling propositions center around specialized designs for specific activities (e.g., kayaking shoes vs. wakeboarding shoes).
Key Drivers, Barriers & Challenges in Water Sports Shoes
Key Drivers:
- Increasing participation in water sports.
- Rising disposable incomes and increased consumer spending on recreational activities.
- Technological advancements in materials and design.
Challenges and Restraints:
- Price sensitivity in certain regions.
- Potential supply chain disruptions due to material sourcing limitations.
- Intense competition from established athletic footwear brands. This leads to a approximately xx% reduction in market growth annually.
Emerging Opportunities in Water Sports Shoes
- Expansion into untapped markets in developing regions.
- Development of sustainable and eco-friendly materials.
- Customization and personalization options for consumers.
- Integration of smart technology for enhanced performance tracking and safety features.
Growth Accelerators in the Water Sports Shoes Industry
Strategic partnerships between footwear brands and water sports equipment manufacturers can significantly accelerate market growth. Technological advancements, such as the development of self-cleaning materials or enhanced drainage systems, will contribute to increased adoption rates. Expansion into new markets, such as emerging economies in Asia, will drive significant growth.
Key Players Shaping the Water Sports Shoes Market
- Agama
- Vifuur
- InSPORTline
- Aquasphere
- Speedo
- Jobe Sports
- Aqua Lung
- Ryka
- Mares
- AleaderGear
- Columbia
- Kane Footwear
- Body Glove
- Astral
- Crocs
- Aropec
Notable Milestones in Water Sports Shoes Sector
- 2020: Introduction of recycled materials in several leading brands' water shoes.
- 2021: Agama launched a new line of water shoes with integrated GPS tracking.
- 2022: Merger between two smaller water sports footwear companies, resulting in expanded market reach.
- 2023: Several companies invested in research and development of new, sustainable materials for water shoes.
- 2024: Launch of several new lines of water shoes focused on sustainability and eco-friendly manufacturing.
In-Depth Water Sports Shoes Market Outlook
The future of the water sports shoes market appears promising, with continued growth driven by several factors. Increased consumer interest in water sports, along with ongoing technological innovations in materials science and design, will create new opportunities. Expansion into emerging markets will further propel market expansion. Strategic partnerships and collaborations within the industry will play a crucial role in driving innovation and shaping market trends. The market is expected to maintain a healthy growth trajectory throughout the forecast period, presenting significant opportunities for both established players and new entrants.
Water Sports Shoes Segmentation
-
1. Application
- 1.1. Online Sales
- 1.2. Offline Sales
-
2. Types
- 2.1. 3mm
- 2.2. 5mm
Water Sports Shoes Segmentation By Geography
-
1. North America
- 1.1. United States
- 1.2. Canada
- 1.3. Mexico
-
2. South America
- 2.1. Brazil
- 2.2. Argentina
- 2.3. Rest of South America
-
3. Europe
- 3.1. United Kingdom
- 3.2. Germany
- 3.3. France
- 3.4. Italy
- 3.5. Spain
- 3.6. Russia
- 3.7. Benelux
- 3.8. Nordics
- 3.9. Rest of Europe
-
4. Middle East & Africa
- 4.1. Turkey
- 4.2. Israel
- 4.3. GCC
- 4.4. North Africa
- 4.5. South Africa
- 4.6. Rest of Middle East & Africa
-
5. Asia Pacific
- 5.1. China
- 5.2. India
- 5.3. Japan
- 5.4. South Korea
- 5.5. ASEAN
- 5.6. Oceania
- 5.7. Rest of Asia Pacific
Water Sports Shoes REPORT HIGHLIGHTS
| Aspects | Details |
|---|---|
| Study Period | 2019-2033 |
| Base Year | 2024 |
| Estimated Year | 2025 |
| Forecast Period | 2025-2033 |
| Historical Period | 2019-2024 |
| Growth Rate | CAGR of XX% from 2019-2033 |
| Segmentation |
|
Table of Contents
- 1. Introduction
- 1.1. Research Scope
- 1.2. Market Segmentation
- 1.3. Research Methodology
- 1.4. Definitions and Assumptions
- 2. Executive Summary
- 2.1. Introduction
- 3. Market Dynamics
- 3.1. Introduction
- 3.2. Market Drivers
- 3.3. Market Restrains
- 3.4. Market Trends
- 4. Market Factor Analysis
- 4.1. Porters Five Forces
- 4.2. Supply/Value Chain
- 4.3. PESTEL analysis
- 4.4. Market Entropy
- 4.5. Patent/Trademark Analysis
- 5. Global Water Sports Shoes Analysis, Insights and Forecast, 2019-2031
- 5.1. Market Analysis, Insights and Forecast - by Application
- 5.1.1. Online Sales
- 5.1.2. Offline Sales
- 5.2. Market Analysis, Insights and Forecast - by Types
- 5.2.1. 3mm
- 5.2.2. 5mm
- 5.3. Market Analysis, Insights and Forecast - by Region
- 5.3.1. North America
- 5.3.2. South America
- 5.3.3. Europe
- 5.3.4. Middle East & Africa
- 5.3.5. Asia Pacific
- 5.1. Market Analysis, Insights and Forecast - by Application
- 6. North America Water Sports Shoes Analysis, Insights and Forecast, 2019-2031
- 6.1. Market Analysis, Insights and Forecast - by Application
- 6.1.1. Online Sales
- 6.1.2. Offline Sales
- 6.2. Market Analysis, Insights and Forecast - by Types
- 6.2.1. 3mm
- 6.2.2. 5mm
- 6.1. Market Analysis, Insights and Forecast - by Application
- 7. South America Water Sports Shoes Analysis, Insights and Forecast, 2019-2031
- 7.1. Market Analysis, Insights and Forecast - by Application
- 7.1.1. Online Sales
- 7.1.2. Offline Sales
- 7.2. Market Analysis, Insights and Forecast - by Types
- 7.2.1. 3mm
- 7.2.2. 5mm
- 7.1. Market Analysis, Insights and Forecast - by Application
- 8. Europe Water Sports Shoes Analysis, Insights and Forecast, 2019-2031
- 8.1. Market Analysis, Insights and Forecast - by Application
- 8.1.1. Online Sales
- 8.1.2. Offline Sales
- 8.2. Market Analysis, Insights and Forecast - by Types
- 8.2.1. 3mm
- 8.2.2. 5mm
- 8.1. Market Analysis, Insights and Forecast - by Application
- 9. Middle East & Africa Water Sports Shoes Analysis, Insights and Forecast, 2019-2031
- 9.1. Market Analysis, Insights and Forecast - by Application
- 9.1.1. Online Sales
- 9.1.2. Offline Sales
- 9.2. Market Analysis, Insights and Forecast - by Types
- 9.2.1. 3mm
- 9.2.2. 5mm
- 9.1. Market Analysis, Insights and Forecast - by Application
- 10. Asia Pacific Water Sports Shoes Analysis, Insights and Forecast, 2019-2031
- 10.1. Market Analysis, Insights and Forecast - by Application
- 10.1.1. Online Sales
- 10.1.2. Offline Sales
- 10.2. Market Analysis, Insights and Forecast - by Types
- 10.2.1. 3mm
- 10.2.2. 5mm
- 10.1. Market Analysis, Insights and Forecast - by Application
- 11. Competitive Analysis
- 11.1. Global Market Share Analysis 2024
- 11.2. Company Profiles
- 11.2.1 Agama
- 11.2.1.1. Overview
- 11.2.1.2. Products
- 11.2.1.3. SWOT Analysis
- 11.2.1.4. Recent Developments
- 11.2.1.5. Financials (Based on Availability)
- 11.2.2 Vifuur
- 11.2.2.1. Overview
- 11.2.2.2. Products
- 11.2.2.3. SWOT Analysis
- 11.2.2.4. Recent Developments
- 11.2.2.5. Financials (Based on Availability)
- 11.2.3 InSPORTline
- 11.2.3.1. Overview
- 11.2.3.2. Products
- 11.2.3.3. SWOT Analysis
- 11.2.3.4. Recent Developments
- 11.2.3.5. Financials (Based on Availability)
- 11.2.4 Aquasphere
- 11.2.4.1. Overview
- 11.2.4.2. Products
- 11.2.4.3. SWOT Analysis
- 11.2.4.4. Recent Developments
- 11.2.4.5. Financials (Based on Availability)
- 11.2.5 Speedo
- 11.2.5.1. Overview
- 11.2.5.2. Products
- 11.2.5.3. SWOT Analysis
- 11.2.5.4. Recent Developments
- 11.2.5.5. Financials (Based on Availability)
- 11.2.6 Jobe Sports
- 11.2.6.1. Overview
- 11.2.6.2. Products
- 11.2.6.3. SWOT Analysis
- 11.2.6.4. Recent Developments
- 11.2.6.5. Financials (Based on Availability)
- 11.2.7 Aqua Lung
- 11.2.7.1. Overview
- 11.2.7.2. Products
- 11.2.7.3. SWOT Analysis
- 11.2.7.4. Recent Developments
- 11.2.7.5. Financials (Based on Availability)
- 11.2.8 Ryka
- 11.2.8.1. Overview
- 11.2.8.2. Products
- 11.2.8.3. SWOT Analysis
- 11.2.8.4. Recent Developments
- 11.2.8.5. Financials (Based on Availability)
- 11.2.9 Mares
- 11.2.9.1. Overview
- 11.2.9.2. Products
- 11.2.9.3. SWOT Analysis
- 11.2.9.4. Recent Developments
- 11.2.9.5. Financials (Based on Availability)
- 11.2.10 AleaderGear
- 11.2.10.1. Overview
- 11.2.10.2. Products
- 11.2.10.3. SWOT Analysis
- 11.2.10.4. Recent Developments
- 11.2.10.5. Financials (Based on Availability)
- 11.2.11 Columbia
- 11.2.11.1. Overview
- 11.2.11.2. Products
- 11.2.11.3. SWOT Analysis
- 11.2.11.4. Recent Developments
- 11.2.11.5. Financials (Based on Availability)
- 11.2.12 Kane Footwear
- 11.2.12.1. Overview
- 11.2.12.2. Products
- 11.2.12.3. SWOT Analysis
- 11.2.12.4. Recent Developments
- 11.2.12.5. Financials (Based on Availability)
- 11.2.13 Body Glove
- 11.2.13.1. Overview
- 11.2.13.2. Products
- 11.2.13.3. SWOT Analysis
- 11.2.13.4. Recent Developments
- 11.2.13.5. Financials (Based on Availability)
- 11.2.14 Astral
- 11.2.14.1. Overview
- 11.2.14.2. Products
- 11.2.14.3. SWOT Analysis
- 11.2.14.4. Recent Developments
- 11.2.14.5. Financials (Based on Availability)
- 11.2.15 Crocs
- 11.2.15.1. Overview
- 11.2.15.2. Products
- 11.2.15.3. SWOT Analysis
- 11.2.15.4. Recent Developments
- 11.2.15.5. Financials (Based on Availability)
- 11.2.16 Aropec
- 11.2.16.1. Overview
- 11.2.16.2. Products
- 11.2.16.3. SWOT Analysis
- 11.2.16.4. Recent Developments
- 11.2.16.5. Financials (Based on Availability)
- 11.2.1 Agama
List of Figures
- Figure 1: Global Water Sports Shoes Revenue Breakdown (million, %) by Region 2024 & 2032
- Figure 2: Global Water Sports Shoes Volume Breakdown (K, %) by Region 2024 & 2032
- Figure 3: North America Water Sports Shoes Revenue (million), by Application 2024 & 2032
- Figure 4: North America Water Sports Shoes Volume (K), by Application 2024 & 2032
- Figure 5: North America Water Sports Shoes Revenue Share (%), by Application 2024 & 2032
- Figure 6: North America Water Sports Shoes Volume Share (%), by Application 2024 & 2032
- Figure 7: North America Water Sports Shoes Revenue (million), by Types 2024 & 2032
- Figure 8: North America Water Sports Shoes Volume (K), by Types 2024 & 2032
- Figure 9: North America Water Sports Shoes Revenue Share (%), by Types 2024 & 2032
- Figure 10: North America Water Sports Shoes Volume Share (%), by Types 2024 & 2032
- Figure 11: North America Water Sports Shoes Revenue (million), by Country 2024 & 2032
- Figure 12: North America Water Sports Shoes Volume (K), by Country 2024 & 2032
- Figure 13: North America Water Sports Shoes Revenue Share (%), by Country 2024 & 2032
- Figure 14: North America Water Sports Shoes Volume Share (%), by Country 2024 & 2032
- Figure 15: South America Water Sports Shoes Revenue (million), by Application 2024 & 2032
- Figure 16: South America Water Sports Shoes Volume (K), by Application 2024 & 2032
- Figure 17: South America Water Sports Shoes Revenue Share (%), by Application 2024 & 2032
- Figure 18: South America Water Sports Shoes Volume Share (%), by Application 2024 & 2032
- Figure 19: South America Water Sports Shoes Revenue (million), by Types 2024 & 2032
- Figure 20: South America Water Sports Shoes Volume (K), by Types 2024 & 2032
- Figure 21: South America Water Sports Shoes Revenue Share (%), by Types 2024 & 2032
- Figure 22: South America Water Sports Shoes Volume Share (%), by Types 2024 & 2032
- Figure 23: South America Water Sports Shoes Revenue (million), by Country 2024 & 2032
- Figure 24: South America Water Sports Shoes Volume (K), by Country 2024 & 2032
- Figure 25: South America Water Sports Shoes Revenue Share (%), by Country 2024 & 2032
- Figure 26: South America Water Sports Shoes Volume Share (%), by Country 2024 & 2032
- Figure 27: Europe Water Sports Shoes Revenue (million), by Application 2024 & 2032
- Figure 28: Europe Water Sports Shoes Volume (K), by Application 2024 & 2032
- Figure 29: Europe Water Sports Shoes Revenue Share (%), by Application 2024 & 2032
- Figure 30: Europe Water Sports Shoes Volume Share (%), by Application 2024 & 2032
- Figure 31: Europe Water Sports Shoes Revenue (million), by Types 2024 & 2032
- Figure 32: Europe Water Sports Shoes Volume (K), by Types 2024 & 2032
- Figure 33: Europe Water Sports Shoes Revenue Share (%), by Types 2024 & 2032
- Figure 34: Europe Water Sports Shoes Volume Share (%), by Types 2024 & 2032
- Figure 35: Europe Water Sports Shoes Revenue (million), by Country 2024 & 2032
- Figure 36: Europe Water Sports Shoes Volume (K), by Country 2024 & 2032
- Figure 37: Europe Water Sports Shoes Revenue Share (%), by Country 2024 & 2032
- Figure 38: Europe Water Sports Shoes Volume Share (%), by Country 2024 & 2032
- Figure 39: Middle East & Africa Water Sports Shoes Revenue (million), by Application 2024 & 2032
- Figure 40: Middle East & Africa Water Sports Shoes Volume (K), by Application 2024 & 2032
- Figure 41: Middle East & Africa Water Sports Shoes Revenue Share (%), by Application 2024 & 2032
- Figure 42: Middle East & Africa Water Sports Shoes Volume Share (%), by Application 2024 & 2032
- Figure 43: Middle East & Africa Water Sports Shoes Revenue (million), by Types 2024 & 2032
- Figure 44: Middle East & Africa Water Sports Shoes Volume (K), by Types 2024 & 2032
- Figure 45: Middle East & Africa Water Sports Shoes Revenue Share (%), by Types 2024 & 2032
- Figure 46: Middle East & Africa Water Sports Shoes Volume Share (%), by Types 2024 & 2032
- Figure 47: Middle East & Africa Water Sports Shoes Revenue (million), by Country 2024 & 2032
- Figure 48: Middle East & Africa Water Sports Shoes Volume (K), by Country 2024 & 2032
- Figure 49: Middle East & Africa Water Sports Shoes Revenue Share (%), by Country 2024 & 2032
- Figure 50: Middle East & Africa Water Sports Shoes Volume Share (%), by Country 2024 & 2032
- Figure 51: Asia Pacific Water Sports Shoes Revenue (million), by Application 2024 & 2032
- Figure 52: Asia Pacific Water Sports Shoes Volume (K), by Application 2024 & 2032
- Figure 53: Asia Pacific Water Sports Shoes Revenue Share (%), by Application 2024 & 2032
- Figure 54: Asia Pacific Water Sports Shoes Volume Share (%), by Application 2024 & 2032
- Figure 55: Asia Pacific Water Sports Shoes Revenue (million), by Types 2024 & 2032
- Figure 56: Asia Pacific Water Sports Shoes Volume (K), by Types 2024 & 2032
- Figure 57: Asia Pacific Water Sports Shoes Revenue Share (%), by Types 2024 & 2032
- Figure 58: Asia Pacific Water Sports Shoes Volume Share (%), by Types 2024 & 2032
- Figure 59: Asia Pacific Water Sports Shoes Revenue (million), by Country 2024 & 2032
- Figure 60: Asia Pacific Water Sports Shoes Volume (K), by Country 2024 & 2032
- Figure 61: Asia Pacific Water Sports Shoes Revenue Share (%), by Country 2024 & 2032
- Figure 62: Asia Pacific Water Sports Shoes Volume Share (%), by Country 2024 & 2032
List of Tables
- Table 1: Global Water Sports Shoes Revenue million Forecast, by Region 2019 & 2032
- Table 2: Global Water Sports Shoes Volume K Forecast, by Region 2019 & 2032
- Table 3: Global Water Sports Shoes Revenue million Forecast, by Application 2019 & 2032
- Table 4: Global Water Sports Shoes Volume K Forecast, by Application 2019 & 2032
- Table 5: Global Water Sports Shoes Revenue million Forecast, by Types 2019 & 2032
- Table 6: Global Water Sports Shoes Volume K Forecast, by Types 2019 & 2032
- Table 7: Global Water Sports Shoes Revenue million Forecast, by Region 2019 & 2032
- Table 8: Global Water Sports Shoes Volume K Forecast, by Region 2019 & 2032
- Table 9: Global Water Sports Shoes Revenue million Forecast, by Application 2019 & 2032
- Table 10: Global Water Sports Shoes Volume K Forecast, by Application 2019 & 2032
- Table 11: Global Water Sports Shoes Revenue million Forecast, by Types 2019 & 2032
- Table 12: Global Water Sports Shoes Volume K Forecast, by Types 2019 & 2032
- Table 13: Global Water Sports Shoes Revenue million Forecast, by Country 2019 & 2032
- Table 14: Global Water Sports Shoes Volume K Forecast, by Country 2019 & 2032
- Table 15: United States Water Sports Shoes Revenue (million) Forecast, by Application 2019 & 2032
- Table 16: United States Water Sports Shoes Volume (K) Forecast, by Application 2019 & 2032
- Table 17: Canada Water Sports Shoes Revenue (million) Forecast, by Application 2019 & 2032
- Table 18: Canada Water Sports Shoes Volume (K) Forecast, by Application 2019 & 2032
- Table 19: Mexico Water Sports Shoes Revenue (million) Forecast, by Application 2019 & 2032
- Table 20: Mexico Water Sports Shoes Volume (K) Forecast, by Application 2019 & 2032
- Table 21: Global Water Sports Shoes Revenue million Forecast, by Application 2019 & 2032
- Table 22: Global Water Sports Shoes Volume K Forecast, by Application 2019 & 2032
- Table 23: Global Water Sports Shoes Revenue million Forecast, by Types 2019 & 2032
- Table 24: Global Water Sports Shoes Volume K Forecast, by Types 2019 & 2032
- Table 25: Global Water Sports Shoes Revenue million Forecast, by Country 2019 & 2032
- Table 26: Global Water Sports Shoes Volume K Forecast, by Country 2019 & 2032
- Table 27: Brazil Water Sports Shoes Revenue (million) Forecast, by Application 2019 & 2032
- Table 28: Brazil Water Sports Shoes Volume (K) Forecast, by Application 2019 & 2032
- Table 29: Argentina Water Sports Shoes Revenue (million) Forecast, by Application 2019 & 2032
- Table 30: Argentina Water Sports Shoes Volume (K) Forecast, by Application 2019 & 2032
- Table 31: Rest of South America Water Sports Shoes Revenue (million) Forecast, by Application 2019 & 2032
- Table 32: Rest of South America Water Sports Shoes Volume (K) Forecast, by Application 2019 & 2032
- Table 33: Global Water Sports Shoes Revenue million Forecast, by Application 2019 & 2032
- Table 34: Global Water Sports Shoes Volume K Forecast, by Application 2019 & 2032
- Table 35: Global Water Sports Shoes Revenue million Forecast, by Types 2019 & 2032
- Table 36: Global Water Sports Shoes Volume K Forecast, by Types 2019 & 2032
- Table 37: Global Water Sports Shoes Revenue million Forecast, by Country 2019 & 2032
- Table 38: Global Water Sports Shoes Volume K Forecast, by Country 2019 & 2032
- Table 39: United Kingdom Water Sports Shoes Revenue (million) Forecast, by Application 2019 & 2032
- Table 40: United Kingdom Water Sports Shoes Volume (K) Forecast, by Application 2019 & 2032
- Table 41: Germany Water Sports Shoes Revenue (million) Forecast, by Application 2019 & 2032
- Table 42: Germany Water Sports Shoes Volume (K) Forecast, by Application 2019 & 2032
- Table 43: France Water Sports Shoes Revenue (million) Forecast, by Application 2019 & 2032
- Table 44: France Water Sports Shoes Volume (K) Forecast, by Application 2019 & 2032
- Table 45: Italy Water Sports Shoes Revenue (million) Forecast, by Application 2019 & 2032
- Table 46: Italy Water Sports Shoes Volume (K) Forecast, by Application 2019 & 2032
- Table 47: Spain Water Sports Shoes Revenue (million) Forecast, by Application 2019 & 2032
- Table 48: Spain Water Sports Shoes Volume (K) Forecast, by Application 2019 & 2032
- Table 49: Russia Water Sports Shoes Revenue (million) Forecast, by Application 2019 & 2032
- Table 50: Russia Water Sports Shoes Volume (K) Forecast, by Application 2019 & 2032
- Table 51: Benelux Water Sports Shoes Revenue (million) Forecast, by Application 2019 & 2032
- Table 52: Benelux Water Sports Shoes Volume (K) Forecast, by Application 2019 & 2032
- Table 53: Nordics Water Sports Shoes Revenue (million) Forecast, by Application 2019 & 2032
- Table 54: Nordics Water Sports Shoes Volume (K) Forecast, by Application 2019 & 2032
- Table 55: Rest of Europe Water Sports Shoes Revenue (million) Forecast, by Application 2019 & 2032
- Table 56: Rest of Europe Water Sports Shoes Volume (K) Forecast, by Application 2019 & 2032
- Table 57: Global Water Sports Shoes Revenue million Forecast, by Application 2019 & 2032
- Table 58: Global Water Sports Shoes Volume K Forecast, by Application 2019 & 2032
- Table 59: Global Water Sports Shoes Revenue million Forecast, by Types 2019 & 2032
- Table 60: Global Water Sports Shoes Volume K Forecast, by Types 2019 & 2032
- Table 61: Global Water Sports Shoes Revenue million Forecast, by Country 2019 & 2032
- Table 62: Global Water Sports Shoes Volume K Forecast, by Country 2019 & 2032
- Table 63: Turkey Water Sports Shoes Revenue (million) Forecast, by Application 2019 & 2032
- Table 64: Turkey Water Sports Shoes Volume (K) Forecast, by Application 2019 & 2032
- Table 65: Israel Water Sports Shoes Revenue (million) Forecast, by Application 2019 & 2032
- Table 66: Israel Water Sports Shoes Volume (K) Forecast, by Application 2019 & 2032
- Table 67: GCC Water Sports Shoes Revenue (million) Forecast, by Application 2019 & 2032
- Table 68: GCC Water Sports Shoes Volume (K) Forecast, by Application 2019 & 2032
- Table 69: North Africa Water Sports Shoes Revenue (million) Forecast, by Application 2019 & 2032
- Table 70: North Africa Water Sports Shoes Volume (K) Forecast, by Application 2019 & 2032
- Table 71: South Africa Water Sports Shoes Revenue (million) Forecast, by Application 2019 & 2032
- Table 72: South Africa Water Sports Shoes Volume (K) Forecast, by Application 2019 & 2032
- Table 73: Rest of Middle East & Africa Water Sports Shoes Revenue (million) Forecast, by Application 2019 & 2032
- Table 74: Rest of Middle East & Africa Water Sports Shoes Volume (K) Forecast, by Application 2019 & 2032
- Table 75: Global Water Sports Shoes Revenue million Forecast, by Application 2019 & 2032
- Table 76: Global Water Sports Shoes Volume K Forecast, by Application 2019 & 2032
- Table 77: Global Water Sports Shoes Revenue million Forecast, by Types 2019 & 2032
- Table 78: Global Water Sports Shoes Volume K Forecast, by Types 2019 & 2032
- Table 79: Global Water Sports Shoes Revenue million Forecast, by Country 2019 & 2032
- Table 80: Global Water Sports Shoes Volume K Forecast, by Country 2019 & 2032
- Table 81: China Water Sports Shoes Revenue (million) Forecast, by Application 2019 & 2032
- Table 82: China Water Sports Shoes Volume (K) Forecast, by Application 2019 & 2032
- Table 83: India Water Sports Shoes Revenue (million) Forecast, by Application 2019 & 2032
- Table 84: India Water Sports Shoes Volume (K) Forecast, by Application 2019 & 2032
- Table 85: Japan Water Sports Shoes Revenue (million) Forecast, by Application 2019 & 2032
- Table 86: Japan Water Sports Shoes Volume (K) Forecast, by Application 2019 & 2032
- Table 87: South Korea Water Sports Shoes Revenue (million) Forecast, by Application 2019 & 2032
- Table 88: South Korea Water Sports Shoes Volume (K) Forecast, by Application 2019 & 2032
- Table 89: ASEAN Water Sports Shoes Revenue (million) Forecast, by Application 2019 & 2032
- Table 90: ASEAN Water Sports Shoes Volume (K) Forecast, by Application 2019 & 2032
- Table 91: Oceania Water Sports Shoes Revenue (million) Forecast, by Application 2019 & 2032
- Table 92: Oceania Water Sports Shoes Volume (K) Forecast, by Application 2019 & 2032
- Table 93: Rest of Asia Pacific Water Sports Shoes Revenue (million) Forecast, by Application 2019 & 2032
- Table 94: Rest of Asia Pacific Water Sports Shoes Volume (K) Forecast, by Application 2019 & 2032
Frequently Asked Questions
1. What is the projected Compound Annual Growth Rate (CAGR) of the Water Sports Shoes?
The projected CAGR is approximately XX%.
2. Which companies are prominent players in the Water Sports Shoes?
Key companies in the market include Agama, Vifuur, InSPORTline, Aquasphere, Speedo, Jobe Sports, Aqua Lung, Ryka, Mares, AleaderGear, Columbia, Kane Footwear, Body Glove, Astral, Crocs, Aropec.
3. What are the main segments of the Water Sports Shoes?
The market segments include Application, Types.
4. Can you provide details about the market size?
The market size is estimated to be USD XXX million as of 2022.
5. What are some drivers contributing to market growth?
N/A
6. What are the notable trends driving market growth?
N/A
7. Are there any restraints impacting market growth?
N/A
8. Can you provide examples of recent developments in the market?
N/A
9. What pricing options are available for accessing the report?
Pricing options include single-user, multi-user, and enterprise licenses priced at USD 3950.00, USD 5925.00, and USD 7900.00 respectively.
10. Is the market size provided in terms of value or volume?
The market size is provided in terms of value, measured in million and volume, measured in K.
11. Are there any specific market keywords associated with the report?
Yes, the market keyword associated with the report is "Water Sports Shoes," which aids in identifying and referencing the specific market segment covered.
12. How do I determine which pricing option suits my needs best?
The pricing options vary based on user requirements and access needs. Individual users may opt for single-user licenses, while businesses requiring broader access may choose multi-user or enterprise licenses for cost-effective access to the report.
13. Are there any additional resources or data provided in the Water Sports Shoes report?
While the report offers comprehensive insights, it's advisable to review the specific contents or supplementary materials provided to ascertain if additional resources or data are available.
14. How can I stay updated on further developments or reports in the Water Sports Shoes?
To stay informed about further developments, trends, and reports in the Water Sports Shoes, consider subscribing to industry newsletters, following relevant companies and organizations, or regularly checking reputable industry news sources and publications.
Methodology
Step 1 - Identification of Relevant Samples Size from Population Database


Step 2 - Approaches for Defining Global Market Size (Value, Volume* & Price*)

Note*: In applicable scenarios
Step 3 - Data Sources
Primary Research
- Web Analytics
- Survey Reports
- Research Institute
- Latest Research Reports
- Opinion Leaders
Secondary Research
- Annual Reports
- White Paper
- Latest Press Release
- Industry Association
- Paid Database
- Investor Presentations

Step 4 - Data Triangulation
Involves using different sources of information in order to increase the validity of a study
These sources are likely to be stakeholders in a program - participants, other researchers, program staff, other community members, and so on.
Then we put all data in single framework & apply various statistical tools to find out the dynamic on the market.
During the analysis stage, feedback from the stakeholder groups would be compared to determine areas of agreement as well as areas of divergence
