

Key Insights
The Air Quality Monitoring Software market is experiencing robust growth, driven by increasing environmental concerns, stringent government regulations on air quality, and the rising adoption of smart cities initiatives. A Compound Annual Growth Rate (CAGR) of 6.30% from 2019 to 2024 suggests a significant expansion, which is projected to continue throughout the forecast period (2025-2033). The market is segmented by software type (indoor and outdoor) and end-user (residential, commercial, industrial, and public agencies). The strong growth is fueled by the increasing demand for real-time air quality data for effective pollution control, public health monitoring, and environmental research. Specific drivers include the proliferation of IoT devices, advancements in sensor technology enabling more accurate and affordable monitoring, and the growing awareness of the health impacts of poor air quality among consumers and businesses. While data limitations prevent precise market sizing, industry reports suggest a substantial market value, expected to grow significantly over the next decade. The North American and European regions are expected to dominate the market due to established environmental regulations and technological advancements, while the Asia-Pacific region is predicted to experience rapid growth driven by industrialization and urbanization. Competitive pressures exist among established players like Horiba Ltd, Merck KGaA, and Honeywell HBT, as well as emerging technology companies. However, the overall market presents considerable opportunity for both established and emerging players, with future growth dependent on technological innovation, regulatory changes, and expanding adoption across various sectors and geographies. Challenges may include high initial investment costs for certain solutions and the need for ongoing data management and maintenance.
The segmentation of the market by software type (indoor versus outdoor) and end-user reflects diverse needs and priorities. For example, indoor air quality monitoring software is particularly relevant for residential and commercial buildings aiming to improve occupant health and well-being, while outdoor monitoring is crucial for public agencies and industrial facilities to comply with environmental standards and minimize pollution impact. The geographic distribution of market share highlights the different stages of regulatory development and technological adoption in different regions. The continued expansion of the market will likely be driven by further integration with other technologies like predictive analytics and AI, offering more comprehensive and actionable insights. Furthermore, user-friendly interfaces and data visualization tools will be key to expanding adoption beyond specialized users to broader segments, particularly in the residential sector. The growth trajectory emphasizes the critical role of air quality monitoring software in addressing global environmental challenges and fostering a healthier and more sustainable world.
Air Quality Monitoring Software Market: A Comprehensive Report (2019-2033)
This comprehensive report provides a detailed analysis of the Air Quality Monitoring Software market, encompassing market dynamics, growth trends, regional dominance, product landscape, key players, and future outlook. The study covers the period from 2019 to 2033, with 2025 serving as the base year and the forecast period extending from 2025 to 2033. The historical period analyzed is 2019-2024. The market is segmented by type (Indoor Air Quality Monitoring Software, Outdoor Air Quality Monitoring Software) and end-user (Residential and Commercial, Industries, Public Agencies (Government, Research Institutes, and UAQMA)). This report is invaluable for industry professionals, investors, and researchers seeking a deep understanding of this rapidly evolving market. The total market size is predicted to reach xx Million by 2033.
Air Quality Monitoring Software Market Dynamics & Structure
The Air Quality Monitoring Software market is characterized by moderate concentration, with several key players holding significant market share. Technological innovation, driven by advancements in sensor technology, data analytics, and IoT integration, is a primary growth driver. Stringent environmental regulations globally are further propelling market expansion, while the increasing awareness of air quality's impact on public health fuels demand. Competitive pressures are present, with established players and emerging startups vying for market dominance. The market is witnessing a rise in M&A activities, as larger players consolidate their position and expand their product portfolios.
- Market Concentration: Moderately concentrated, with top 5 players holding approximately xx% market share in 2024.
- Technological Innovation: Advancements in sensor miniaturization, AI-powered data analysis, and cloud-based platforms are key innovation drivers.
- Regulatory Framework: Stringent environmental regulations in developed and developing nations are fostering market growth.
- Competitive Substitutes: Limited direct substitutes exist; however, traditional monitoring methods pose indirect competition.
- End-User Demographics: Growing urbanization and industrialization are increasing demand across various end-user segments.
- M&A Trends: A moderate number of M&A deals (xx deals in 2024) have been observed, driven by expansion and consolidation strategies.
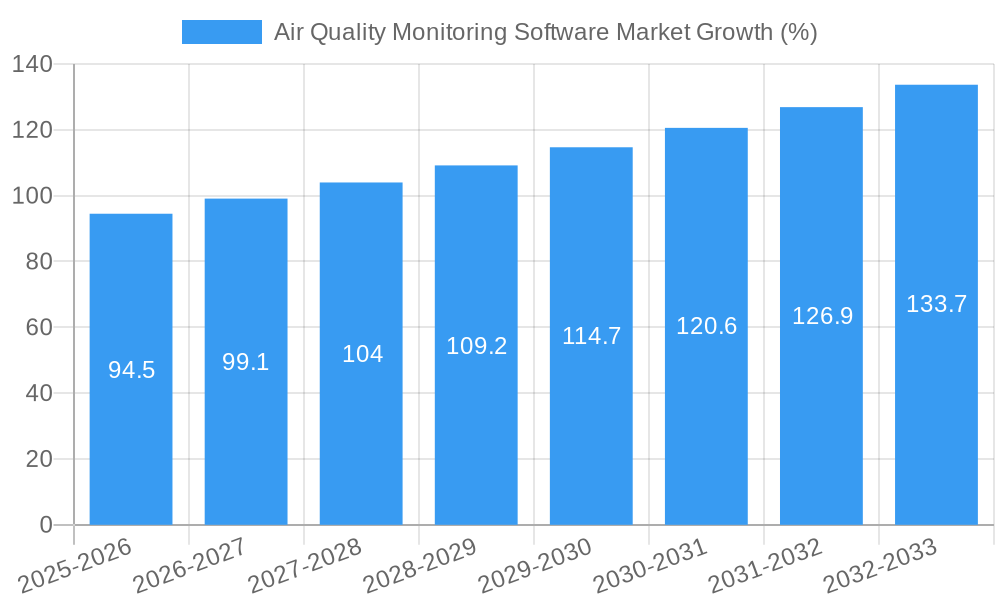
Air Quality Monitoring Software Market Growth Trends & Insights
The Air Quality Monitoring Software market exhibits a robust growth trajectory, driven by increasing concerns about air pollution, stricter environmental regulations, and the rising adoption of smart city initiatives. The market is expected to witness a CAGR of xx% during the forecast period (2025-2033), expanding from xx Million in 2025 to xx Million by 2033. Market penetration is currently at xx%, with significant growth potential in emerging economies. Technological disruptions, such as the integration of IoT and AI, are transforming the market landscape, enabling more efficient and data-driven monitoring solutions. Consumer behavior is shifting towards increased demand for user-friendly, real-time monitoring systems with advanced data visualization capabilities.
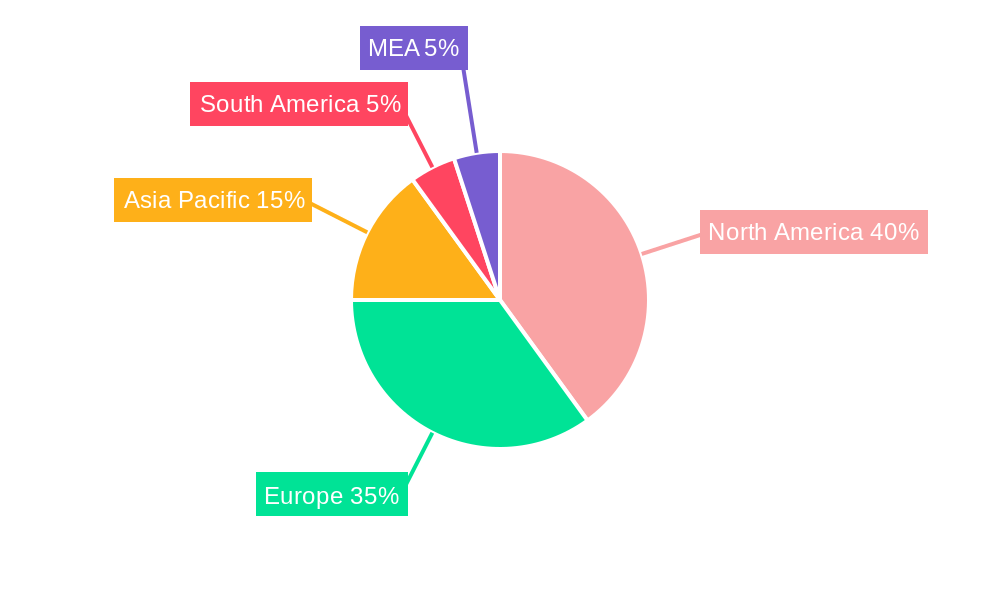
Dominant Regions, Countries, or Segments in Air Quality Monitoring Software Market
North America currently holds the largest market share in the Air Quality Monitoring Software market, driven by stringent environmental regulations, substantial investments in research and development, and a high level of awareness about air quality issues. However, Asia Pacific is projected to exhibit the fastest growth rate during the forecast period, fueled by rapid urbanization, industrialization, and increasing government initiatives to improve air quality. The Outdoor Air Quality Monitoring Software segment currently dominates the market by type, owing to higher demand from public agencies and industrial sectors. Within the end-user segment, public agencies (government, research institutes, and UAQMA) are major consumers, followed by industries.
- North America: Strong regulatory framework, high technological advancement, and increased awareness of air quality.
- Asia Pacific: Rapid urbanization, industrial growth, and government support for environmental monitoring.
- Europe: Stringent environmental regulations and a focus on sustainable development.
- Outdoor Air Quality Monitoring Software: Higher demand from public agencies and industrial sectors.
- Public Agencies: Significant investments in air quality monitoring infrastructure.
Air Quality Monitoring Software Market Product Landscape
The Air Quality Monitoring Software market offers a range of solutions, from basic monitoring systems to sophisticated platforms integrating IoT, AI, and cloud computing. These platforms provide real-time data visualization, predictive analytics, and remote monitoring capabilities. Key features include high accuracy sensors, user-friendly interfaces, data integration with other systems, and customizable reporting functionalities. Continuous innovations focus on enhancing accuracy, reducing costs, and expanding functionalities, such as integrating with other environmental sensors and predictive modeling for pollution forecasting.
Key Drivers, Barriers & Challenges in Air Quality Monitoring Software Market
Key Drivers:
- Increasing awareness of air pollution's impact on public health.
- Stringent environmental regulations and government initiatives.
- Growing adoption of smart city technologies and IoT.
- Advancements in sensor technologies and data analytics.
Challenges:
- High initial investment costs for advanced systems.
- Data security and privacy concerns.
- Interoperability issues between different systems.
- Dependence on reliable internet connectivity for remote monitoring. A potential constraint is the xx% increase in sensor production costs in 2024, impacting the overall cost of software solutions.
Emerging Opportunities in Air Quality Monitoring Software Market
- Expansion into developing economies with growing air pollution concerns.
- Integration with other environmental monitoring technologies (e.g., water quality, noise pollution).
- Development of personalized air quality monitoring solutions for individual consumers.
- Leveraging AI and machine learning for predictive modeling and early warning systems.
Growth Accelerators in the Air Quality Monitoring Software Market Industry
Technological breakthroughs in sensor technology, cloud computing, and artificial intelligence are key growth catalysts. Strategic partnerships between software providers and hardware manufacturers are expanding market reach and fostering innovation. Governments are actively promoting the adoption of air quality monitoring software through funding initiatives and supportive regulatory frameworks. Expansion into new markets and diversification of product offerings are driving long-term growth.
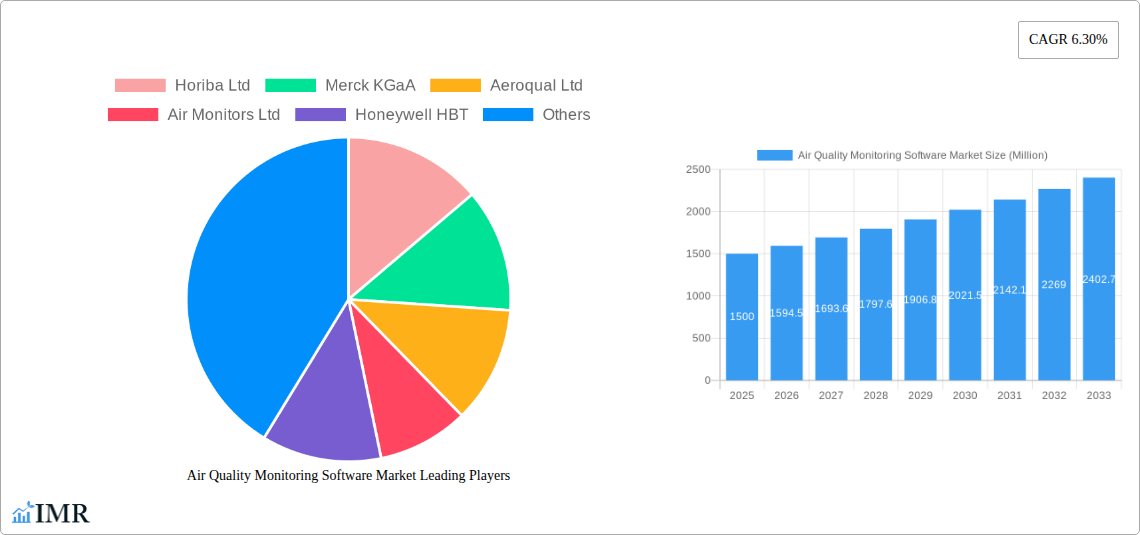
Key Players Shaping the Air Quality Monitoring Software Market Market
- Horiba Ltd
- Merck KGaA
- Aeroqual Ltd
- Air Monitors Ltd
- Honeywell HBT
- Thermo Fisher Scientific Inc
- Hawa Dawa GmbH
- Teledyne Technologies Incorporated
- Siemens AG
- Cambridge Environmental Research Consultants Ltd
- Envirotech Online
- Robert Bosch GmbH
- Lakes Environmental Software
Notable Milestones in Air Quality Monitoring Software Market Sector
- July 2022: Merck launched a global network to promote sustainable and innovative "Next-Gen Labs."
- February 2022: Thermo Fisher Scientific Inc. unveiled the Renvo Rapid PCR Test for rapid air pathogen surveillance.
In-Depth Air Quality Monitoring Software Market Market Outlook
The Air Quality Monitoring Software market presents significant growth potential, driven by technological advancements, increasing environmental awareness, and supportive government policies. Strategic partnerships, expansion into untapped markets, and the development of innovative solutions will shape the future market landscape. The market's long-term outlook is positive, with continued growth expected throughout the forecast period. Opportunities exist for companies to differentiate themselves through the development of user-friendly interfaces, advanced data analytics capabilities, and cost-effective solutions catering to diverse end-user needs.
Air Quality Monitoring Software Market Segmentation
-
1. Type
- 1.1. Indoor Air Quality Monitoring Software
- 1.2. Outdoor Air Quality Monitoring Software
-
2. End User
- 2.1. Residential and Commercial
- 2.2. Industries
- 2.3. Public A
Air Quality Monitoring Software Market Segmentation By Geography
- 1. North America
- 2. Europe
- 3. Asia Pacific
- 4. Latin America
- 5. Middle East and Africa
Air Quality Monitoring Software Market REPORT HIGHLIGHTS
| Aspects | Details |
|---|---|
| Study Period | 2019-2033 |
| Base Year | 2024 |
| Estimated Year | 2025 |
| Forecast Period | 2025-2033 |
| Historical Period | 2019-2024 |
| Growth Rate | CAGR of 6.30% from 2019-2033 |
| Segmentation |
|
Table of Contents
- 1. Introduction
- 1.1. Research Scope
- 1.2. Market Segmentation
- 1.3. Research Methodology
- 1.4. Definitions and Assumptions
- 2. Executive Summary
- 2.1. Introduction
- 3. Market Dynamics
- 3.1. Introduction
- 3.2. Market Drivers
- 3.2.1. Strong Demand for Indoor AQM; High-Credibility of IoT and AI-Based Systems
- 3.3. Market Restrains
- 3.3.1. Cost Woes for Monitoring and Maintenance
- 3.4. Market Trends
- 3.4.1. Indoor Air Quality Monitoring (IAQM) Demand Propelling Growth
- 4. Market Factor Analysis
- 4.1. Porters Five Forces
- 4.2. Supply/Value Chain
- 4.3. PESTEL analysis
- 4.4. Market Entropy
- 4.5. Patent/Trademark Analysis
- 5. Global Air Quality Monitoring Software Market Analysis, Insights and Forecast, 2019-2031
- 5.1. Market Analysis, Insights and Forecast - by Type
- 5.1.1. Indoor Air Quality Monitoring Software
- 5.1.2. Outdoor Air Quality Monitoring Software
- 5.2. Market Analysis, Insights and Forecast - by End User
- 5.2.1. Residential and Commercial
- 5.2.2. Industries
- 5.2.3. Public A
- 5.3. Market Analysis, Insights and Forecast - by Region
- 5.3.1. North America
- 5.3.2. Europe
- 5.3.3. Asia Pacific
- 5.3.4. Latin America
- 5.3.5. Middle East and Africa
- 5.1. Market Analysis, Insights and Forecast - by Type
- 6. North America Air Quality Monitoring Software Market Analysis, Insights and Forecast, 2019-2031
- 6.1. Market Analysis, Insights and Forecast - by Type
- 6.1.1. Indoor Air Quality Monitoring Software
- 6.1.2. Outdoor Air Quality Monitoring Software
- 6.2. Market Analysis, Insights and Forecast - by End User
- 6.2.1. Residential and Commercial
- 6.2.2. Industries
- 6.2.3. Public A
- 6.1. Market Analysis, Insights and Forecast - by Type
- 7. Europe Air Quality Monitoring Software Market Analysis, Insights and Forecast, 2019-2031
- 7.1. Market Analysis, Insights and Forecast - by Type
- 7.1.1. Indoor Air Quality Monitoring Software
- 7.1.2. Outdoor Air Quality Monitoring Software
- 7.2. Market Analysis, Insights and Forecast - by End User
- 7.2.1. Residential and Commercial
- 7.2.2. Industries
- 7.2.3. Public A
- 7.1. Market Analysis, Insights and Forecast - by Type
- 8. Asia Pacific Air Quality Monitoring Software Market Analysis, Insights and Forecast, 2019-2031
- 8.1. Market Analysis, Insights and Forecast - by Type
- 8.1.1. Indoor Air Quality Monitoring Software
- 8.1.2. Outdoor Air Quality Monitoring Software
- 8.2. Market Analysis, Insights and Forecast - by End User
- 8.2.1. Residential and Commercial
- 8.2.2. Industries
- 8.2.3. Public A
- 8.1. Market Analysis, Insights and Forecast - by Type
- 9. Latin America Air Quality Monitoring Software Market Analysis, Insights and Forecast, 2019-2031
- 9.1. Market Analysis, Insights and Forecast - by Type
- 9.1.1. Indoor Air Quality Monitoring Software
- 9.1.2. Outdoor Air Quality Monitoring Software
- 9.2. Market Analysis, Insights and Forecast - by End User
- 9.2.1. Residential and Commercial
- 9.2.2. Industries
- 9.2.3. Public A
- 9.1. Market Analysis, Insights and Forecast - by Type
- 10. Middle East and Africa Air Quality Monitoring Software Market Analysis, Insights and Forecast, 2019-2031
- 10.1. Market Analysis, Insights and Forecast - by Type
- 10.1.1. Indoor Air Quality Monitoring Software
- 10.1.2. Outdoor Air Quality Monitoring Software
- 10.2. Market Analysis, Insights and Forecast - by End User
- 10.2.1. Residential and Commercial
- 10.2.2. Industries
- 10.2.3. Public A
- 10.1. Market Analysis, Insights and Forecast - by Type
- 11. North America Air Quality Monitoring Software Market Analysis, Insights and Forecast, 2019-2031
- 11.1. Market Analysis, Insights and Forecast - By Country/Sub-region
- 11.1.1 United States
- 11.1.2 Canada
- 11.1.3 Mexico
- 12. Europe Air Quality Monitoring Software Market Analysis, Insights and Forecast, 2019-2031
- 12.1. Market Analysis, Insights and Forecast - By Country/Sub-region
- 12.1.1 Germany
- 12.1.2 United Kingdom
- 12.1.3 France
- 12.1.4 Spain
- 12.1.5 Italy
- 12.1.6 Spain
- 12.1.7 Belgium
- 12.1.8 Netherland
- 12.1.9 Nordics
- 12.1.10 Rest of Europe
- 13. Asia Pacific Air Quality Monitoring Software Market Analysis, Insights and Forecast, 2019-2031
- 13.1. Market Analysis, Insights and Forecast - By Country/Sub-region
- 13.1.1 China
- 13.1.2 Japan
- 13.1.3 India
- 13.1.4 South Korea
- 13.1.5 Southeast Asia
- 13.1.6 Australia
- 13.1.7 Indonesia
- 13.1.8 Phillipes
- 13.1.9 Singapore
- 13.1.10 Thailandc
- 13.1.11 Rest of Asia Pacific
- 14. South America Air Quality Monitoring Software Market Analysis, Insights and Forecast, 2019-2031
- 14.1. Market Analysis, Insights and Forecast - By Country/Sub-region
- 14.1.1 Brazil
- 14.1.2 Argentina
- 14.1.3 Peru
- 14.1.4 Chile
- 14.1.5 Colombia
- 14.1.6 Ecuador
- 14.1.7 Venezuela
- 14.1.8 Rest of South America
- 15. North America Air Quality Monitoring Software Market Analysis, Insights and Forecast, 2019-2031
- 15.1. Market Analysis, Insights and Forecast - By Country/Sub-region
- 15.1.1 United States
- 15.1.2 Canada
- 15.1.3 Mexico
- 16. MEA Air Quality Monitoring Software Market Analysis, Insights and Forecast, 2019-2031
- 16.1. Market Analysis, Insights and Forecast - By Country/Sub-region
- 16.1.1 United Arab Emirates
- 16.1.2 Saudi Arabia
- 16.1.3 South Africa
- 16.1.4 Rest of Middle East and Africa
- 17. Competitive Analysis
- 17.1. Global Market Share Analysis 2024
- 17.2. Company Profiles
- 17.2.1 Horiba Ltd
- 17.2.1.1. Overview
- 17.2.1.2. Products
- 17.2.1.3. SWOT Analysis
- 17.2.1.4. Recent Developments
- 17.2.1.5. Financials (Based on Availability)
- 17.2.2 Merck KGaA
- 17.2.2.1. Overview
- 17.2.2.2. Products
- 17.2.2.3. SWOT Analysis
- 17.2.2.4. Recent Developments
- 17.2.2.5. Financials (Based on Availability)
- 17.2.3 Aeroqual Ltd
- 17.2.3.1. Overview
- 17.2.3.2. Products
- 17.2.3.3. SWOT Analysis
- 17.2.3.4. Recent Developments
- 17.2.3.5. Financials (Based on Availability)
- 17.2.4 Air Monitors Ltd
- 17.2.4.1. Overview
- 17.2.4.2. Products
- 17.2.4.3. SWOT Analysis
- 17.2.4.4. Recent Developments
- 17.2.4.5. Financials (Based on Availability)
- 17.2.5 Honeywell HBT
- 17.2.5.1. Overview
- 17.2.5.2. Products
- 17.2.5.3. SWOT Analysis
- 17.2.5.4. Recent Developments
- 17.2.5.5. Financials (Based on Availability)
- 17.2.6 Thermo Fisher Scientific Inc
- 17.2.6.1. Overview
- 17.2.6.2. Products
- 17.2.6.3. SWOT Analysis
- 17.2.6.4. Recent Developments
- 17.2.6.5. Financials (Based on Availability)
- 17.2.7 Hawa Dawa GmbH
- 17.2.7.1. Overview
- 17.2.7.2. Products
- 17.2.7.3. SWOT Analysis
- 17.2.7.4. Recent Developments
- 17.2.7.5. Financials (Based on Availability)
- 17.2.8 Teledyne Technologies Incorporated
- 17.2.8.1. Overview
- 17.2.8.2. Products
- 17.2.8.3. SWOT Analysis
- 17.2.8.4. Recent Developments
- 17.2.8.5. Financials (Based on Availability)
- 17.2.9 Siemens AG
- 17.2.9.1. Overview
- 17.2.9.2. Products
- 17.2.9.3. SWOT Analysis
- 17.2.9.4. Recent Developments
- 17.2.9.5. Financials (Based on Availability)
- 17.2.10 Cambridge Environmental Research Consultants Ltd
- 17.2.10.1. Overview
- 17.2.10.2. Products
- 17.2.10.3. SWOT Analysis
- 17.2.10.4. Recent Developments
- 17.2.10.5. Financials (Based on Availability)
- 17.2.11 Envirotech Online
- 17.2.11.1. Overview
- 17.2.11.2. Products
- 17.2.11.3. SWOT Analysis
- 17.2.11.4. Recent Developments
- 17.2.11.5. Financials (Based on Availability)
- 17.2.12 Robert Bosch GmbH
- 17.2.12.1. Overview
- 17.2.12.2. Products
- 17.2.12.3. SWOT Analysis
- 17.2.12.4. Recent Developments
- 17.2.12.5. Financials (Based on Availability)
- 17.2.13 Lakes Environmental Software
- 17.2.13.1. Overview
- 17.2.13.2. Products
- 17.2.13.3. SWOT Analysis
- 17.2.13.4. Recent Developments
- 17.2.13.5. Financials (Based on Availability)
- 17.2.1 Horiba Ltd
List of Figures
- Figure 1: Global Air Quality Monitoring Software Market Revenue Breakdown (Million, %) by Region 2024 & 2032
- Figure 2: North America Air Quality Monitoring Software Market Revenue (Million), by Country 2024 & 2032
- Figure 3: North America Air Quality Monitoring Software Market Revenue Share (%), by Country 2024 & 2032
- Figure 4: Europe Air Quality Monitoring Software Market Revenue (Million), by Country 2024 & 2032
- Figure 5: Europe Air Quality Monitoring Software Market Revenue Share (%), by Country 2024 & 2032
- Figure 6: Asia Pacific Air Quality Monitoring Software Market Revenue (Million), by Country 2024 & 2032
- Figure 7: Asia Pacific Air Quality Monitoring Software Market Revenue Share (%), by Country 2024 & 2032
- Figure 8: South America Air Quality Monitoring Software Market Revenue (Million), by Country 2024 & 2032
- Figure 9: South America Air Quality Monitoring Software Market Revenue Share (%), by Country 2024 & 2032
- Figure 10: North America Air Quality Monitoring Software Market Revenue (Million), by Country 2024 & 2032
- Figure 11: North America Air Quality Monitoring Software Market Revenue Share (%), by Country 2024 & 2032
- Figure 12: MEA Air Quality Monitoring Software Market Revenue (Million), by Country 2024 & 2032
- Figure 13: MEA Air Quality Monitoring Software Market Revenue Share (%), by Country 2024 & 2032
- Figure 14: North America Air Quality Monitoring Software Market Revenue (Million), by Type 2024 & 2032
- Figure 15: North America Air Quality Monitoring Software Market Revenue Share (%), by Type 2024 & 2032
- Figure 16: North America Air Quality Monitoring Software Market Revenue (Million), by End User 2024 & 2032
- Figure 17: North America Air Quality Monitoring Software Market Revenue Share (%), by End User 2024 & 2032
- Figure 18: North America Air Quality Monitoring Software Market Revenue (Million), by Country 2024 & 2032
- Figure 19: North America Air Quality Monitoring Software Market Revenue Share (%), by Country 2024 & 2032
- Figure 20: Europe Air Quality Monitoring Software Market Revenue (Million), by Type 2024 & 2032
- Figure 21: Europe Air Quality Monitoring Software Market Revenue Share (%), by Type 2024 & 2032
- Figure 22: Europe Air Quality Monitoring Software Market Revenue (Million), by End User 2024 & 2032
- Figure 23: Europe Air Quality Monitoring Software Market Revenue Share (%), by End User 2024 & 2032
- Figure 24: Europe Air Quality Monitoring Software Market Revenue (Million), by Country 2024 & 2032
- Figure 25: Europe Air Quality Monitoring Software Market Revenue Share (%), by Country 2024 & 2032
- Figure 26: Asia Pacific Air Quality Monitoring Software Market Revenue (Million), by Type 2024 & 2032
- Figure 27: Asia Pacific Air Quality Monitoring Software Market Revenue Share (%), by Type 2024 & 2032
- Figure 28: Asia Pacific Air Quality Monitoring Software Market Revenue (Million), by End User 2024 & 2032
- Figure 29: Asia Pacific Air Quality Monitoring Software Market Revenue Share (%), by End User 2024 & 2032
- Figure 30: Asia Pacific Air Quality Monitoring Software Market Revenue (Million), by Country 2024 & 2032
- Figure 31: Asia Pacific Air Quality Monitoring Software Market Revenue Share (%), by Country 2024 & 2032
- Figure 32: Latin America Air Quality Monitoring Software Market Revenue (Million), by Type 2024 & 2032
- Figure 33: Latin America Air Quality Monitoring Software Market Revenue Share (%), by Type 2024 & 2032
- Figure 34: Latin America Air Quality Monitoring Software Market Revenue (Million), by End User 2024 & 2032
- Figure 35: Latin America Air Quality Monitoring Software Market Revenue Share (%), by End User 2024 & 2032
- Figure 36: Latin America Air Quality Monitoring Software Market Revenue (Million), by Country 2024 & 2032
- Figure 37: Latin America Air Quality Monitoring Software Market Revenue Share (%), by Country 2024 & 2032
- Figure 38: Middle East and Africa Air Quality Monitoring Software Market Revenue (Million), by Type 2024 & 2032
- Figure 39: Middle East and Africa Air Quality Monitoring Software Market Revenue Share (%), by Type 2024 & 2032
- Figure 40: Middle East and Africa Air Quality Monitoring Software Market Revenue (Million), by End User 2024 & 2032
- Figure 41: Middle East and Africa Air Quality Monitoring Software Market Revenue Share (%), by End User 2024 & 2032
- Figure 42: Middle East and Africa Air Quality Monitoring Software Market Revenue (Million), by Country 2024 & 2032
- Figure 43: Middle East and Africa Air Quality Monitoring Software Market Revenue Share (%), by Country 2024 & 2032
List of Tables
- Table 1: Global Air Quality Monitoring Software Market Revenue Million Forecast, by Region 2019 & 2032
- Table 2: Global Air Quality Monitoring Software Market Revenue Million Forecast, by Type 2019 & 2032
- Table 3: Global Air Quality Monitoring Software Market Revenue Million Forecast, by End User 2019 & 2032
- Table 4: Global Air Quality Monitoring Software Market Revenue Million Forecast, by Region 2019 & 2032
- Table 5: Global Air Quality Monitoring Software Market Revenue Million Forecast, by Country 2019 & 2032
- Table 6: United States Air Quality Monitoring Software Market Revenue (Million) Forecast, by Application 2019 & 2032
- Table 7: Canada Air Quality Monitoring Software Market Revenue (Million) Forecast, by Application 2019 & 2032
- Table 8: Mexico Air Quality Monitoring Software Market Revenue (Million) Forecast, by Application 2019 & 2032
- Table 9: Global Air Quality Monitoring Software Market Revenue Million Forecast, by Country 2019 & 2032
- Table 10: Germany Air Quality Monitoring Software Market Revenue (Million) Forecast, by Application 2019 & 2032
- Table 11: United Kingdom Air Quality Monitoring Software Market Revenue (Million) Forecast, by Application 2019 & 2032
- Table 12: France Air Quality Monitoring Software Market Revenue (Million) Forecast, by Application 2019 & 2032
- Table 13: Spain Air Quality Monitoring Software Market Revenue (Million) Forecast, by Application 2019 & 2032
- Table 14: Italy Air Quality Monitoring Software Market Revenue (Million) Forecast, by Application 2019 & 2032
- Table 15: Spain Air Quality Monitoring Software Market Revenue (Million) Forecast, by Application 2019 & 2032
- Table 16: Belgium Air Quality Monitoring Software Market Revenue (Million) Forecast, by Application 2019 & 2032
- Table 17: Netherland Air Quality Monitoring Software Market Revenue (Million) Forecast, by Application 2019 & 2032
- Table 18: Nordics Air Quality Monitoring Software Market Revenue (Million) Forecast, by Application 2019 & 2032
- Table 19: Rest of Europe Air Quality Monitoring Software Market Revenue (Million) Forecast, by Application 2019 & 2032
- Table 20: Global Air Quality Monitoring Software Market Revenue Million Forecast, by Country 2019 & 2032
- Table 21: China Air Quality Monitoring Software Market Revenue (Million) Forecast, by Application 2019 & 2032
- Table 22: Japan Air Quality Monitoring Software Market Revenue (Million) Forecast, by Application 2019 & 2032
- Table 23: India Air Quality Monitoring Software Market Revenue (Million) Forecast, by Application 2019 & 2032
- Table 24: South Korea Air Quality Monitoring Software Market Revenue (Million) Forecast, by Application 2019 & 2032
- Table 25: Southeast Asia Air Quality Monitoring Software Market Revenue (Million) Forecast, by Application 2019 & 2032
- Table 26: Australia Air Quality Monitoring Software Market Revenue (Million) Forecast, by Application 2019 & 2032
- Table 27: Indonesia Air Quality Monitoring Software Market Revenue (Million) Forecast, by Application 2019 & 2032
- Table 28: Phillipes Air Quality Monitoring Software Market Revenue (Million) Forecast, by Application 2019 & 2032
- Table 29: Singapore Air Quality Monitoring Software Market Revenue (Million) Forecast, by Application 2019 & 2032
- Table 30: Thailandc Air Quality Monitoring Software Market Revenue (Million) Forecast, by Application 2019 & 2032
- Table 31: Rest of Asia Pacific Air Quality Monitoring Software Market Revenue (Million) Forecast, by Application 2019 & 2032
- Table 32: Global Air Quality Monitoring Software Market Revenue Million Forecast, by Country 2019 & 2032
- Table 33: Brazil Air Quality Monitoring Software Market Revenue (Million) Forecast, by Application 2019 & 2032
- Table 34: Argentina Air Quality Monitoring Software Market Revenue (Million) Forecast, by Application 2019 & 2032
- Table 35: Peru Air Quality Monitoring Software Market Revenue (Million) Forecast, by Application 2019 & 2032
- Table 36: Chile Air Quality Monitoring Software Market Revenue (Million) Forecast, by Application 2019 & 2032
- Table 37: Colombia Air Quality Monitoring Software Market Revenue (Million) Forecast, by Application 2019 & 2032
- Table 38: Ecuador Air Quality Monitoring Software Market Revenue (Million) Forecast, by Application 2019 & 2032
- Table 39: Venezuela Air Quality Monitoring Software Market Revenue (Million) Forecast, by Application 2019 & 2032
- Table 40: Rest of South America Air Quality Monitoring Software Market Revenue (Million) Forecast, by Application 2019 & 2032
- Table 41: Global Air Quality Monitoring Software Market Revenue Million Forecast, by Country 2019 & 2032
- Table 42: United States Air Quality Monitoring Software Market Revenue (Million) Forecast, by Application 2019 & 2032
- Table 43: Canada Air Quality Monitoring Software Market Revenue (Million) Forecast, by Application 2019 & 2032
- Table 44: Mexico Air Quality Monitoring Software Market Revenue (Million) Forecast, by Application 2019 & 2032
- Table 45: Global Air Quality Monitoring Software Market Revenue Million Forecast, by Country 2019 & 2032
- Table 46: United Arab Emirates Air Quality Monitoring Software Market Revenue (Million) Forecast, by Application 2019 & 2032
- Table 47: Saudi Arabia Air Quality Monitoring Software Market Revenue (Million) Forecast, by Application 2019 & 2032
- Table 48: South Africa Air Quality Monitoring Software Market Revenue (Million) Forecast, by Application 2019 & 2032
- Table 49: Rest of Middle East and Africa Air Quality Monitoring Software Market Revenue (Million) Forecast, by Application 2019 & 2032
- Table 50: Global Air Quality Monitoring Software Market Revenue Million Forecast, by Type 2019 & 2032
- Table 51: Global Air Quality Monitoring Software Market Revenue Million Forecast, by End User 2019 & 2032
- Table 52: Global Air Quality Monitoring Software Market Revenue Million Forecast, by Country 2019 & 2032
- Table 53: Global Air Quality Monitoring Software Market Revenue Million Forecast, by Type 2019 & 2032
- Table 54: Global Air Quality Monitoring Software Market Revenue Million Forecast, by End User 2019 & 2032
- Table 55: Global Air Quality Monitoring Software Market Revenue Million Forecast, by Country 2019 & 2032
- Table 56: Global Air Quality Monitoring Software Market Revenue Million Forecast, by Type 2019 & 2032
- Table 57: Global Air Quality Monitoring Software Market Revenue Million Forecast, by End User 2019 & 2032
- Table 58: Global Air Quality Monitoring Software Market Revenue Million Forecast, by Country 2019 & 2032
- Table 59: Global Air Quality Monitoring Software Market Revenue Million Forecast, by Type 2019 & 2032
- Table 60: Global Air Quality Monitoring Software Market Revenue Million Forecast, by End User 2019 & 2032
- Table 61: Global Air Quality Monitoring Software Market Revenue Million Forecast, by Country 2019 & 2032
- Table 62: Global Air Quality Monitoring Software Market Revenue Million Forecast, by Type 2019 & 2032
- Table 63: Global Air Quality Monitoring Software Market Revenue Million Forecast, by End User 2019 & 2032
- Table 64: Global Air Quality Monitoring Software Market Revenue Million Forecast, by Country 2019 & 2032
Frequently Asked Questions
1. What is the projected Compound Annual Growth Rate (CAGR) of the Air Quality Monitoring Software Market?
The projected CAGR is approximately 6.30%.
2. Which companies are prominent players in the Air Quality Monitoring Software Market?
Key companies in the market include Horiba Ltd, Merck KGaA, Aeroqual Ltd, Air Monitors Ltd, Honeywell HBT, Thermo Fisher Scientific Inc, Hawa Dawa GmbH, Teledyne Technologies Incorporated, Siemens AG, Cambridge Environmental Research Consultants Ltd, Envirotech Online, Robert Bosch GmbH, Lakes Environmental Software.
3. What are the main segments of the Air Quality Monitoring Software Market?
The market segments include Type, End User.
4. Can you provide details about the market size?
The market size is estimated to be USD XX Million as of 2022.
5. What are some drivers contributing to market growth?
Strong Demand for Indoor AQM; High-Credibility of IoT and AI-Based Systems.
6. What are the notable trends driving market growth?
Indoor Air Quality Monitoring (IAQM) Demand Propelling Growth.
7. Are there any restraints impacting market growth?
Cost Woes for Monitoring and Maintenance.
8. Can you provide examples of recent developments in the market?
In July 2022, Merck launched a worldwide network to link the sector with professionals in the field to learn how to create "Next-Gen Labs" and usher in a sustainable and innovative age. By taking the initiative to create a high-level vision of the Future of Labs-those that are connected, inventive, and more sustainable-Merck, as a worldwide leader, is setting the standard for the sector.
9. What pricing options are available for accessing the report?
Pricing options include single-user, multi-user, and enterprise licenses priced at USD 4750, USD 5250, and USD 8750 respectively.
10. Is the market size provided in terms of value or volume?
The market size is provided in terms of value, measured in Million.
11. Are there any specific market keywords associated with the report?
Yes, the market keyword associated with the report is "Air Quality Monitoring Software Market," which aids in identifying and referencing the specific market segment covered.
12. How do I determine which pricing option suits my needs best?
The pricing options vary based on user requirements and access needs. Individual users may opt for single-user licenses, while businesses requiring broader access may choose multi-user or enterprise licenses for cost-effective access to the report.
13. Are there any additional resources or data provided in the Air Quality Monitoring Software Market report?
While the report offers comprehensive insights, it's advisable to review the specific contents or supplementary materials provided to ascertain if additional resources or data are available.
14. How can I stay updated on further developments or reports in the Air Quality Monitoring Software Market?
To stay informed about further developments, trends, and reports in the Air Quality Monitoring Software Market, consider subscribing to industry newsletters, following relevant companies and organizations, or regularly checking reputable industry news sources and publications.
Methodology
Step 1 - Identification of Relevant Samples Size from Population Database


Step 2 - Approaches for Defining Global Market Size (Value, Volume* & Price*)

Note*: In applicable scenarios
Step 3 - Data Sources
Primary Research
- Web Analytics
- Survey Reports
- Research Institute
- Latest Research Reports
- Opinion Leaders
Secondary Research
- Annual Reports
- White Paper
- Latest Press Release
- Industry Association
- Paid Database
- Investor Presentations

Step 4 - Data Triangulation
Involves using different sources of information in order to increase the validity of a study
These sources are likely to be stakeholders in a program - participants, other researchers, program staff, other community members, and so on.
Then we put all data in single framework & apply various statistical tools to find out the dynamic on the market.
During the analysis stage, feedback from the stakeholder groups would be compared to determine areas of agreement as well as areas of divergence
