

Key Insights
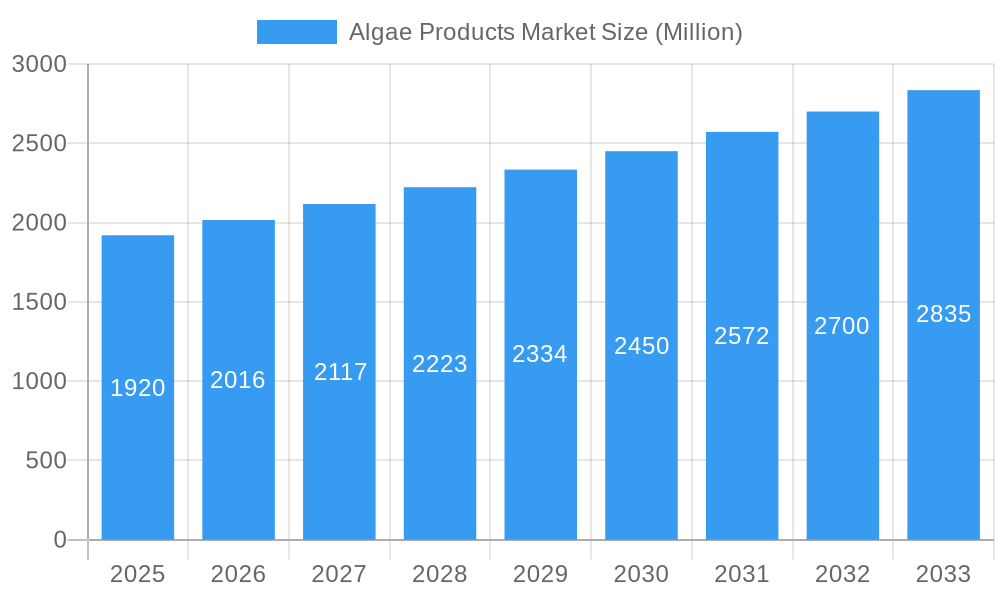
The global algae products market is poised for substantial growth, projected to reach a value of $1.92 billion with a Compound Annual Growth Rate (CAGR) of 4.99% from 2019 to 2033. This expansion is fueled by an increasing demand for sustainable and nutrient-rich ingredients across diverse industries. Key drivers include the rising consumer consciousness towards health and wellness, leading to a surge in demand for algal proteins, omega-3 fatty acids (lipids), and carotenoids in dietary supplements and functional foods. The food and beverage sector is actively incorporating algae for its nutritional benefits and as a natural coloring agent. Furthermore, the personal care industry is leveraging algae's antioxidant and moisturizing properties in skincare and haircare formulations. The pharmaceutical sector also shows promise, exploring algae's potential in drug delivery and the development of novel therapeutics. The market's robust growth trajectory is further supported by ongoing research and development efforts to unlock new applications and improve extraction efficiencies, alongside a growing emphasis on bio-based and eco-friendly alternatives to conventional products.
Algae Products Market Market Size (In Billion)
The market is segmented into various algae sources, including brown, red, green, and blue-green algae, each offering a unique profile of valuable compounds. Product types such as alginate, carrageenan, algal protein, carotenoids, and lipids are gaining traction. The strategic importance of regions like Asia Pacific, driven by its large population and increasing disposable income, coupled with the established markets in North America and Europe, will shape the future landscape of the algae products market. However, challenges such as fluctuating raw material availability, stringent regulatory frameworks in certain regions, and the need for scalable and cost-effective cultivation and processing technologies need to be addressed to fully realize the market's potential. Innovations in microalgae cultivation and downstream processing are expected to mitigate these restraints, paving the way for wider adoption and market expansion.
Algae Products Market Company Market Share
This in-depth report offers a detailed examination of the global Algae Products Market, providing critical insights into market dynamics, growth trends, regional dominance, product landscape, key drivers, barriers, opportunities, and the competitive strategies of leading industry players. Covering a study period from 2019 to 2033, with a base year of 2025, this analysis is essential for stakeholders seeking to navigate and capitalize on the burgeoning algae sector. The market encompasses a wide array of parent and child markets, driven by diverse applications in personal care, food and beverage, dietary supplements, pharmaceuticals, and animal feed.
Algae Products Market Market Dynamics & Structure
The Algae Products Market exhibits a dynamic and evolving structure characterized by increasing market concentration driven by strategic mergers and acquisitions. Technological innovation remains a primary driver, with advancements in cultivation, harvesting, and extraction techniques continually enhancing product quality and cost-effectiveness. Regulatory frameworks, while evolving, are largely supportive of sustainable ingredient sourcing, influencing product development and market entry. Competitive product substitutes, such as plant-based alternatives, present a moderating influence, necessitating a focus on the unique benefits of algal derivatives. End-user demographics are shifting towards a greater demand for sustainable, health-conscious, and natural ingredients, particularly among millennials and Gen Z.
- Market Concentration: Growing consolidation observed through M&A activities.
- Technological Innovation: Key focus on improving extraction yields and product purity.
- Regulatory Frameworks: Supportive policies for sustainable sourcing and novel food applications.
- Competitive Substitutes: Plant-based alternatives necessitate differentiation through superior functional benefits and sustainability credentials.
- End-User Demographics: Increasing demand for clean label, sustainable, and nutrient-rich products.
- M&A Trends: Strategic acquisitions aimed at expanding product portfolios and market reach.
- Innovation Barriers: High initial investment costs for advanced cultivation systems and scaling up production.
Algae Products Market Growth Trends & Insights
The Algae Products Market is projected for substantial growth, fueled by increasing consumer awareness of health benefits and environmental sustainability. The market size evolution is expected to be robust, with significant adoption rates across various applications. Technological disruptions, including advancements in genetic engineering of algae for enhanced nutrient profiles and more efficient cultivation methods, are poised to reshape the industry. Consumer behavior shifts towards natural and ethically sourced ingredients are directly contributing to the rise of algal products as a preferred alternative. The market penetration of specialized algae-derived compounds, such as omega-3 fatty acids and high-protein ingredients, is expected to expand significantly in the forecast period.
- Market Size Evolution: Expected to witness a strong Compound Annual Growth Rate (CAGR) driven by diversified applications.
- Adoption Rates: Increasing adoption in food & beverage fortification, animal feed, and dietary supplements.
- Technological Disruptions: Innovations in photobioreactor designs and downstream processing are key.
- Consumer Behavior Shifts: Growing preference for plant-based, sustainable, and functional foods.
- Market Penetration: Expansion into mainstream consumer products and pharmaceutical applications.
- Sustainability Focus: Algae's low resource footprint is a key differentiator.
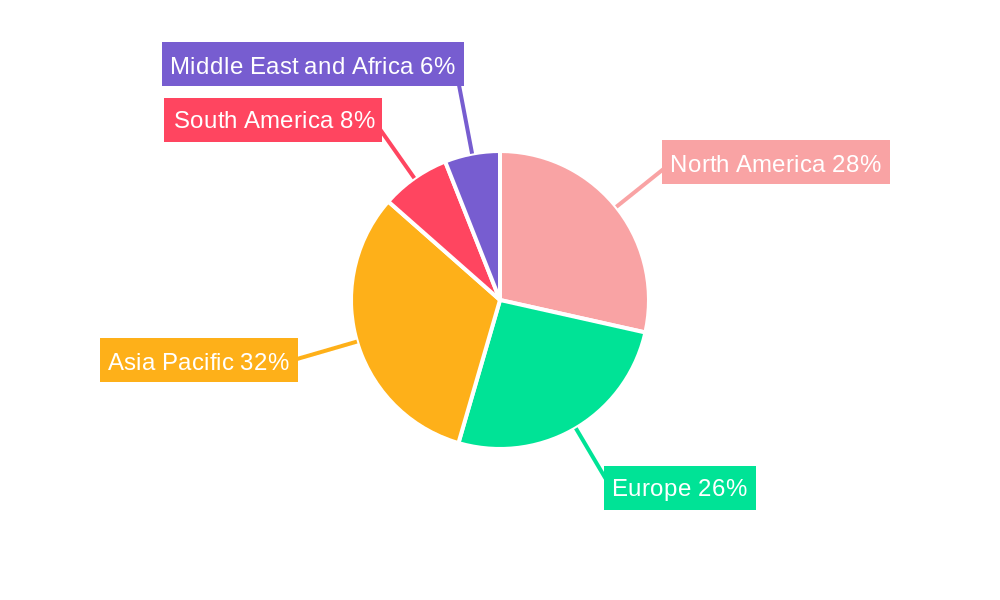
Dominant Regions, Countries, or Segments in Algae Products Market
The global Algae Products Market is experiencing robust growth, with specific regions and segments leading the expansion. North America and Europe currently dominate due to established dietary supplement and functional food markets, coupled with strong consumer demand for sustainable products. Asia Pacific is emerging as a key growth region, driven by rapid industrialization, growing populations, and increasing disposable incomes, leading to higher demand for diverse applications.
Among the segments, Green Algae stands out as a dominant source, widely utilized for its rich nutritional profile, including proteins, vitamins, and antioxidants, making it a key ingredient in dietary supplements and functional foods. Within product types, Lipids, particularly omega-3 fatty acids (EPA and DHA), are experiencing significant traction due to their well-documented health benefits, driving demand in the nutraceutical and pharmaceutical sectors. Algal Protein is also gaining immense popularity as a sustainable and complete protein source, catering to the growing plant-based food trend. In terms of applications, Dietary Supplements represent a major segment, leveraging the health-promoting properties of algae. The Food and Beverage sector is also a significant contributor, incorporating algae for fortification and as a functional ingredient.
- Dominant Regions: North America and Europe lead in market share, with Asia Pacific showing the highest growth potential.
- Leading Source: Green Algae is paramount due to its versatile nutritional composition.
- Key Product Type: Lipids (Omega-3s) and Algal Protein are driving significant market value.
- Primary Application: Dietary Supplements and Food & Beverage sectors are major growth drivers.
- Growth Potential: Emerging economies are expected to contribute substantially to future market expansion.
- Economic Policies: Government initiatives supporting sustainable agriculture and biotechnology boost market growth.
Algae Products Market Product Landscape
The Algae Products Market is characterized by a diverse and innovative product landscape. Innovations focus on high-value compounds such as specialized carotenoids for cosmetics and supplements, purified algal proteins for plant-based food alternatives, and concentrated omega-3 lipids for infant nutrition and cardiovascular health. Performance metrics are increasingly scrutinized for bioavailability, purity, and sustainability of sourcing. Unique selling propositions often revolve around allergen-free profiles, superior nutrient density, and a lower environmental footprint compared to traditional alternatives. Technological advancements in extraction and purification are unlocking new applications and improving the efficacy of existing ones.
Key Drivers, Barriers & Challenges in Algae Products Market
The Algae Products Market is propelled by several key drivers, including a growing global demand for sustainable and natural ingredients, increasing consumer health consciousness, and significant advancements in biotechnological processes for algae cultivation and extraction. The recognized nutritional benefits of algae, such as omega-3 fatty acids and proteins, further fuel its market expansion. Moreover, government initiatives supporting the blue economy and renewable resources contribute positively to market growth.
However, the market faces several barriers and challenges. High initial investment costs for large-scale cultivation facilities and sophisticated processing equipment remain a significant hurdle. Regulatory complexities and the need for comprehensive safety approvals for novel algae-based products can slow down market penetration. Competition from established and often cheaper ingredients, such as fish oil for omega-3s, presents a continuous challenge. Furthermore, fluctuations in raw material availability due to environmental factors and the need for consistent quality control across diverse algal strains can impact supply chains. The scalability of certain niche algae products also poses a challenge.
Emerging Opportunities in Algae Products Market
Emerging opportunities in the Algae Products Market are abundant, driven by evolving consumer preferences and technological innovations. The burgeoning plant-based protein market presents a significant avenue for algal protein, offering a complete amino acid profile. Advancements in cosmetic applications, leveraging algae's antioxidant and anti-inflammatory properties, are creating new product lines in skincare. Furthermore, the potential for algae in the production of biofuels and bioplastics represents a significant, albeit longer-term, opportunity for diversification and sustainability. The development of specialized algal strains for targeted pharmaceutical applications, such as anti-viral or anti-cancer compounds, also holds immense promise.
Growth Accelerators in the Algae Products Market Industry
Growth accelerators in the Algae Products Market industry are primarily technological breakthroughs and strategic market expansion initiatives. Innovations in strain selection and genetic engineering are enabling the production of algae with higher yields of specific valuable compounds. The development of more efficient and cost-effective cultivation systems, such as advanced photobioreactors and sustainable open-pond systems, is crucial for scaling up production. Strategic partnerships between algae producers, food and beverage companies, and supplement manufacturers are fostering wider product integration and consumer access. Increased investment in research and development, coupled with supportive government policies and rising consumer demand for sustainable alternatives, are collectively accelerating the market's trajectory.
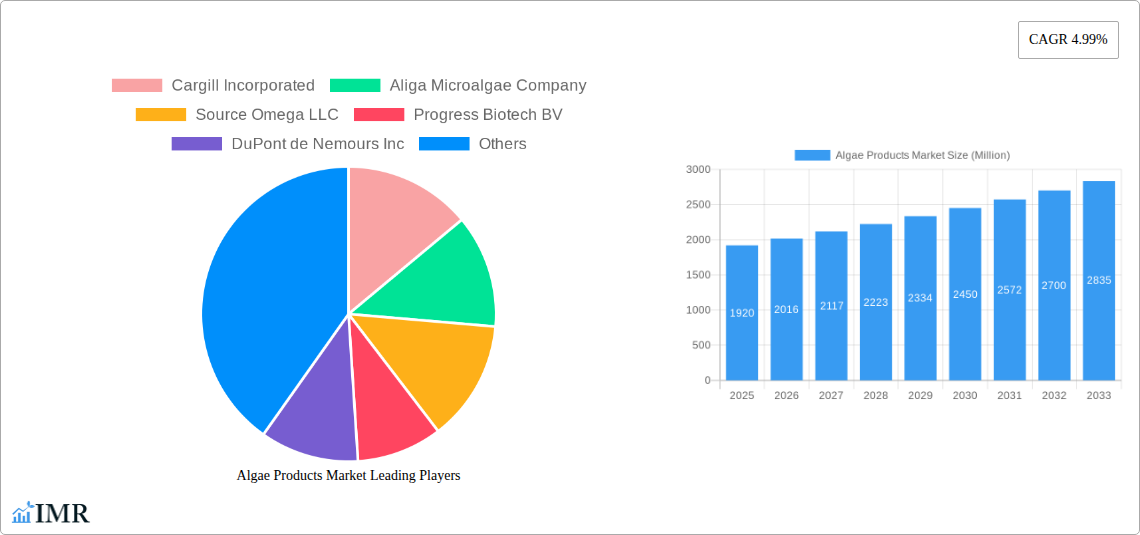
Key Players Shaping the Algae Products Market Market
- Cargill Incorporated
- Aliga Microalgae Company
- Source Omega LLC
- Progress Biotech BV
- DuPont de Nemours Inc
- Archer Daniels Midland Company
- BASF SE
- Koninklijke DSM N V
- Algenol Biotech LLC
- Yemoja Ltd
- ACCEL Carrageenan Corporation
Notable Milestones in Algae Products Market Sector
- September 2022: Aliga Microalgae (Aliga) acquired a large chlorella algae facility in the Netherlands, aiming to commercialize its chlorella algae products using modern production methods.
- April 2022: Koninklijke DSM N.V. expanded its 'life' range of algal-sourced omega-3 products with two line extensions (life's OMEGA and life's DHA), offering a sustainable alternative to fish oil with high potency and quality, featuring life's OMEGA O1030DS as their most effective algal omega-3 form.
- September 2021: AAK announced a strategic partnership with Progress Biotech to supply high-quality, algae-based DHA for infant formula.
In-Depth Algae Products Market Market Outlook
The future outlook for the Algae Products Market is exceptionally promising, driven by a confluence of accelerating factors. Continued technological advancements in cultivation and extraction techniques will lower production costs and improve product quality, making algae-derived ingredients more competitive. The growing demand for sustainable and plant-based solutions across food, health, and personal care sectors will continue to fuel market expansion. Strategic investments in research and development, coupled with increasing government support for bio-based industries, will unlock new applications and markets. Key players are likely to focus on vertical integration and strategic alliances to secure supply chains and expand their global reach, further solidifying the market's growth trajectory in the coming years.
Algae Products Market Segmentation
-
1. Source
- 1.1. Brown Algae
- 1.2. Red Algae
- 1.3. Green Algae
- 1.4. Blue-green Algae
-
2. Product Type
- 2.1. Algal Protein
- 2.2. Alginate
- 2.3. Carrageenan
- 2.4. Carotenoids
- 2.5. Lipids
- 2.6. Other Product Types
-
3. Application
- 3.1. Personal Care
- 3.2. Food and Beverage
- 3.3. Dietary Supplements
- 3.4. Pharmaceuticals
- 3.5. Animal Feed
- 3.6. Other Applications
Algae Products Market Segmentation By Geography
-
1. North America
- 1.1. United States
- 1.2. Canada
- 1.3. Mexico
- 1.4. Rest of North America
-
2. Europe
- 2.1. Spain
- 2.2. United Kingdom
- 2.3. Germany
- 2.4. France
- 2.5. Italy
- 2.6. Russia
- 2.7. Rest of Europe
-
3. Asia Pacific
- 3.1. China
- 3.2. Japan
- 3.3. India
- 3.4. Australia
- 3.5. Rest of Asia Pacific
-
4. South America
- 4.1. Brazil
- 4.2. Argentina
- 4.3. Rest of South America
-
5. Middle East and Africa
- 5.1. South Africa
- 5.2. United Arab Emirates
- 5.3. Rest of Middle East and Africa
Algae Products Market Regional Market Share
Geographic Coverage of Algae Products Market
Algae Products Market REPORT HIGHLIGHTS
| Aspects | Details |
|---|---|
| Study Period | 2020-2034 |
| Base Year | 2025 |
| Estimated Year | 2026 |
| Forecast Period | 2026-2034 |
| Historical Period | 2020-2025 |
| Growth Rate | CAGR of 4.99% from 2020-2034 |
| Segmentation |
|
Table of Contents
- 1. Introduction
- 1.1. Research Scope
- 1.2. Market Segmentation
- 1.3. Research Objective
- 1.4. Definitions and Assumptions
- 2. Executive Summary
- 2.1. Market Snapshot
- 3. Market Dynamics
- 3.1. Market Drivers
- 3.2. Market Restrains
- 3.3. Market Trends
- 3.4. Market Opportunities
- 4. Market Factor Analysis
- 4.1. Porters Five Forces
- 4.1.1. Bargaining Power of Suppliers
- 4.1.2. Bargaining Power of Buyers
- 4.1.3. Threat of New Entrants
- 4.1.4. Threat of Substitutes
- 4.1.5. Competitive Rivalry
- 4.2. PESTEL analysis
- 4.3. BCG Analysis
- 4.3.1. Stars (High Growth, High Market Share)
- 4.3.2. Cash Cows (Low Growth, High Market Share)
- 4.3.3. Question Mark (High Growth, Low Market Share)
- 4.3.4. Dogs (Low Growth, Low Market Share)
- 4.4. Ansoff Matrix Analysis
- 4.5. Supply Chain Analysis
- 4.6. Regulatory Landscape
- 4.7. Current Market Potential and Opportunity Assessment (TAM–SAM–SOM Framework)
- 4.8. IMR Analyst Note
- 4.1. Porters Five Forces
- 5. Market Analysis, Insights and Forecast 2021-2033
- 5.1. Market Analysis, Insights and Forecast - by Source
- 5.1.1. Brown Algae
- 5.1.2. Red Algae
- 5.1.3. Green Algae
- 5.1.4. Blue-green Algae
- 5.2. Market Analysis, Insights and Forecast - by Product Type
- 5.2.1. Algal Protein
- 5.2.2. Alginate
- 5.2.3. Carrageenan
- 5.2.4. Carotenoids
- 5.2.5. Lipids
- 5.2.6. Other Product Types
- 5.3. Market Analysis, Insights and Forecast - by Application
- 5.3.1. Personal Care
- 5.3.2. Food and Beverage
- 5.3.3. Dietary Supplements
- 5.3.4. Pharmaceuticals
- 5.3.5. Animal Feed
- 5.3.6. Other Applications
- 5.4. Market Analysis, Insights and Forecast - by Region
- 5.4.1. North America
- 5.4.2. Europe
- 5.4.3. Asia Pacific
- 5.4.4. South America
- 5.4.5. Middle East and Africa
- 5.1. Market Analysis, Insights and Forecast - by Source
- 6. Global Algae Products Market Analysis, Insights and Forecast, 2021-2033
- 6.1. Market Analysis, Insights and Forecast - by Source
- 6.1.1. Brown Algae
- 6.1.2. Red Algae
- 6.1.3. Green Algae
- 6.1.4. Blue-green Algae
- 6.2. Market Analysis, Insights and Forecast - by Product Type
- 6.2.1. Algal Protein
- 6.2.2. Alginate
- 6.2.3. Carrageenan
- 6.2.4. Carotenoids
- 6.2.5. Lipids
- 6.2.6. Other Product Types
- 6.3. Market Analysis, Insights and Forecast - by Application
- 6.3.1. Personal Care
- 6.3.2. Food and Beverage
- 6.3.3. Dietary Supplements
- 6.3.4. Pharmaceuticals
- 6.3.5. Animal Feed
- 6.3.6. Other Applications
- 6.1. Market Analysis, Insights and Forecast - by Source
- 7. North America Algae Products Market Analysis, Insights and Forecast, 2020-2032
- 7.1. Market Analysis, Insights and Forecast - by Source
- 7.1.1. Brown Algae
- 7.1.2. Red Algae
- 7.1.3. Green Algae
- 7.1.4. Blue-green Algae
- 7.2. Market Analysis, Insights and Forecast - by Product Type
- 7.2.1. Algal Protein
- 7.2.2. Alginate
- 7.2.3. Carrageenan
- 7.2.4. Carotenoids
- 7.2.5. Lipids
- 7.2.6. Other Product Types
- 7.3. Market Analysis, Insights and Forecast - by Application
- 7.3.1. Personal Care
- 7.3.2. Food and Beverage
- 7.3.3. Dietary Supplements
- 7.3.4. Pharmaceuticals
- 7.3.5. Animal Feed
- 7.3.6. Other Applications
- 7.1. Market Analysis, Insights and Forecast - by Source
- 8. Europe Algae Products Market Analysis, Insights and Forecast, 2020-2032
- 8.1. Market Analysis, Insights and Forecast - by Source
- 8.1.1. Brown Algae
- 8.1.2. Red Algae
- 8.1.3. Green Algae
- 8.1.4. Blue-green Algae
- 8.2. Market Analysis, Insights and Forecast - by Product Type
- 8.2.1. Algal Protein
- 8.2.2. Alginate
- 8.2.3. Carrageenan
- 8.2.4. Carotenoids
- 8.2.5. Lipids
- 8.2.6. Other Product Types
- 8.3. Market Analysis, Insights and Forecast - by Application
- 8.3.1. Personal Care
- 8.3.2. Food and Beverage
- 8.3.3. Dietary Supplements
- 8.3.4. Pharmaceuticals
- 8.3.5. Animal Feed
- 8.3.6. Other Applications
- 8.1. Market Analysis, Insights and Forecast - by Source
- 9. Asia Pacific Algae Products Market Analysis, Insights and Forecast, 2020-2032
- 9.1. Market Analysis, Insights and Forecast - by Source
- 9.1.1. Brown Algae
- 9.1.2. Red Algae
- 9.1.3. Green Algae
- 9.1.4. Blue-green Algae
- 9.2. Market Analysis, Insights and Forecast - by Product Type
- 9.2.1. Algal Protein
- 9.2.2. Alginate
- 9.2.3. Carrageenan
- 9.2.4. Carotenoids
- 9.2.5. Lipids
- 9.2.6. Other Product Types
- 9.3. Market Analysis, Insights and Forecast - by Application
- 9.3.1. Personal Care
- 9.3.2. Food and Beverage
- 9.3.3. Dietary Supplements
- 9.3.4. Pharmaceuticals
- 9.3.5. Animal Feed
- 9.3.6. Other Applications
- 9.1. Market Analysis, Insights and Forecast - by Source
- 10. South America Algae Products Market Analysis, Insights and Forecast, 2020-2032
- 10.1. Market Analysis, Insights and Forecast - by Source
- 10.1.1. Brown Algae
- 10.1.2. Red Algae
- 10.1.3. Green Algae
- 10.1.4. Blue-green Algae
- 10.2. Market Analysis, Insights and Forecast - by Product Type
- 10.2.1. Algal Protein
- 10.2.2. Alginate
- 10.2.3. Carrageenan
- 10.2.4. Carotenoids
- 10.2.5. Lipids
- 10.2.6. Other Product Types
- 10.3. Market Analysis, Insights and Forecast - by Application
- 10.3.1. Personal Care
- 10.3.2. Food and Beverage
- 10.3.3. Dietary Supplements
- 10.3.4. Pharmaceuticals
- 10.3.5. Animal Feed
- 10.3.6. Other Applications
- 10.1. Market Analysis, Insights and Forecast - by Source
- 11. Middle East and Africa Algae Products Market Analysis, Insights and Forecast, 2020-2032
- 11.1. Market Analysis, Insights and Forecast - by Source
- 11.1.1. Brown Algae
- 11.1.2. Red Algae
- 11.1.3. Green Algae
- 11.1.4. Blue-green Algae
- 11.2. Market Analysis, Insights and Forecast - by Product Type
- 11.2.1. Algal Protein
- 11.2.2. Alginate
- 11.2.3. Carrageenan
- 11.2.4. Carotenoids
- 11.2.5. Lipids
- 11.2.6. Other Product Types
- 11.3. Market Analysis, Insights and Forecast - by Application
- 11.3.1. Personal Care
- 11.3.2. Food and Beverage
- 11.3.3. Dietary Supplements
- 11.3.4. Pharmaceuticals
- 11.3.5. Animal Feed
- 11.3.6. Other Applications
- 11.1. Market Analysis, Insights and Forecast - by Source
- 12. Competitive Analysis
- 12.1. Company Profiles
- 12.1.1 Cargill Incorporated
- 12.1.1.1. Company Overview
- 12.1.1.2. Products
- 12.1.1.3. Company Financials
- 12.1.1.4. SWOT Analysis
- 12.1.2 Aliga Microalgae Company
- 12.1.2.1. Company Overview
- 12.1.2.2. Products
- 12.1.2.3. Company Financials
- 12.1.2.4. SWOT Analysis
- 12.1.3 Source Omega LLC
- 12.1.3.1. Company Overview
- 12.1.3.2. Products
- 12.1.3.3. Company Financials
- 12.1.3.4. SWOT Analysis
- 12.1.4 Progress Biotech BV
- 12.1.4.1. Company Overview
- 12.1.4.2. Products
- 12.1.4.3. Company Financials
- 12.1.4.4. SWOT Analysis
- 12.1.5 DuPont de Nemours Inc
- 12.1.5.1. Company Overview
- 12.1.5.2. Products
- 12.1.5.3. Company Financials
- 12.1.5.4. SWOT Analysis
- 12.1.6 Archer Daniels Midland Company
- 12.1.6.1. Company Overview
- 12.1.6.2. Products
- 12.1.6.3. Company Financials
- 12.1.6.4. SWOT Analysis
- 12.1.7 BASF SE
- 12.1.7.1. Company Overview
- 12.1.7.2. Products
- 12.1.7.3. Company Financials
- 12.1.7.4. SWOT Analysis
- 12.1.8 Koninklijke DSM N V
- 12.1.8.1. Company Overview
- 12.1.8.2. Products
- 12.1.8.3. Company Financials
- 12.1.8.4. SWOT Analysis
- 12.1.9 Algenol Biotech LLC*List Not Exhaustive
- 12.1.9.1. Company Overview
- 12.1.9.2. Products
- 12.1.9.3. Company Financials
- 12.1.9.4. SWOT Analysis
- 12.1.10 Yemoja Ltd
- 12.1.10.1. Company Overview
- 12.1.10.2. Products
- 12.1.10.3. Company Financials
- 12.1.10.4. SWOT Analysis
- 12.1.11 ACCEL Carrageenan Corporation
- 12.1.11.1. Company Overview
- 12.1.11.2. Products
- 12.1.11.3. Company Financials
- 12.1.11.4. SWOT Analysis
- 12.1.1 Cargill Incorporated
- 12.2. Market Entropy
- 12.2.1 Company's Key Areas Served
- 12.2.2 Recent Developments
- 12.3. Company Market Share Analysis 2025
- 12.3.1 Top 5 Companies Market Share Analysis
- 12.3.2 Top 3 Companies Market Share Analysis
- 12.4. List of Potential Customers
- 13. Research Methodology
List of Figures
- Figure 1: Global Algae Products Market Revenue Breakdown (Million, %) by Region 2025 & 2033
- Figure 2: Global Algae Products Market Volume Breakdown (k Tons, %) by Region 2025 & 2033
- Figure 3: North America Algae Products Market Revenue (Million), by Source 2025 & 2033
- Figure 4: North America Algae Products Market Volume (k Tons), by Source 2025 & 2033
- Figure 5: North America Algae Products Market Revenue Share (%), by Source 2025 & 2033
- Figure 6: North America Algae Products Market Volume Share (%), by Source 2025 & 2033
- Figure 7: North America Algae Products Market Revenue (Million), by Product Type 2025 & 2033
- Figure 8: North America Algae Products Market Volume (k Tons), by Product Type 2025 & 2033
- Figure 9: North America Algae Products Market Revenue Share (%), by Product Type 2025 & 2033
- Figure 10: North America Algae Products Market Volume Share (%), by Product Type 2025 & 2033
- Figure 11: North America Algae Products Market Revenue (Million), by Application 2025 & 2033
- Figure 12: North America Algae Products Market Volume (k Tons), by Application 2025 & 2033
- Figure 13: North America Algae Products Market Revenue Share (%), by Application 2025 & 2033
- Figure 14: North America Algae Products Market Volume Share (%), by Application 2025 & 2033
- Figure 15: North America Algae Products Market Revenue (Million), by Country 2025 & 2033
- Figure 16: North America Algae Products Market Volume (k Tons), by Country 2025 & 2033
- Figure 17: North America Algae Products Market Revenue Share (%), by Country 2025 & 2033
- Figure 18: North America Algae Products Market Volume Share (%), by Country 2025 & 2033
- Figure 19: Europe Algae Products Market Revenue (Million), by Source 2025 & 2033
- Figure 20: Europe Algae Products Market Volume (k Tons), by Source 2025 & 2033
- Figure 21: Europe Algae Products Market Revenue Share (%), by Source 2025 & 2033
- Figure 22: Europe Algae Products Market Volume Share (%), by Source 2025 & 2033
- Figure 23: Europe Algae Products Market Revenue (Million), by Product Type 2025 & 2033
- Figure 24: Europe Algae Products Market Volume (k Tons), by Product Type 2025 & 2033
- Figure 25: Europe Algae Products Market Revenue Share (%), by Product Type 2025 & 2033
- Figure 26: Europe Algae Products Market Volume Share (%), by Product Type 2025 & 2033
- Figure 27: Europe Algae Products Market Revenue (Million), by Application 2025 & 2033
- Figure 28: Europe Algae Products Market Volume (k Tons), by Application 2025 & 2033
- Figure 29: Europe Algae Products Market Revenue Share (%), by Application 2025 & 2033
- Figure 30: Europe Algae Products Market Volume Share (%), by Application 2025 & 2033
- Figure 31: Europe Algae Products Market Revenue (Million), by Country 2025 & 2033
- Figure 32: Europe Algae Products Market Volume (k Tons), by Country 2025 & 2033
- Figure 33: Europe Algae Products Market Revenue Share (%), by Country 2025 & 2033
- Figure 34: Europe Algae Products Market Volume Share (%), by Country 2025 & 2033
- Figure 35: Asia Pacific Algae Products Market Revenue (Million), by Source 2025 & 2033
- Figure 36: Asia Pacific Algae Products Market Volume (k Tons), by Source 2025 & 2033
- Figure 37: Asia Pacific Algae Products Market Revenue Share (%), by Source 2025 & 2033
- Figure 38: Asia Pacific Algae Products Market Volume Share (%), by Source 2025 & 2033
- Figure 39: Asia Pacific Algae Products Market Revenue (Million), by Product Type 2025 & 2033
- Figure 40: Asia Pacific Algae Products Market Volume (k Tons), by Product Type 2025 & 2033
- Figure 41: Asia Pacific Algae Products Market Revenue Share (%), by Product Type 2025 & 2033
- Figure 42: Asia Pacific Algae Products Market Volume Share (%), by Product Type 2025 & 2033
- Figure 43: Asia Pacific Algae Products Market Revenue (Million), by Application 2025 & 2033
- Figure 44: Asia Pacific Algae Products Market Volume (k Tons), by Application 2025 & 2033
- Figure 45: Asia Pacific Algae Products Market Revenue Share (%), by Application 2025 & 2033
- Figure 46: Asia Pacific Algae Products Market Volume Share (%), by Application 2025 & 2033
- Figure 47: Asia Pacific Algae Products Market Revenue (Million), by Country 2025 & 2033
- Figure 48: Asia Pacific Algae Products Market Volume (k Tons), by Country 2025 & 2033
- Figure 49: Asia Pacific Algae Products Market Revenue Share (%), by Country 2025 & 2033
- Figure 50: Asia Pacific Algae Products Market Volume Share (%), by Country 2025 & 2033
- Figure 51: South America Algae Products Market Revenue (Million), by Source 2025 & 2033
- Figure 52: South America Algae Products Market Volume (k Tons), by Source 2025 & 2033
- Figure 53: South America Algae Products Market Revenue Share (%), by Source 2025 & 2033
- Figure 54: South America Algae Products Market Volume Share (%), by Source 2025 & 2033
- Figure 55: South America Algae Products Market Revenue (Million), by Product Type 2025 & 2033
- Figure 56: South America Algae Products Market Volume (k Tons), by Product Type 2025 & 2033
- Figure 57: South America Algae Products Market Revenue Share (%), by Product Type 2025 & 2033
- Figure 58: South America Algae Products Market Volume Share (%), by Product Type 2025 & 2033
- Figure 59: South America Algae Products Market Revenue (Million), by Application 2025 & 2033
- Figure 60: South America Algae Products Market Volume (k Tons), by Application 2025 & 2033
- Figure 61: South America Algae Products Market Revenue Share (%), by Application 2025 & 2033
- Figure 62: South America Algae Products Market Volume Share (%), by Application 2025 & 2033
- Figure 63: South America Algae Products Market Revenue (Million), by Country 2025 & 2033
- Figure 64: South America Algae Products Market Volume (k Tons), by Country 2025 & 2033
- Figure 65: South America Algae Products Market Revenue Share (%), by Country 2025 & 2033
- Figure 66: South America Algae Products Market Volume Share (%), by Country 2025 & 2033
- Figure 67: Middle East and Africa Algae Products Market Revenue (Million), by Source 2025 & 2033
- Figure 68: Middle East and Africa Algae Products Market Volume (k Tons), by Source 2025 & 2033
- Figure 69: Middle East and Africa Algae Products Market Revenue Share (%), by Source 2025 & 2033
- Figure 70: Middle East and Africa Algae Products Market Volume Share (%), by Source 2025 & 2033
- Figure 71: Middle East and Africa Algae Products Market Revenue (Million), by Product Type 2025 & 2033
- Figure 72: Middle East and Africa Algae Products Market Volume (k Tons), by Product Type 2025 & 2033
- Figure 73: Middle East and Africa Algae Products Market Revenue Share (%), by Product Type 2025 & 2033
- Figure 74: Middle East and Africa Algae Products Market Volume Share (%), by Product Type 2025 & 2033
- Figure 75: Middle East and Africa Algae Products Market Revenue (Million), by Application 2025 & 2033
- Figure 76: Middle East and Africa Algae Products Market Volume (k Tons), by Application 2025 & 2033
- Figure 77: Middle East and Africa Algae Products Market Revenue Share (%), by Application 2025 & 2033
- Figure 78: Middle East and Africa Algae Products Market Volume Share (%), by Application 2025 & 2033
- Figure 79: Middle East and Africa Algae Products Market Revenue (Million), by Country 2025 & 2033
- Figure 80: Middle East and Africa Algae Products Market Volume (k Tons), by Country 2025 & 2033
- Figure 81: Middle East and Africa Algae Products Market Revenue Share (%), by Country 2025 & 2033
- Figure 82: Middle East and Africa Algae Products Market Volume Share (%), by Country 2025 & 2033
List of Tables
- Table 1: Global Algae Products Market Revenue Million Forecast, by Source 2020 & 2033
- Table 2: Global Algae Products Market Volume k Tons Forecast, by Source 2020 & 2033
- Table 3: Global Algae Products Market Revenue Million Forecast, by Product Type 2020 & 2033
- Table 4: Global Algae Products Market Volume k Tons Forecast, by Product Type 2020 & 2033
- Table 5: Global Algae Products Market Revenue Million Forecast, by Application 2020 & 2033
- Table 6: Global Algae Products Market Volume k Tons Forecast, by Application 2020 & 2033
- Table 7: Global Algae Products Market Revenue Million Forecast, by Region 2020 & 2033
- Table 8: Global Algae Products Market Volume k Tons Forecast, by Region 2020 & 2033
- Table 9: Global Algae Products Market Revenue Million Forecast, by Source 2020 & 2033
- Table 10: Global Algae Products Market Volume k Tons Forecast, by Source 2020 & 2033
- Table 11: Global Algae Products Market Revenue Million Forecast, by Product Type 2020 & 2033
- Table 12: Global Algae Products Market Volume k Tons Forecast, by Product Type 2020 & 2033
- Table 13: Global Algae Products Market Revenue Million Forecast, by Application 2020 & 2033
- Table 14: Global Algae Products Market Volume k Tons Forecast, by Application 2020 & 2033
- Table 15: Global Algae Products Market Revenue Million Forecast, by Country 2020 & 2033
- Table 16: Global Algae Products Market Volume k Tons Forecast, by Country 2020 & 2033
- Table 17: United States Algae Products Market Revenue (Million) Forecast, by Application 2020 & 2033
- Table 18: United States Algae Products Market Volume (k Tons) Forecast, by Application 2020 & 2033
- Table 19: Canada Algae Products Market Revenue (Million) Forecast, by Application 2020 & 2033
- Table 20: Canada Algae Products Market Volume (k Tons) Forecast, by Application 2020 & 2033
- Table 21: Mexico Algae Products Market Revenue (Million) Forecast, by Application 2020 & 2033
- Table 22: Mexico Algae Products Market Volume (k Tons) Forecast, by Application 2020 & 2033
- Table 23: Rest of North America Algae Products Market Revenue (Million) Forecast, by Application 2020 & 2033
- Table 24: Rest of North America Algae Products Market Volume (k Tons) Forecast, by Application 2020 & 2033
- Table 25: Global Algae Products Market Revenue Million Forecast, by Source 2020 & 2033
- Table 26: Global Algae Products Market Volume k Tons Forecast, by Source 2020 & 2033
- Table 27: Global Algae Products Market Revenue Million Forecast, by Product Type 2020 & 2033
- Table 28: Global Algae Products Market Volume k Tons Forecast, by Product Type 2020 & 2033
- Table 29: Global Algae Products Market Revenue Million Forecast, by Application 2020 & 2033
- Table 30: Global Algae Products Market Volume k Tons Forecast, by Application 2020 & 2033
- Table 31: Global Algae Products Market Revenue Million Forecast, by Country 2020 & 2033
- Table 32: Global Algae Products Market Volume k Tons Forecast, by Country 2020 & 2033
- Table 33: Spain Algae Products Market Revenue (Million) Forecast, by Application 2020 & 2033
- Table 34: Spain Algae Products Market Volume (k Tons) Forecast, by Application 2020 & 2033
- Table 35: United Kingdom Algae Products Market Revenue (Million) Forecast, by Application 2020 & 2033
- Table 36: United Kingdom Algae Products Market Volume (k Tons) Forecast, by Application 2020 & 2033
- Table 37: Germany Algae Products Market Revenue (Million) Forecast, by Application 2020 & 2033
- Table 38: Germany Algae Products Market Volume (k Tons) Forecast, by Application 2020 & 2033
- Table 39: France Algae Products Market Revenue (Million) Forecast, by Application 2020 & 2033
- Table 40: France Algae Products Market Volume (k Tons) Forecast, by Application 2020 & 2033
- Table 41: Italy Algae Products Market Revenue (Million) Forecast, by Application 2020 & 2033
- Table 42: Italy Algae Products Market Volume (k Tons) Forecast, by Application 2020 & 2033
- Table 43: Russia Algae Products Market Revenue (Million) Forecast, by Application 2020 & 2033
- Table 44: Russia Algae Products Market Volume (k Tons) Forecast, by Application 2020 & 2033
- Table 45: Rest of Europe Algae Products Market Revenue (Million) Forecast, by Application 2020 & 2033
- Table 46: Rest of Europe Algae Products Market Volume (k Tons) Forecast, by Application 2020 & 2033
- Table 47: Global Algae Products Market Revenue Million Forecast, by Source 2020 & 2033
- Table 48: Global Algae Products Market Volume k Tons Forecast, by Source 2020 & 2033
- Table 49: Global Algae Products Market Revenue Million Forecast, by Product Type 2020 & 2033
- Table 50: Global Algae Products Market Volume k Tons Forecast, by Product Type 2020 & 2033
- Table 51: Global Algae Products Market Revenue Million Forecast, by Application 2020 & 2033
- Table 52: Global Algae Products Market Volume k Tons Forecast, by Application 2020 & 2033
- Table 53: Global Algae Products Market Revenue Million Forecast, by Country 2020 & 2033
- Table 54: Global Algae Products Market Volume k Tons Forecast, by Country 2020 & 2033
- Table 55: China Algae Products Market Revenue (Million) Forecast, by Application 2020 & 2033
- Table 56: China Algae Products Market Volume (k Tons) Forecast, by Application 2020 & 2033
- Table 57: Japan Algae Products Market Revenue (Million) Forecast, by Application 2020 & 2033
- Table 58: Japan Algae Products Market Volume (k Tons) Forecast, by Application 2020 & 2033
- Table 59: India Algae Products Market Revenue (Million) Forecast, by Application 2020 & 2033
- Table 60: India Algae Products Market Volume (k Tons) Forecast, by Application 2020 & 2033
- Table 61: Australia Algae Products Market Revenue (Million) Forecast, by Application 2020 & 2033
- Table 62: Australia Algae Products Market Volume (k Tons) Forecast, by Application 2020 & 2033
- Table 63: Rest of Asia Pacific Algae Products Market Revenue (Million) Forecast, by Application 2020 & 2033
- Table 64: Rest of Asia Pacific Algae Products Market Volume (k Tons) Forecast, by Application 2020 & 2033
- Table 65: Global Algae Products Market Revenue Million Forecast, by Source 2020 & 2033
- Table 66: Global Algae Products Market Volume k Tons Forecast, by Source 2020 & 2033
- Table 67: Global Algae Products Market Revenue Million Forecast, by Product Type 2020 & 2033
- Table 68: Global Algae Products Market Volume k Tons Forecast, by Product Type 2020 & 2033
- Table 69: Global Algae Products Market Revenue Million Forecast, by Application 2020 & 2033
- Table 70: Global Algae Products Market Volume k Tons Forecast, by Application 2020 & 2033
- Table 71: Global Algae Products Market Revenue Million Forecast, by Country 2020 & 2033
- Table 72: Global Algae Products Market Volume k Tons Forecast, by Country 2020 & 2033
- Table 73: Brazil Algae Products Market Revenue (Million) Forecast, by Application 2020 & 2033
- Table 74: Brazil Algae Products Market Volume (k Tons) Forecast, by Application 2020 & 2033
- Table 75: Argentina Algae Products Market Revenue (Million) Forecast, by Application 2020 & 2033
- Table 76: Argentina Algae Products Market Volume (k Tons) Forecast, by Application 2020 & 2033
- Table 77: Rest of South America Algae Products Market Revenue (Million) Forecast, by Application 2020 & 2033
- Table 78: Rest of South America Algae Products Market Volume (k Tons) Forecast, by Application 2020 & 2033
- Table 79: Global Algae Products Market Revenue Million Forecast, by Source 2020 & 2033
- Table 80: Global Algae Products Market Volume k Tons Forecast, by Source 2020 & 2033
- Table 81: Global Algae Products Market Revenue Million Forecast, by Product Type 2020 & 2033
- Table 82: Global Algae Products Market Volume k Tons Forecast, by Product Type 2020 & 2033
- Table 83: Global Algae Products Market Revenue Million Forecast, by Application 2020 & 2033
- Table 84: Global Algae Products Market Volume k Tons Forecast, by Application 2020 & 2033
- Table 85: Global Algae Products Market Revenue Million Forecast, by Country 2020 & 2033
- Table 86: Global Algae Products Market Volume k Tons Forecast, by Country 2020 & 2033
- Table 87: South Africa Algae Products Market Revenue (Million) Forecast, by Application 2020 & 2033
- Table 88: South Africa Algae Products Market Volume (k Tons) Forecast, by Application 2020 & 2033
- Table 89: United Arab Emirates Algae Products Market Revenue (Million) Forecast, by Application 2020 & 2033
- Table 90: United Arab Emirates Algae Products Market Volume (k Tons) Forecast, by Application 2020 & 2033
- Table 91: Rest of Middle East and Africa Algae Products Market Revenue (Million) Forecast, by Application 2020 & 2033
- Table 92: Rest of Middle East and Africa Algae Products Market Volume (k Tons) Forecast, by Application 2020 & 2033
Frequently Asked Questions
1. What is the projected Compound Annual Growth Rate (CAGR) of the Algae Products Market?
The projected CAGR is approximately 4.99%.
2. Which companies are prominent players in the Algae Products Market?
Key companies in the market include Cargill Incorporated, Aliga Microalgae Company, Source Omega LLC, Progress Biotech BV, DuPont de Nemours Inc, Archer Daniels Midland Company, BASF SE, Koninklijke DSM N V, Algenol Biotech LLC*List Not Exhaustive, Yemoja Ltd, ACCEL Carrageenan Corporation.
3. What are the main segments of the Algae Products Market?
The market segments include Source, Product Type, Application.
4. Can you provide details about the market size?
The market size is estimated to be USD 1.92 Million as of 2022.
5. What are some drivers contributing to market growth?
Increasing Demand for Processed Food Products; Technological Advancements Supporting Market Growth.
6. What are the notable trends driving market growth?
Health Benefits Associated With Algae Products' Consumption.
7. Are there any restraints impacting market growth?
Increasing Cost of Production Due to Rise in Energy and Labor Cost.
8. Can you provide examples of recent developments in the market?
In September 2022, in the Netherlands, the Danish company Aliga Microalgae (Aliga) acquired a large chlorella algae facility. The company plans to use a modern production facility to commercialize its chlorella algae products.
9. What pricing options are available for accessing the report?
Pricing options include single-user, multi-user, and enterprise licenses priced at USD 4750, USD 5250, and USD 8750 respectively.
10. Is the market size provided in terms of value or volume?
The market size is provided in terms of value, measured in Million and volume, measured in k Tons.
11. Are there any specific market keywords associated with the report?
Yes, the market keyword associated with the report is "Algae Products Market," which aids in identifying and referencing the specific market segment covered.
12. How do I determine which pricing option suits my needs best?
The pricing options vary based on user requirements and access needs. Individual users may opt for single-user licenses, while businesses requiring broader access may choose multi-user or enterprise licenses for cost-effective access to the report.
13. Are there any additional resources or data provided in the Algae Products Market report?
While the report offers comprehensive insights, it's advisable to review the specific contents or supplementary materials provided to ascertain if additional resources or data are available.
14. How can I stay updated on further developments or reports in the Algae Products Market?
To stay informed about further developments, trends, and reports in the Algae Products Market, consider subscribing to industry newsletters, following relevant companies and organizations, or regularly checking reputable industry news sources and publications.
Methodology
Step 1 - Identification of Relevant Samples Size from Population Database


Step 2 - Approaches for Defining Global Market Size (Value, Volume* & Price*)

Note*: In applicable scenarios
Step 3 - Data Sources
Primary Research
- Web Analytics
- Survey Reports
- Research Institute
- Latest Research Reports
- Opinion Leaders
Secondary Research
- Annual Reports
- White Paper
- Latest Press Release
- Industry Association
- Paid Database
- Investor Presentations

Step 4 - Data Triangulation
Involves using different sources of information in order to increase the validity of a study
These sources are likely to be stakeholders in a program - participants, other researchers, program staff, other community members, and so on.
Then we put all data in single framework & apply various statistical tools to find out the dynamic on the market.
During the analysis stage, feedback from the stakeholder groups would be compared to determine areas of agreement as well as areas of divergence