

Key Insights
The Middle East and Africa (MEA) canned seafood market is poised for robust growth, projected to reach $36.1 billion in 2025. This expansion is driven by increasing consumer preference for convenient and protein-rich food options, particularly in urbanizing regions. The market is expected to witness a CAGR of 3.5% from 2025 to 2033, reflecting sustained demand for affordable and accessible seafood. Key growth drivers include the rising disposable incomes across several MEA nations, leading to enhanced purchasing power for packaged foods. Furthermore, a growing awareness of the health benefits associated with seafood consumption, such as high omega-3 fatty acid content, is also contributing significantly to market penetration. The expanding retail infrastructure, with a greater presence of supermarkets and hypermarkets, alongside the burgeoning online retail sector, further facilitates consumer access to a diverse range of canned seafood products.
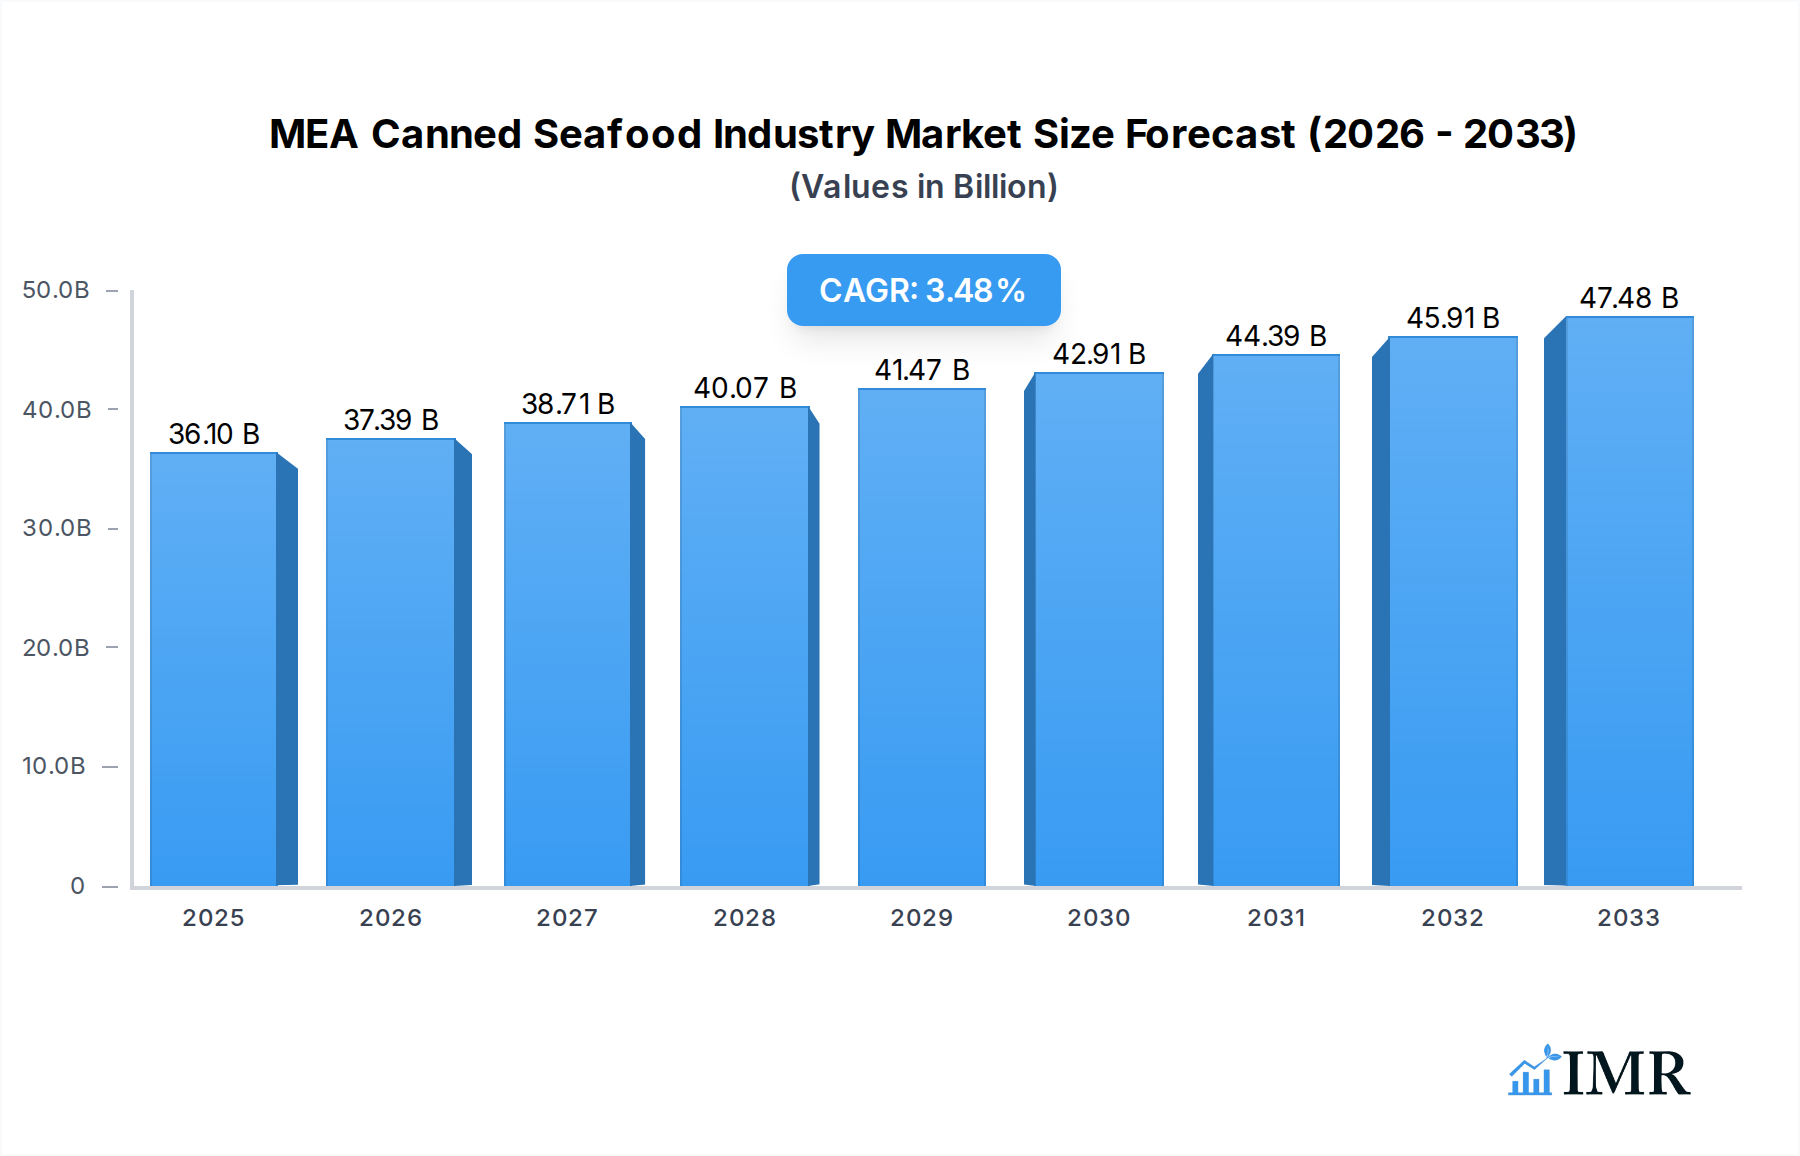
MEA Canned Seafood Industry Market Size (In Billion)
The market segmentation reveals a strong emphasis on canned fish, with tuna, salmon, and sardines leading the charge. However, canned shrimp and prawns are also gaining traction as consumers seek variety. The distribution landscape is dominated by supermarkets and hypermarkets, although online retailers are rapidly emerging as a significant channel, catering to the digitally-savvy population. Geographically, the United Arab Emirates and South Africa stand out as key markets, exhibiting substantial demand. The "Rest of the Middle East and Africa" region, while fragmented, presents considerable untapped potential. While opportunities abound, the market may face challenges related to fluctuating raw material prices and the need for stringent quality control to maintain consumer trust, especially with imported products. Nevertheless, the overall outlook for the MEA canned seafood industry remains highly positive, driven by fundamental shifts in consumer behavior and economic development.

MEA Canned Seafood Industry Company Market Share
MEA Canned Seafood Industry Report: Market Dynamics, Growth Trends, and Key Players
This comprehensive report offers an in-depth analysis of the Middle East and Africa (MEA) canned seafood market, providing critical insights into its structure, growth trajectory, and future potential. Spanning the study period of 2019-2033, with a base year of 2025, this report is an indispensable resource for industry stakeholders seeking to understand and capitalize on the evolving landscape of canned fish, canned tuna, canned salmon, canned sardines, canned mackerel, canned shrimp, and canned prawns. Explore dominant regions like the United Arab Emirates and South Africa, and distribution channels including supermarkets/hypermarkets, convenience stores, and online retailers.
MEA Canned Seafood Industry Market Dynamics & Structure
The MEA canned seafood industry is characterized by a moderate market concentration, with a few key players dominating the landscape. Technological innovation drivers are primarily focused on enhancing product shelf-life, improving nutritional profiles, and developing sustainable sourcing practices. Regulatory frameworks, while evolving, often center on food safety standards and import/export regulations. Competitive product substitutes include fresh and frozen seafood, as well as other protein sources, influencing consumer choice. End-user demographics reveal a growing middle class with increasing disposable income and a preference for convenient, shelf-stable food options. Mergers and acquisitions (M&A) trends are notable, as companies seek to expand their market reach and product portfolios.
- Market Concentration: Dominated by a mix of regional and international players, with ongoing consolidation efforts.
- Technological Innovation: Focus on advanced preservation techniques, flavor enhancements, and sustainable packaging.
- Regulatory Landscape: Primarily driven by food safety certifications (e.g., HACCP, ISO) and import/export compliance.
- Competitive Substitutes: Fresh fish, frozen seafood, poultry, and plant-based protein alternatives.
- End-User Demographics: Growing demand from urban populations seeking convenient and affordable protein sources.
- M&A Trends: Strategic acquisitions to gain market share and diversify product offerings.
MEA Canned Seafood Industry Growth Trends & Insights
The MEA canned seafood market is poised for significant expansion, driven by a confluence of factors including increasing urbanization, rising disposable incomes, and a growing awareness of the health benefits associated with seafood consumption. The market size is projected to witness a healthy CAGR, propelled by the rising adoption rates of convenient food options, particularly among busy households and individuals. Technological disruptions, such as advancements in canning technology and improved supply chain logistics, are further bolstering market growth by enhancing product quality and accessibility. Consumer behavior shifts are also playing a crucial role, with a discernible trend towards premiumization and a greater demand for sustainably sourced and ethically produced canned seafood. The base year 2025 estimates a market value of XX billion units, with robust growth anticipated throughout the forecast period of 2025-2033.
Dominant Regions, Countries, or Segments in MEA Canned Seafood Industry
The United Arab Emirates stands out as a dominant region within the MEA canned seafood market, driven by its robust economy, high per capita income, and a significant expatriate population with diverse dietary preferences. The supermarkets/hypermarkets distribution channel plays a pivotal role in the UAE, offering widespread accessibility to a broad range of canned seafood products. Canned fish, particularly tuna and sardines, constitutes the largest segment due to its affordability and versatility. The region's well-developed retail infrastructure and sophisticated logistics network ensure efficient product distribution, catering to the substantial demand for convenient and nutritious food options. The growing health consciousness among consumers further fuels the demand for premium and specialty canned seafood.
- Dominant Geography: United Arab Emirates (UAE)
- Key Drivers: High disposable income, large expatriate population, strong retail infrastructure, and increasing health awareness.
- Market Share: Estimated to hold XX% of the regional market.
- Growth Potential: Fueled by evolving consumer preferences for convenience and premium products.
- Dominant Distribution Channel: Supermarkets/Hypermarkets
- Key Drivers: Extensive reach, diverse product offerings, and competitive pricing strategies.
- Market Penetration: Accounts for over XX% of canned seafood sales in major MEA markets.
- Dominant Product Type: Canned Fish (Tuna, Sardines)
- Key Drivers: Affordability, versatility in culinary applications, and widespread availability.
- Adoption Rates: Consistently high due to long shelf life and established consumer preference.
- Rest of the Middle East and Africa (MEA) Contribution: Significant growth potential driven by developing economies and increasing urbanization.
- South Africa's Role: A key market with established players and a growing demand for sustainable seafood options.
MEA Canned Seafood Industry Product Landscape
The MEA canned seafood industry is witnessing a dynamic product landscape characterized by continuous innovation. Beyond traditional offerings like canned tuna, canned salmon, canned sardines, and canned mackerel, there's a growing emphasis on value-added products. Innovations include enriched canned seafood with added vitamins and omega-3 fatty acids, as well as convenience-focused options such as ready-to-eat seafood salads and flavored canned fish. Companies are also focusing on sustainable packaging solutions and exploring new product applications in ready meals and snacks. Performance metrics are increasingly tied to shelf stability, nutritional content, and consumer appeal, with brands like Thai Union Group and Bolton Group B.V. leading in these advancements.
Key Drivers, Barriers & Challenges in MEA Canned Seafood Industry
The MEA canned seafood market is propelled by several key drivers including increasing consumer demand for convenient and affordable protein sources, a growing awareness of the health benefits of seafood, and expanding retail infrastructure across the region. Technological advancements in canning and preservation techniques also contribute to market growth.
- Key Drivers:
- Rising disposable incomes and urbanization.
- Convenience and long shelf life of canned products.
- Health benefits of seafood consumption.
- Advancements in canning technology and supply chain efficiency.
Conversely, the industry faces barriers such as fluctuating raw material prices, particularly for fish species, and intense competition from fresh and frozen seafood alternatives. Regulatory compliance and food safety standards can also pose challenges, alongside potential supply chain disruptions and the need for sustainable sourcing.
- Key Barriers & Challenges:
- Volatility in raw material prices.
- Competition from fresh and frozen seafood.
- Stringent food safety and regulatory compliance.
- Supply chain complexities and potential disruptions.
- Consumer perception challenges regarding canned products.
Emerging Opportunities in MEA Canned Seafood Industry
Emerging opportunities in the MEA canned seafood industry lie in tapping into the growing demand for premium and sustainably sourced products. The expansion of e-commerce platforms presents a significant avenue for reaching a wider consumer base, particularly in underserved urban and peri-urban areas. There is also a burgeoning interest in niche seafood varieties and value-added products, such as flavored canned fish and ready-to-eat seafood meals, catering to evolving consumer preferences for convenience and diverse culinary experiences. Furthermore, exploring innovative applications in food service and leveraging advancements in traceability and ethical sourcing will unlock new market segments.
Growth Accelerators in the MEA Canned Seafood Industry Industry
Long-term growth in the MEA canned seafood industry is expected to be accelerated by strategic partnerships and collaborations aimed at enhancing supply chain efficiency and market penetration. Technological breakthroughs in sustainable fishing practices and advanced preservation methods will play a crucial role in meeting increasing consumer demand for quality and responsible products. Furthermore, strategic market expansion into emerging economies within Africa and continued innovation in product development, focusing on health benefits and convenience, will be pivotal in driving sustained growth.
Key Players Shaping the MEA Canned Seafood Industry Market
- Kawasho Foods Corporation
- Thai Union Group (John West)
- Bidvest Namibia Fisheries Holdings (Pty) Limited
- Terrasan Group of Companies (Saldanha)
- Al-Alali
- Shrimp Nation
- Oceana Group Limited
- Bolton Group B V
- Trident Seafood Corporation
- American Tuna Inc
Notable Milestones in MEA Canned Seafood Industry Sector
- November 2022: Thai Union Group converted its loan-based strategic investment in Aegir Seafood into a 50% shareholding, further strengthening the successful business relationship between the two companies. Since Thai Union's initial investment in 2019, Aegir Seafood has made a substantial contribution to the growth of Thai Union's brands and private label business, particularly for King Oscar and Rügen Fisch. This acquisition has allowed Thai Union Group to expand its product portfolio to include high-quality cod liver, which is a premium product that complements its existing range of seafood products.
- April 2022: Saudi seafood franchise, Shrimp Nation, has launched a new branch in the United Arab Emirates. Shrimp Nation specializes in offering a wide range of shrimp products, along with crabs, fish, and other seafood products, to its customers. With its expansion into the UAE, the franchise aims to tap into the growing demand for high-quality seafood products in the region and to provide a unique dining experience to its customers. Shrimp Nation is expected to compete with other seafood restaurants in the region, offering a diverse range of menu options and unique flavors to attract customers.
- August 2021: Bolton Group B.V. announced the acquisition of Wild Planet Foods, a leading producer of sustainable seafood products. This acquisition is a strategic move for Bolton Group B.V., as it aims to accelerate its path of international development and sustainability in the seafood sector. Wild Planet Foods is known for its commitment to sustainability and responsible fishing practices, which aligns with Bolton Group's vision of providing high-quality and sustainable seafood products to its customers. With this acquisition, Bolton Group B.V. is expected to expand its global presence in the seafood industry and offer a wider range of sustainable seafood products to its customers.
In-Depth MEA Canned Seafood Industry Market Outlook
The MEA canned seafood market is projected for substantial growth, driven by increasing consumer preference for convenient and healthy food options. Key growth accelerators include the expansion of the retail sector, particularly supermarkets and online platforms, and rising disposable incomes across the region. Strategic initiatives by major players to enhance product offerings with value-added and sustainably sourced options will further fuel market potential. Future outlook indicates significant opportunities for market expansion, especially in emerging economies within Africa, and through product diversification that caters to evolving consumer tastes and health consciousness. The segment of canned shrimp and canned prawns is also expected to witness considerable traction.
MEA Canned Seafood Industry Segmentation
-
1. Type
-
1.1. Canned Fish
- 1.1.1. Tuna
- 1.1.2. Salmon
- 1.1.3. Sardines
- 1.1.4. Mackrel
- 1.2. Canned Shrimp
- 1.3. Canned Prawns
- 1.4. Other Types
-
1.1. Canned Fish
-
2. Distribution Channel
- 2.1. Supermarkets/Hypermarkets
- 2.2. Convenience Stores
- 2.3. Online Retailers
- 2.4. Other Distruibution Channels
-
3. Geography
- 3.1. United Arab Emirates
- 3.2. South Africa
- 3.3. Rest of the Middle East and Africa
MEA Canned Seafood Industry Segmentation By Geography
- 1. United Arab Emirates
- 2. South Africa
- 3. Rest of the Middle East and Africa
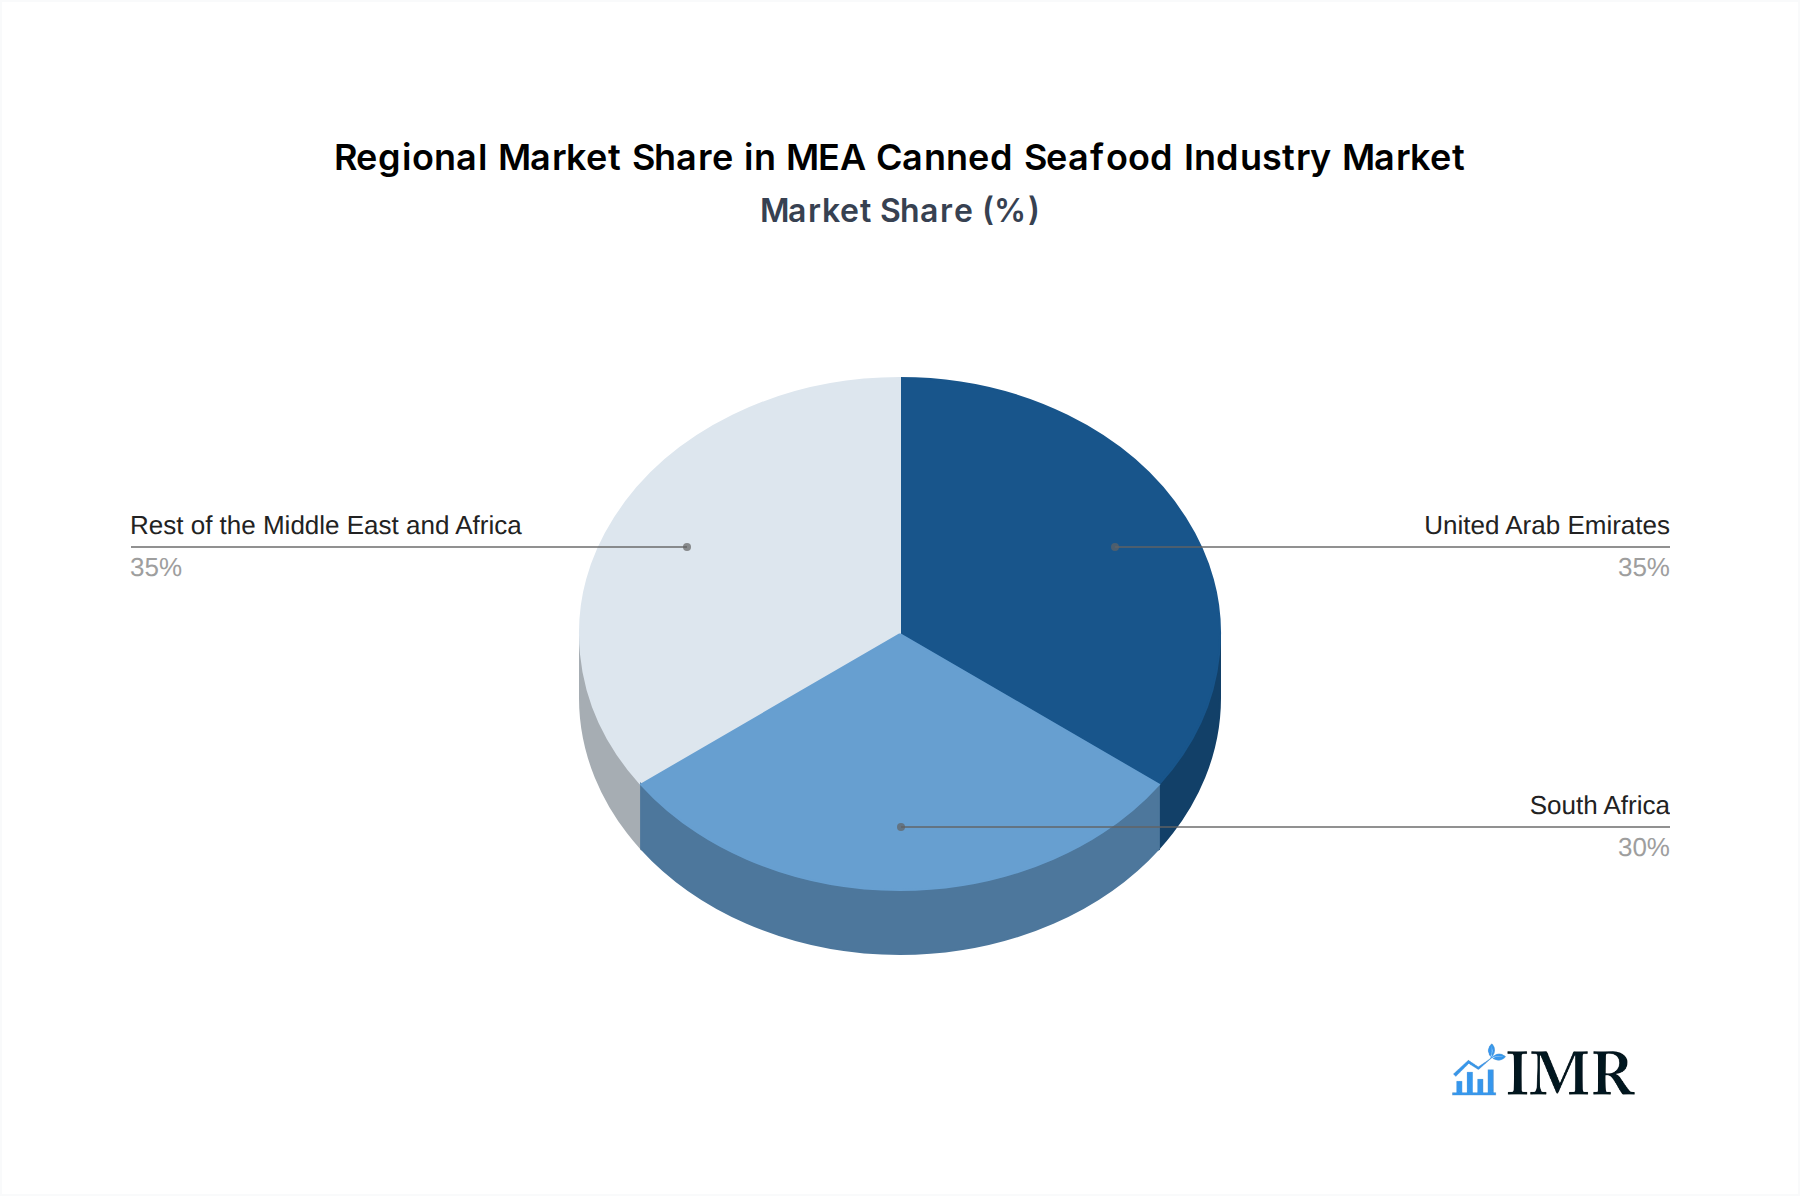
MEA Canned Seafood Industry Regional Market Share
Geographic Coverage of MEA Canned Seafood Industry
MEA Canned Seafood Industry REPORT HIGHLIGHTS
| Aspects | Details |
|---|---|
| Study Period | 2020-2034 |
| Base Year | 2025 |
| Estimated Year | 2026 |
| Forecast Period | 2026-2034 |
| Historical Period | 2020-2025 |
| Growth Rate | CAGR of 3.5% from 2020-2034 |
| Segmentation |
|
Table of Contents
- 1. Introduction
- 1.1. Research Scope
- 1.2. Market Segmentation
- 1.3. Research Objective
- 1.4. Definitions and Assumptions
- 2. Executive Summary
- 2.1. Market Snapshot
- 3. Market Dynamics
- 3.1. Market Drivers
- 3.2. Market Restrains
- 3.3. Market Trends
- 3.4. Market Opportunities
- 4. Market Factor Analysis
- 4.1. Porters Five Forces
- 4.1.1. Bargaining Power of Suppliers
- 4.1.2. Bargaining Power of Buyers
- 4.1.3. Threat of New Entrants
- 4.1.4. Threat of Substitutes
- 4.1.5. Competitive Rivalry
- 4.2. PESTEL analysis
- 4.3. BCG Analysis
- 4.3.1. Stars (High Growth, High Market Share)
- 4.3.2. Cash Cows (Low Growth, High Market Share)
- 4.3.3. Question Mark (High Growth, Low Market Share)
- 4.3.4. Dogs (Low Growth, Low Market Share)
- 4.4. Ansoff Matrix Analysis
- 4.5. Supply Chain Analysis
- 4.6. Regulatory Landscape
- 4.7. Current Market Potential and Opportunity Assessment (TAM–SAM–SOM Framework)
- 4.8. IMR Analyst Note
- 4.1. Porters Five Forces
- 5. Market Analysis, Insights and Forecast 2021-2033
- 5.1. Market Analysis, Insights and Forecast - by Type
- 5.1.1. Canned Fish
- 5.1.1.1. Tuna
- 5.1.1.2. Salmon
- 5.1.1.3. Sardines
- 5.1.1.4. Mackrel
- 5.1.2. Canned Shrimp
- 5.1.3. Canned Prawns
- 5.1.4. Other Types
- 5.1.1. Canned Fish
- 5.2. Market Analysis, Insights and Forecast - by Distribution Channel
- 5.2.1. Supermarkets/Hypermarkets
- 5.2.2. Convenience Stores
- 5.2.3. Online Retailers
- 5.2.4. Other Distruibution Channels
- 5.3. Market Analysis, Insights and Forecast - by Geography
- 5.3.1. United Arab Emirates
- 5.3.2. South Africa
- 5.3.3. Rest of the Middle East and Africa
- 5.4. Market Analysis, Insights and Forecast - by Region
- 5.4.1. United Arab Emirates
- 5.4.2. South Africa
- 5.4.3. Rest of the Middle East and Africa
- 5.1. Market Analysis, Insights and Forecast - by Type
- 6. Global MEA Canned Seafood Industry Analysis, Insights and Forecast, 2021-2033
- 6.1. Market Analysis, Insights and Forecast - by Type
- 6.1.1. Canned Fish
- 6.1.1.1. Tuna
- 6.1.1.2. Salmon
- 6.1.1.3. Sardines
- 6.1.1.4. Mackrel
- 6.1.2. Canned Shrimp
- 6.1.3. Canned Prawns
- 6.1.4. Other Types
- 6.1.1. Canned Fish
- 6.2. Market Analysis, Insights and Forecast - by Distribution Channel
- 6.2.1. Supermarkets/Hypermarkets
- 6.2.2. Convenience Stores
- 6.2.3. Online Retailers
- 6.2.4. Other Distruibution Channels
- 6.3. Market Analysis, Insights and Forecast - by Geography
- 6.3.1. United Arab Emirates
- 6.3.2. South Africa
- 6.3.3. Rest of the Middle East and Africa
- 6.1. Market Analysis, Insights and Forecast - by Type
- 7. United Arab Emirates MEA Canned Seafood Industry Analysis, Insights and Forecast, 2020-2032
- 7.1. Market Analysis, Insights and Forecast - by Type
- 7.1.1. Canned Fish
- 7.1.1.1. Tuna
- 7.1.1.2. Salmon
- 7.1.1.3. Sardines
- 7.1.1.4. Mackrel
- 7.1.2. Canned Shrimp
- 7.1.3. Canned Prawns
- 7.1.4. Other Types
- 7.1.1. Canned Fish
- 7.2. Market Analysis, Insights and Forecast - by Distribution Channel
- 7.2.1. Supermarkets/Hypermarkets
- 7.2.2. Convenience Stores
- 7.2.3. Online Retailers
- 7.2.4. Other Distruibution Channels
- 7.3. Market Analysis, Insights and Forecast - by Geography
- 7.3.1. United Arab Emirates
- 7.3.2. South Africa
- 7.3.3. Rest of the Middle East and Africa
- 7.1. Market Analysis, Insights and Forecast - by Type
- 8. South Africa MEA Canned Seafood Industry Analysis, Insights and Forecast, 2020-2032
- 8.1. Market Analysis, Insights and Forecast - by Type
- 8.1.1. Canned Fish
- 8.1.1.1. Tuna
- 8.1.1.2. Salmon
- 8.1.1.3. Sardines
- 8.1.1.4. Mackrel
- 8.1.2. Canned Shrimp
- 8.1.3. Canned Prawns
- 8.1.4. Other Types
- 8.1.1. Canned Fish
- 8.2. Market Analysis, Insights and Forecast - by Distribution Channel
- 8.2.1. Supermarkets/Hypermarkets
- 8.2.2. Convenience Stores
- 8.2.3. Online Retailers
- 8.2.4. Other Distruibution Channels
- 8.3. Market Analysis, Insights and Forecast - by Geography
- 8.3.1. United Arab Emirates
- 8.3.2. South Africa
- 8.3.3. Rest of the Middle East and Africa
- 8.1. Market Analysis, Insights and Forecast - by Type
- 9. Rest of the Middle East and Africa MEA Canned Seafood Industry Analysis, Insights and Forecast, 2020-2032
- 9.1. Market Analysis, Insights and Forecast - by Type
- 9.1.1. Canned Fish
- 9.1.1.1. Tuna
- 9.1.1.2. Salmon
- 9.1.1.3. Sardines
- 9.1.1.4. Mackrel
- 9.1.2. Canned Shrimp
- 9.1.3. Canned Prawns
- 9.1.4. Other Types
- 9.1.1. Canned Fish
- 9.2. Market Analysis, Insights and Forecast - by Distribution Channel
- 9.2.1. Supermarkets/Hypermarkets
- 9.2.2. Convenience Stores
- 9.2.3. Online Retailers
- 9.2.4. Other Distruibution Channels
- 9.3. Market Analysis, Insights and Forecast - by Geography
- 9.3.1. United Arab Emirates
- 9.3.2. South Africa
- 9.3.3. Rest of the Middle East and Africa
- 9.1. Market Analysis, Insights and Forecast - by Type
- 10. Competitive Analysis
- 10.1. Company Profiles
- 10.1.1 Kawasho Foods Corporation
- 10.1.1.1. Company Overview
- 10.1.1.2. Products
- 10.1.1.3. Company Financials
- 10.1.1.4. SWOT Analysis
- 10.1.2 Thai Union Group (John West)
- 10.1.2.1. Company Overview
- 10.1.2.2. Products
- 10.1.2.3. Company Financials
- 10.1.2.4. SWOT Analysis
- 10.1.3 Bidvest Namibia Fisheries Holdings (Pty) Limited
- 10.1.3.1. Company Overview
- 10.1.3.2. Products
- 10.1.3.3. Company Financials
- 10.1.3.4. SWOT Analysis
- 10.1.4 Terrasan Group of Companies (Saldanha)
- 10.1.4.1. Company Overview
- 10.1.4.2. Products
- 10.1.4.3. Company Financials
- 10.1.4.4. SWOT Analysis
- 10.1.5 Al-Alali
- 10.1.5.1. Company Overview
- 10.1.5.2. Products
- 10.1.5.3. Company Financials
- 10.1.5.4. SWOT Analysis
- 10.1.6 Shrimp Nation
- 10.1.6.1. Company Overview
- 10.1.6.2. Products
- 10.1.6.3. Company Financials
- 10.1.6.4. SWOT Analysis
- 10.1.7 Oceana Group Limited
- 10.1.7.1. Company Overview
- 10.1.7.2. Products
- 10.1.7.3. Company Financials
- 10.1.7.4. SWOT Analysis
- 10.1.8 Bolton Group B V
- 10.1.8.1. Company Overview
- 10.1.8.2. Products
- 10.1.8.3. Company Financials
- 10.1.8.4. SWOT Analysis
- 10.1.9 Trident Seafood Corporation
- 10.1.9.1. Company Overview
- 10.1.9.2. Products
- 10.1.9.3. Company Financials
- 10.1.9.4. SWOT Analysis
- 10.1.10 American Tuna Inc
- 10.1.10.1. Company Overview
- 10.1.10.2. Products
- 10.1.10.3. Company Financials
- 10.1.10.4. SWOT Analysis
- 10.1.1 Kawasho Foods Corporation
- 10.2. Market Entropy
- 10.2.1 Company's Key Areas Served
- 10.2.2 Recent Developments
- 10.3. Company Market Share Analysis 2025
- 10.3.1 Top 5 Companies Market Share Analysis
- 10.3.2 Top 3 Companies Market Share Analysis
- 10.4. List of Potential Customers
- 11. Research Methodology
List of Figures
- Figure 1: Global MEA Canned Seafood Industry Revenue Breakdown (billion, %) by Region 2025 & 2033
- Figure 2: Global MEA Canned Seafood Industry Volume Breakdown (K Tons, %) by Region 2025 & 2033
- Figure 3: United Arab Emirates MEA Canned Seafood Industry Revenue (billion), by Type 2025 & 2033
- Figure 4: United Arab Emirates MEA Canned Seafood Industry Volume (K Tons), by Type 2025 & 2033
- Figure 5: United Arab Emirates MEA Canned Seafood Industry Revenue Share (%), by Type 2025 & 2033
- Figure 6: United Arab Emirates MEA Canned Seafood Industry Volume Share (%), by Type 2025 & 2033
- Figure 7: United Arab Emirates MEA Canned Seafood Industry Revenue (billion), by Distribution Channel 2025 & 2033
- Figure 8: United Arab Emirates MEA Canned Seafood Industry Volume (K Tons), by Distribution Channel 2025 & 2033
- Figure 9: United Arab Emirates MEA Canned Seafood Industry Revenue Share (%), by Distribution Channel 2025 & 2033
- Figure 10: United Arab Emirates MEA Canned Seafood Industry Volume Share (%), by Distribution Channel 2025 & 2033
- Figure 11: United Arab Emirates MEA Canned Seafood Industry Revenue (billion), by Geography 2025 & 2033
- Figure 12: United Arab Emirates MEA Canned Seafood Industry Volume (K Tons), by Geography 2025 & 2033
- Figure 13: United Arab Emirates MEA Canned Seafood Industry Revenue Share (%), by Geography 2025 & 2033
- Figure 14: United Arab Emirates MEA Canned Seafood Industry Volume Share (%), by Geography 2025 & 2033
- Figure 15: United Arab Emirates MEA Canned Seafood Industry Revenue (billion), by Country 2025 & 2033
- Figure 16: United Arab Emirates MEA Canned Seafood Industry Volume (K Tons), by Country 2025 & 2033
- Figure 17: United Arab Emirates MEA Canned Seafood Industry Revenue Share (%), by Country 2025 & 2033
- Figure 18: United Arab Emirates MEA Canned Seafood Industry Volume Share (%), by Country 2025 & 2033
- Figure 19: South Africa MEA Canned Seafood Industry Revenue (billion), by Type 2025 & 2033
- Figure 20: South Africa MEA Canned Seafood Industry Volume (K Tons), by Type 2025 & 2033
- Figure 21: South Africa MEA Canned Seafood Industry Revenue Share (%), by Type 2025 & 2033
- Figure 22: South Africa MEA Canned Seafood Industry Volume Share (%), by Type 2025 & 2033
- Figure 23: South Africa MEA Canned Seafood Industry Revenue (billion), by Distribution Channel 2025 & 2033
- Figure 24: South Africa MEA Canned Seafood Industry Volume (K Tons), by Distribution Channel 2025 & 2033
- Figure 25: South Africa MEA Canned Seafood Industry Revenue Share (%), by Distribution Channel 2025 & 2033
- Figure 26: South Africa MEA Canned Seafood Industry Volume Share (%), by Distribution Channel 2025 & 2033
- Figure 27: South Africa MEA Canned Seafood Industry Revenue (billion), by Geography 2025 & 2033
- Figure 28: South Africa MEA Canned Seafood Industry Volume (K Tons), by Geography 2025 & 2033
- Figure 29: South Africa MEA Canned Seafood Industry Revenue Share (%), by Geography 2025 & 2033
- Figure 30: South Africa MEA Canned Seafood Industry Volume Share (%), by Geography 2025 & 2033
- Figure 31: South Africa MEA Canned Seafood Industry Revenue (billion), by Country 2025 & 2033
- Figure 32: South Africa MEA Canned Seafood Industry Volume (K Tons), by Country 2025 & 2033
- Figure 33: South Africa MEA Canned Seafood Industry Revenue Share (%), by Country 2025 & 2033
- Figure 34: South Africa MEA Canned Seafood Industry Volume Share (%), by Country 2025 & 2033
- Figure 35: Rest of the Middle East and Africa MEA Canned Seafood Industry Revenue (billion), by Type 2025 & 2033
- Figure 36: Rest of the Middle East and Africa MEA Canned Seafood Industry Volume (K Tons), by Type 2025 & 2033
- Figure 37: Rest of the Middle East and Africa MEA Canned Seafood Industry Revenue Share (%), by Type 2025 & 2033
- Figure 38: Rest of the Middle East and Africa MEA Canned Seafood Industry Volume Share (%), by Type 2025 & 2033
- Figure 39: Rest of the Middle East and Africa MEA Canned Seafood Industry Revenue (billion), by Distribution Channel 2025 & 2033
- Figure 40: Rest of the Middle East and Africa MEA Canned Seafood Industry Volume (K Tons), by Distribution Channel 2025 & 2033
- Figure 41: Rest of the Middle East and Africa MEA Canned Seafood Industry Revenue Share (%), by Distribution Channel 2025 & 2033
- Figure 42: Rest of the Middle East and Africa MEA Canned Seafood Industry Volume Share (%), by Distribution Channel 2025 & 2033
- Figure 43: Rest of the Middle East and Africa MEA Canned Seafood Industry Revenue (billion), by Geography 2025 & 2033
- Figure 44: Rest of the Middle East and Africa MEA Canned Seafood Industry Volume (K Tons), by Geography 2025 & 2033
- Figure 45: Rest of the Middle East and Africa MEA Canned Seafood Industry Revenue Share (%), by Geography 2025 & 2033
- Figure 46: Rest of the Middle East and Africa MEA Canned Seafood Industry Volume Share (%), by Geography 2025 & 2033
- Figure 47: Rest of the Middle East and Africa MEA Canned Seafood Industry Revenue (billion), by Country 2025 & 2033
- Figure 48: Rest of the Middle East and Africa MEA Canned Seafood Industry Volume (K Tons), by Country 2025 & 2033
- Figure 49: Rest of the Middle East and Africa MEA Canned Seafood Industry Revenue Share (%), by Country 2025 & 2033
- Figure 50: Rest of the Middle East and Africa MEA Canned Seafood Industry Volume Share (%), by Country 2025 & 2033
List of Tables
- Table 1: Global MEA Canned Seafood Industry Revenue billion Forecast, by Type 2020 & 2033
- Table 2: Global MEA Canned Seafood Industry Volume K Tons Forecast, by Type 2020 & 2033
- Table 3: Global MEA Canned Seafood Industry Revenue billion Forecast, by Distribution Channel 2020 & 2033
- Table 4: Global MEA Canned Seafood Industry Volume K Tons Forecast, by Distribution Channel 2020 & 2033
- Table 5: Global MEA Canned Seafood Industry Revenue billion Forecast, by Geography 2020 & 2033
- Table 6: Global MEA Canned Seafood Industry Volume K Tons Forecast, by Geography 2020 & 2033
- Table 7: Global MEA Canned Seafood Industry Revenue billion Forecast, by Region 2020 & 2033
- Table 8: Global MEA Canned Seafood Industry Volume K Tons Forecast, by Region 2020 & 2033
- Table 9: Global MEA Canned Seafood Industry Revenue billion Forecast, by Type 2020 & 2033
- Table 10: Global MEA Canned Seafood Industry Volume K Tons Forecast, by Type 2020 & 2033
- Table 11: Global MEA Canned Seafood Industry Revenue billion Forecast, by Distribution Channel 2020 & 2033
- Table 12: Global MEA Canned Seafood Industry Volume K Tons Forecast, by Distribution Channel 2020 & 2033
- Table 13: Global MEA Canned Seafood Industry Revenue billion Forecast, by Geography 2020 & 2033
- Table 14: Global MEA Canned Seafood Industry Volume K Tons Forecast, by Geography 2020 & 2033
- Table 15: Global MEA Canned Seafood Industry Revenue billion Forecast, by Country 2020 & 2033
- Table 16: Global MEA Canned Seafood Industry Volume K Tons Forecast, by Country 2020 & 2033
- Table 17: Global MEA Canned Seafood Industry Revenue billion Forecast, by Type 2020 & 2033
- Table 18: Global MEA Canned Seafood Industry Volume K Tons Forecast, by Type 2020 & 2033
- Table 19: Global MEA Canned Seafood Industry Revenue billion Forecast, by Distribution Channel 2020 & 2033
- Table 20: Global MEA Canned Seafood Industry Volume K Tons Forecast, by Distribution Channel 2020 & 2033
- Table 21: Global MEA Canned Seafood Industry Revenue billion Forecast, by Geography 2020 & 2033
- Table 22: Global MEA Canned Seafood Industry Volume K Tons Forecast, by Geography 2020 & 2033
- Table 23: Global MEA Canned Seafood Industry Revenue billion Forecast, by Country 2020 & 2033
- Table 24: Global MEA Canned Seafood Industry Volume K Tons Forecast, by Country 2020 & 2033
- Table 25: Global MEA Canned Seafood Industry Revenue billion Forecast, by Type 2020 & 2033
- Table 26: Global MEA Canned Seafood Industry Volume K Tons Forecast, by Type 2020 & 2033
- Table 27: Global MEA Canned Seafood Industry Revenue billion Forecast, by Distribution Channel 2020 & 2033
- Table 28: Global MEA Canned Seafood Industry Volume K Tons Forecast, by Distribution Channel 2020 & 2033
- Table 29: Global MEA Canned Seafood Industry Revenue billion Forecast, by Geography 2020 & 2033
- Table 30: Global MEA Canned Seafood Industry Volume K Tons Forecast, by Geography 2020 & 2033
- Table 31: Global MEA Canned Seafood Industry Revenue billion Forecast, by Country 2020 & 2033
- Table 32: Global MEA Canned Seafood Industry Volume K Tons Forecast, by Country 2020 & 2033
Frequently Asked Questions
1. What is the projected Compound Annual Growth Rate (CAGR) of the MEA Canned Seafood Industry?
The projected CAGR is approximately 3.5%.
2. Which companies are prominent players in the MEA Canned Seafood Industry?
Key companies in the market include Kawasho Foods Corporation, Thai Union Group (John West), Bidvest Namibia Fisheries Holdings (Pty) Limited, Terrasan Group of Companies (Saldanha), Al-Alali, Shrimp Nation, Oceana Group Limited, Bolton Group B V, Trident Seafood Corporation, American Tuna Inc.
3. What are the main segments of the MEA Canned Seafood Industry?
The market segments include Type, Distribution Channel, Geography.
4. Can you provide details about the market size?
The market size is estimated to be USD 36.1 billion as of 2022.
5. What are some drivers contributing to market growth?
Increasing Consumer Demand for Convenient Food such as Canned seafood.
6. What are the notable trends driving market growth?
Growing Popularity For Seafood Among Meat Products.
7. Are there any restraints impacting market growth?
Many consumers perceive fresh seafood as healthier compared to canned options.
8. Can you provide examples of recent developments in the market?
November 2022: Thai Union Group converted its loan-based strategic investment in Aegir Seafood into a 50% shareholding, further strengthening the successful business relationship between the two companies. Since Thai Union's initial investment in 2019, Aegir Seafood has made a substantial contribution to the growth of Thai Union's brands and private label business, particularly for King Oscar and Rügen Fisch. This acquisition has allowed Thai Union Group to expand its product portfolio to include high-quality cod liver, which is a premium product that complements its existing range of seafood products.
9. What pricing options are available for accessing the report?
Pricing options include single-user, multi-user, and enterprise licenses priced at USD 4750, USD 5250, and USD 8750 respectively.
10. Is the market size provided in terms of value or volume?
The market size is provided in terms of value, measured in billion and volume, measured in K Tons.
11. Are there any specific market keywords associated with the report?
Yes, the market keyword associated with the report is "MEA Canned Seafood Industry," which aids in identifying and referencing the specific market segment covered.
12. How do I determine which pricing option suits my needs best?
The pricing options vary based on user requirements and access needs. Individual users may opt for single-user licenses, while businesses requiring broader access may choose multi-user or enterprise licenses for cost-effective access to the report.
13. Are there any additional resources or data provided in the MEA Canned Seafood Industry report?
While the report offers comprehensive insights, it's advisable to review the specific contents or supplementary materials provided to ascertain if additional resources or data are available.
14. How can I stay updated on further developments or reports in the MEA Canned Seafood Industry?
To stay informed about further developments, trends, and reports in the MEA Canned Seafood Industry, consider subscribing to industry newsletters, following relevant companies and organizations, or regularly checking reputable industry news sources and publications.
Methodology
Step 1 - Identification of Relevant Samples Size from Population Database


Step 2 - Approaches for Defining Global Market Size (Value, Volume* & Price*)

Note*: In applicable scenarios
Step 3 - Data Sources
Primary Research
- Web Analytics
- Survey Reports
- Research Institute
- Latest Research Reports
- Opinion Leaders
Secondary Research
- Annual Reports
- White Paper
- Latest Press Release
- Industry Association
- Paid Database
- Investor Presentations

Step 4 - Data Triangulation
Involves using different sources of information in order to increase the validity of a study
These sources are likely to be stakeholders in a program - participants, other researchers, program staff, other community members, and so on.
Then we put all data in single framework & apply various statistical tools to find out the dynamic on the market.
During the analysis stage, feedback from the stakeholder groups would be compared to determine areas of agreement as well as areas of divergence