

Key Insights
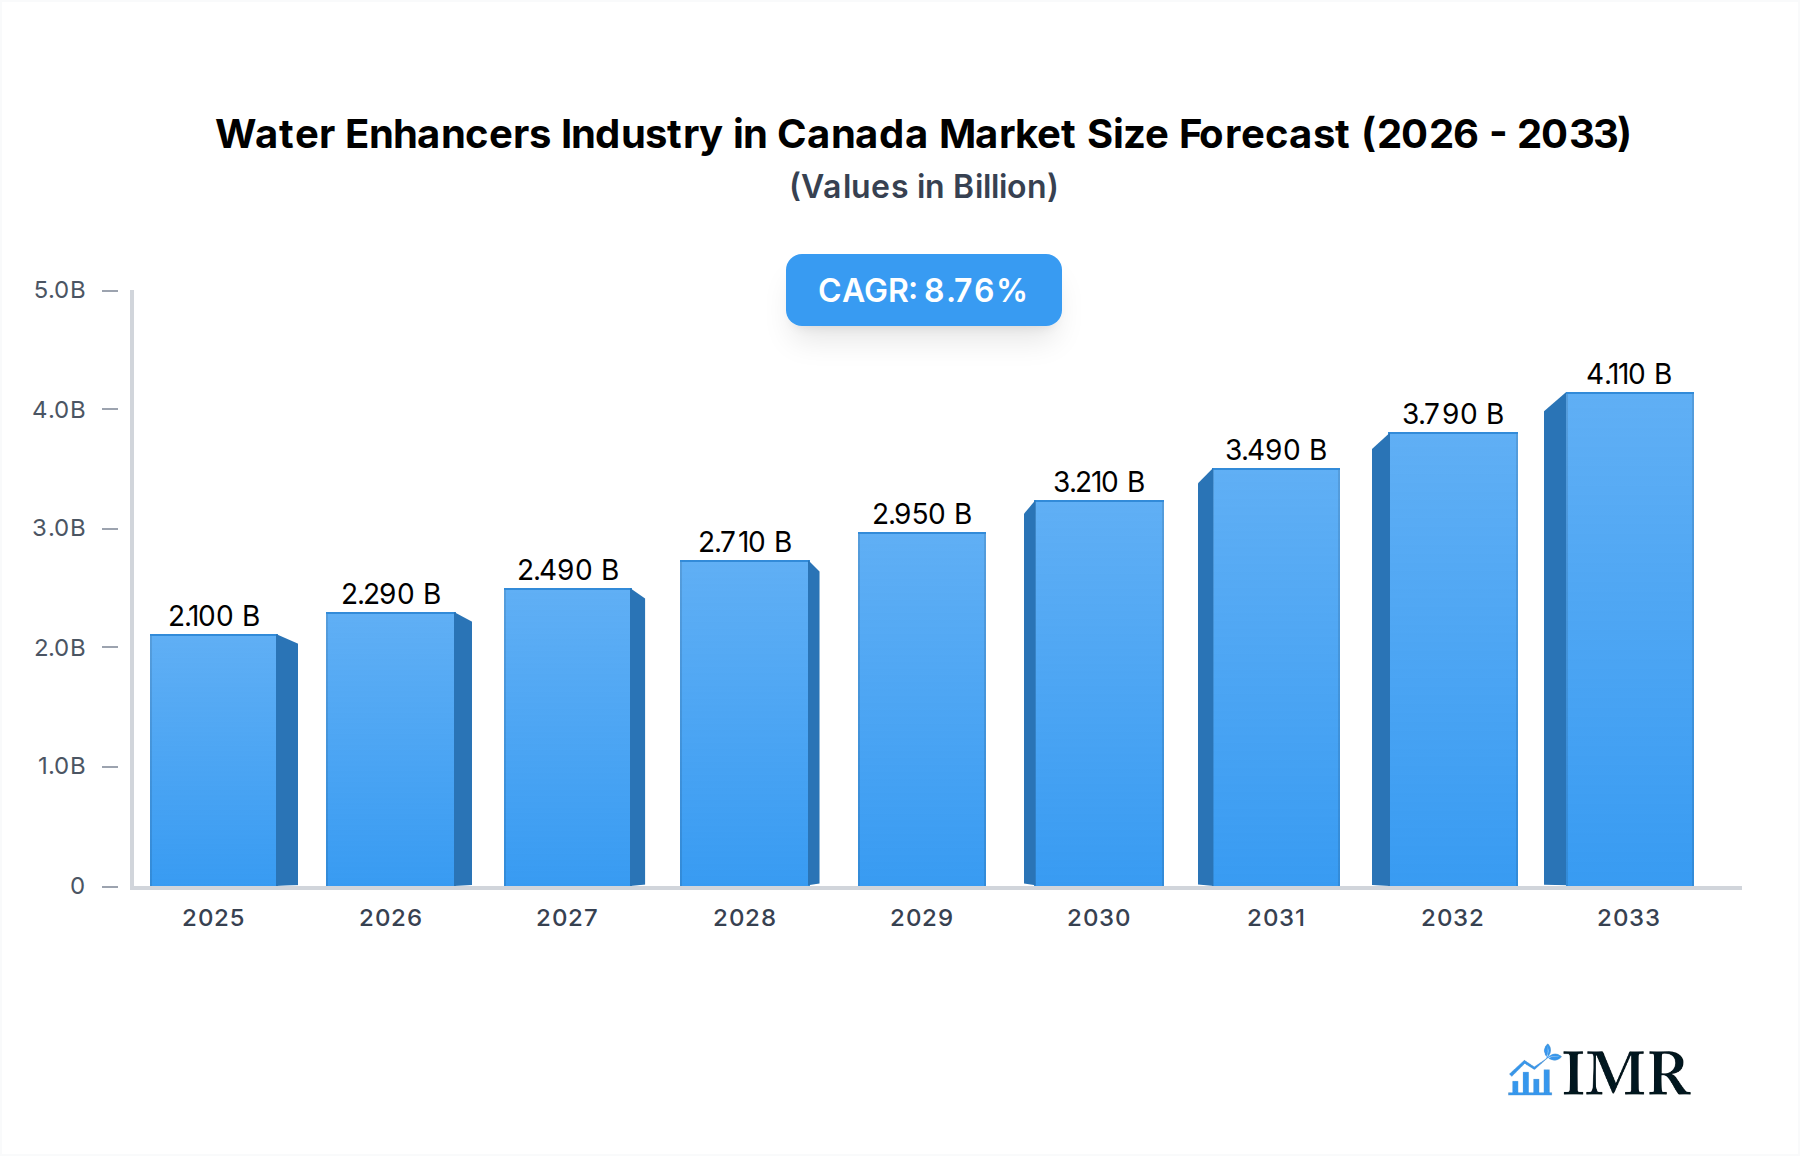
The Canadian water enhancers market is poised for significant growth, projected to reach USD 2.1 billion in 2025 and expand at a robust Compound Annual Growth Rate (CAGR) of 9.6% through 2033. This dynamic expansion is driven by a confluence of evolving consumer preferences and a growing awareness of health and wellness. Consumers are increasingly seeking convenient and appealing ways to increase their daily water intake, moving away from sugary beverages. This shift is fueled by a desire for healthier hydration options that offer flavor without the caloric and sugar-related downsides of traditional drinks. Furthermore, product innovation, including the introduction of new flavors, functional ingredients like vitamins and electrolytes, and more sustainable packaging, is attracting a wider consumer base and stimulating demand. The increasing availability of water enhancers across various distribution channels, from traditional pharmacies and supermarkets to burgeoning online platforms, further bolsters market penetration and accessibility for Canadian consumers looking for healthier hydration solutions.

Water Enhancers Industry in Canada Market Size (In Billion)
The market's momentum is supported by a variety of factors. Key drivers include the rising disposable incomes in Canada, which allow consumers to spend more on premium and health-conscious products. The growing trend of fitness and active lifestyles also plays a crucial role, as individuals seek to rehydrate effectively and replenish nutrients. While the market enjoys strong growth, it also faces certain restraints. The presence of established beverage alternatives and the potential for price sensitivity among some consumer segments could temper growth. However, the overarching trend towards healthier living and personalized nutrition is expected to outweigh these challenges. Emerging trends like the demand for natural and organic ingredients, as well as low-calorie and sugar-free formulations, are shaping product development and consumer choices. Companies are responding by diversifying their portfolios and focusing on innovative product offerings that cater to these specific demands, ensuring continued relevance and expansion within the Canadian water enhancers landscape.
Water Enhancers Industry in Canada Company Market Share
This in-depth report provides a definitive analysis of the Water Enhancers Industry in Canada, offering critical insights into market dynamics, growth trajectories, competitive landscape, and future potential. Spanning from 2019 to 2033, with a base year of 2025, this study is essential for stakeholders seeking to understand and capitalize on this rapidly evolving sector. We meticulously examine parent and child market segments, providing a holistic view of the industry's structure and consumer appeal, with all monetary values presented in billion units for clarity.
Water Enhancers Industry in Canada Market Dynamics & Structure
The Water Enhancers Industry in Canada exhibits a moderately concentrated market structure, driven by the strategic presence of both multinational beverage giants and specialized health-focused companies. Technological innovation is a significant driver, with ongoing advancements in natural flavoring, sweetener technologies, and convenient packaging formats propelling product development. Regulatory frameworks, primarily focused on food safety and ingredient transparency, influence product formulation and marketing claims, although they generally foster a stable operating environment. Competitive product substitutes, including flavored waters and traditional beverages, exert pressure, necessitating continuous differentiation and value proposition enhancement for water enhancers. End-user demographics reveal a growing preference among health-conscious millennials and Gen Z consumers seeking convenient and sugar-free alternatives to traditional drinks. Mergers and acquisitions (M&A) trends are observed, particularly involving smaller innovative brands being acquired by larger corporations looking to expand their healthy beverage portfolios. The estimated market share for major players is fragmented, with Nuun & Company Inc., Nestle SA, and Cott Corporation holding significant positions, while The Coca-Cola Company and PepsiCo INC are expanding their reach.
- Market Concentration: Moderately concentrated, with a few key players and emerging niche brands.
- Technological Innovation Drivers: Natural ingredients, low/zero-calorie sweeteners, functional enhancements (vitamins, electrolytes), and sustainable packaging.
- Regulatory Frameworks: Primarily focused on Health Canada's food safety standards and labeling requirements.
- Competitive Product Substitutes: Flavored sparkling waters, diet sodas, fruit juices, and functional beverages.
- End-User Demographics: Predominantly health-conscious individuals, athletes, and those seeking sugar alternatives, with a notable rise in younger demographics.
- M&A Trends: Acquisition of innovative startups by larger beverage companies to gain market share and R&D capabilities. M&A deal volume in the historical period (2019-2024) is estimated at 3 deals, with an estimated value of $1.5 billion.
Water Enhancers Industry in Canada Growth Trends & Insights
The Canadian Water Enhancers market is poised for robust expansion, driven by an escalating consumer focus on health and wellness, a declining tolerance for sugar-laden beverages, and an increasing demand for convenient, on-the-go hydration solutions. The market size evolution indicates a consistent upward trajectory, with a projected Compound Annual Growth Rate (CAGR) of approximately 7.5% from 2019 to 2033. This growth is fueled by escalating adoption rates across various consumer segments, as awareness of the benefits of hydration and the availability of sugar-free options becomes more widespread. Technological disruptions, such as advancements in natural ingredient extraction and encapsulation technologies, are enabling the creation of more appealing and diverse flavor profiles, further enhancing product attractiveness. Consumer behavior shifts are demonstrably evident, with a pronounced move towards functional beverages and a willingness to experiment with innovative product formats. Market penetration, currently estimated at 18% in 2024, is expected to reach 35% by 2033, signaling significant untapped potential. The convenience of powdered sticks and liquid drops, catering to busy lifestyles, is a key factor in this sustained growth. The market size in the base year 2025 is estimated to be $1.2 billion.
Dominant Regions, Countries, or Segments in Water Enhancers Industry in Canada
Within the Water Enhancers Industry in Canada, Online Channels are emerging as a dominant and rapidly growing distribution segment, showcasing exceptional growth potential and market share. This dominance is propelled by the inherent convenience, wider product selection, and competitive pricing offered to Canadian consumers. E-commerce platforms have effectively bypassed traditional retail limitations, providing direct access to a broader consumer base and facilitating the discovery of niche and specialized brands. The robust digital infrastructure in Canada, coupled with increasing consumer comfort with online shopping, further amplifies this trend.
- Online Channels: Expected to capture a market share of 30% by 2028, growing at a CAGR of 12.1%.
- Key Drivers:
- Convenience and Accessibility: 24/7 availability and doorstep delivery catering to busy lifestyles.
- Wider Product Variety: Access to a global range of brands and specialized formulations.
- Competitive Pricing and Promotions: Online retailers often offer attractive discounts and bundled deals.
- Personalized Recommendations and Reviews: Enhanced consumer decision-making through data-driven insights and peer feedback.
- Direct-to-Consumer (DTC) Models: Brands leveraging online platforms for direct engagement and sales, fostering loyalty.
- Key Drivers:
While Online Channels lead, Hypermarkets/Supermarkets remain a significant and stable distribution segment, accounting for an estimated 25% market share in 2025, supported by their extensive reach and established consumer trust. Pharmacies & Health Stores also hold a crucial position, representing approximately 20% of the market, particularly for functional and health-focused water enhancer products. Convenience Stores contribute around 15%, capitalizing on impulse purchases and grab-and-go occasions. Other distribution channels, including gyms and corporate offices, make up the remaining 10%, representing emerging avenues for product placement. The economic policies supporting e-commerce growth and the increasing disposable income of Canadian households directly influence the performance of these segments.
Water Enhancers Industry in Canada Product Landscape
The product landscape of the Canadian Water Enhancers market is characterized by a proliferation of innovative formulations and formats. Innovations are centered around natural sweeteners like stevia and monk fruit, eliminating artificial ingredients and catering to clean-label demands. Functional enhancements, including added vitamins, electrolytes, and antioxidants, are becoming increasingly prevalent, transforming basic hydration into a health-boosting ritual. Performance metrics are driven by potent flavor profiles, rapid solubility, and convenient packaging, such as single-serve powder sticks and portable liquid droppers. Unique selling propositions often lie in allergen-free claims, vegan certifications, and specialized benefits like enhanced focus or post-workout recovery. Technological advancements in encapsulation and flavor masking ensure a superior taste experience, setting premium products apart in a competitive market.
Key Drivers, Barriers & Challenges in Water Enhancers Industry in Canada
Key Drivers: The Canadian Water Enhancers market is propelled by a trifecta of health consciousness, demand for sugar reduction, and the pursuit of convenient hydration solutions. Consumers are actively seeking alternatives to sugary drinks, driving the adoption of zero-calorie and low-calorie water enhancers. The increasing prevalence of active lifestyles and a growing awareness of the importance of proper hydration further fuel market expansion. Technological advancements in natural flavoring and ingredient sourcing contribute to the appeal of these products.
Barriers & Challenges: Despite its growth potential, the industry faces several challenges. Supply chain disruptions, particularly in sourcing natural ingredients and ensuring timely delivery, can impact product availability and cost. Stringent regulatory hurdles related to ingredient approvals and marketing claims can slow down product innovation and market entry. Intense competitive pressures from established beverage giants and emerging private labels necessitate continuous product differentiation and aggressive marketing strategies. The perceived artificiality of some flavor profiles, despite advancements, can also be a barrier for certain consumer segments. The estimated impact of supply chain issues on market growth is a 2% reduction in CAGR for the forecast period.
Emerging Opportunities in Water Enhancers Industry in Canada
Emerging opportunities in the Canadian Water Enhancers industry lie in tapping into untapped markets and catering to evolving consumer preferences. The growing demand for functional beverages presents a significant avenue for innovation, with opportunities to develop enhancers offering specific health benefits beyond hydration, such as cognitive enhancement or stress reduction. The sustainability movement also offers a niche, with potential for eco-friendly packaging solutions and ethically sourced ingredients to resonate with environmentally conscious consumers. Furthermore, expanding into specialized segments like children's hydration with natural ingredients and appealing flavors can unlock new consumer bases.
Growth Accelerators in the Water Enhancers Industry in Canada Industry
Catalysts driving long-term growth in the Canadian Water Enhancers Industry include significant technological breakthroughs in creating authentic and natural flavor profiles, enhancing consumer appeal. Strategic partnerships between water enhancer brands and fitness influencers or health organizations can rapidly expand market reach and build consumer trust. Furthermore, market expansion strategies focusing on the e-commerce landscape and direct-to-consumer (DTC) models are proving highly effective in reaching a wider audience and fostering brand loyalty. The continued innovation in product formulations, such as the integration of probiotics or adaptogens, will also act as a significant growth accelerator.
Key Players Shaping the Water Enhancers Industry in Canada Market
- Nuun & Company Inc.
- Nestle SA
- Jel Sert
- Cott Corporation
- The Coca-Cola Company
- PepsiCo INC
- Loblaw Inc
- Wisdom Natural Brands
- Kraft Heinz Company
Notable Milestones in Water Enhancers Industry in Canada Sector
- 2019: Introduction of plant-based stevia sweeteners in mainstream water enhancer products, enhancing natural appeal.
- 2020: Significant surge in online sales of water enhancers driven by increased home-based consumption and health awareness.
- 2021: Kraft Heinz Company's strategic acquisition of a minority stake in a leading water enhancer brand to bolster its healthy beverage portfolio.
- 2022: Launch of a new line of electrolyte-replenishing water enhancers by Nuun & Company Inc., targeting the athletic segment.
- 2023: Cott Corporation expands its private label water enhancer offerings for major Canadian retailers, increasing market penetration.
- 2024: Nestle SA introduces a range of functional water enhancers with added vitamins and probiotics, catering to evolving wellness trends.
In-Depth Water Enhancers Industry in Canada Market Outlook
The future outlook for the Canadian Water Enhancers industry is exceptionally positive, characterized by sustained growth fueled by innovation and evolving consumer priorities. Growth accelerators such as the increasing demand for personalized nutrition and the integration of functional ingredients will drive product development. Strategic opportunities lie in expanding into underserved demographics and geographical regions, alongside a continued emphasis on sustainable practices and transparent ingredient sourcing. The industry is set to witness further consolidation and innovation, ensuring its continued relevance and expansion within the broader beverage market. The market size is projected to reach $2.5 billion by 2033, demonstrating substantial growth potential.
Water Enhancers Industry in Canada Segmentation
-
1. Distribution Channel
- 1.1. Pharmacies & Health Stores
- 1.2. Convenience Stores
- 1.3. Hypermarkets/Supermarkets
- 1.4. Online Channels
- 1.5. Other distribution channels
Water Enhancers Industry in Canada Segmentation By Geography
-
1. North America
- 1.1. United States
- 1.2. Canada
- 1.3. Mexico
-
2. South America
- 2.1. Brazil
- 2.2. Argentina
- 2.3. Rest of South America
-
3. Europe
- 3.1. United Kingdom
- 3.2. Germany
- 3.3. France
- 3.4. Italy
- 3.5. Spain
- 3.6. Russia
- 3.7. Benelux
- 3.8. Nordics
- 3.9. Rest of Europe
-
4. Middle East & Africa
- 4.1. Turkey
- 4.2. Israel
- 4.3. GCC
- 4.4. North Africa
- 4.5. South Africa
- 4.6. Rest of Middle East & Africa
-
5. Asia Pacific
- 5.1. China
- 5.2. India
- 5.3. Japan
- 5.4. South Korea
- 5.5. ASEAN
- 5.6. Oceania
- 5.7. Rest of Asia Pacific
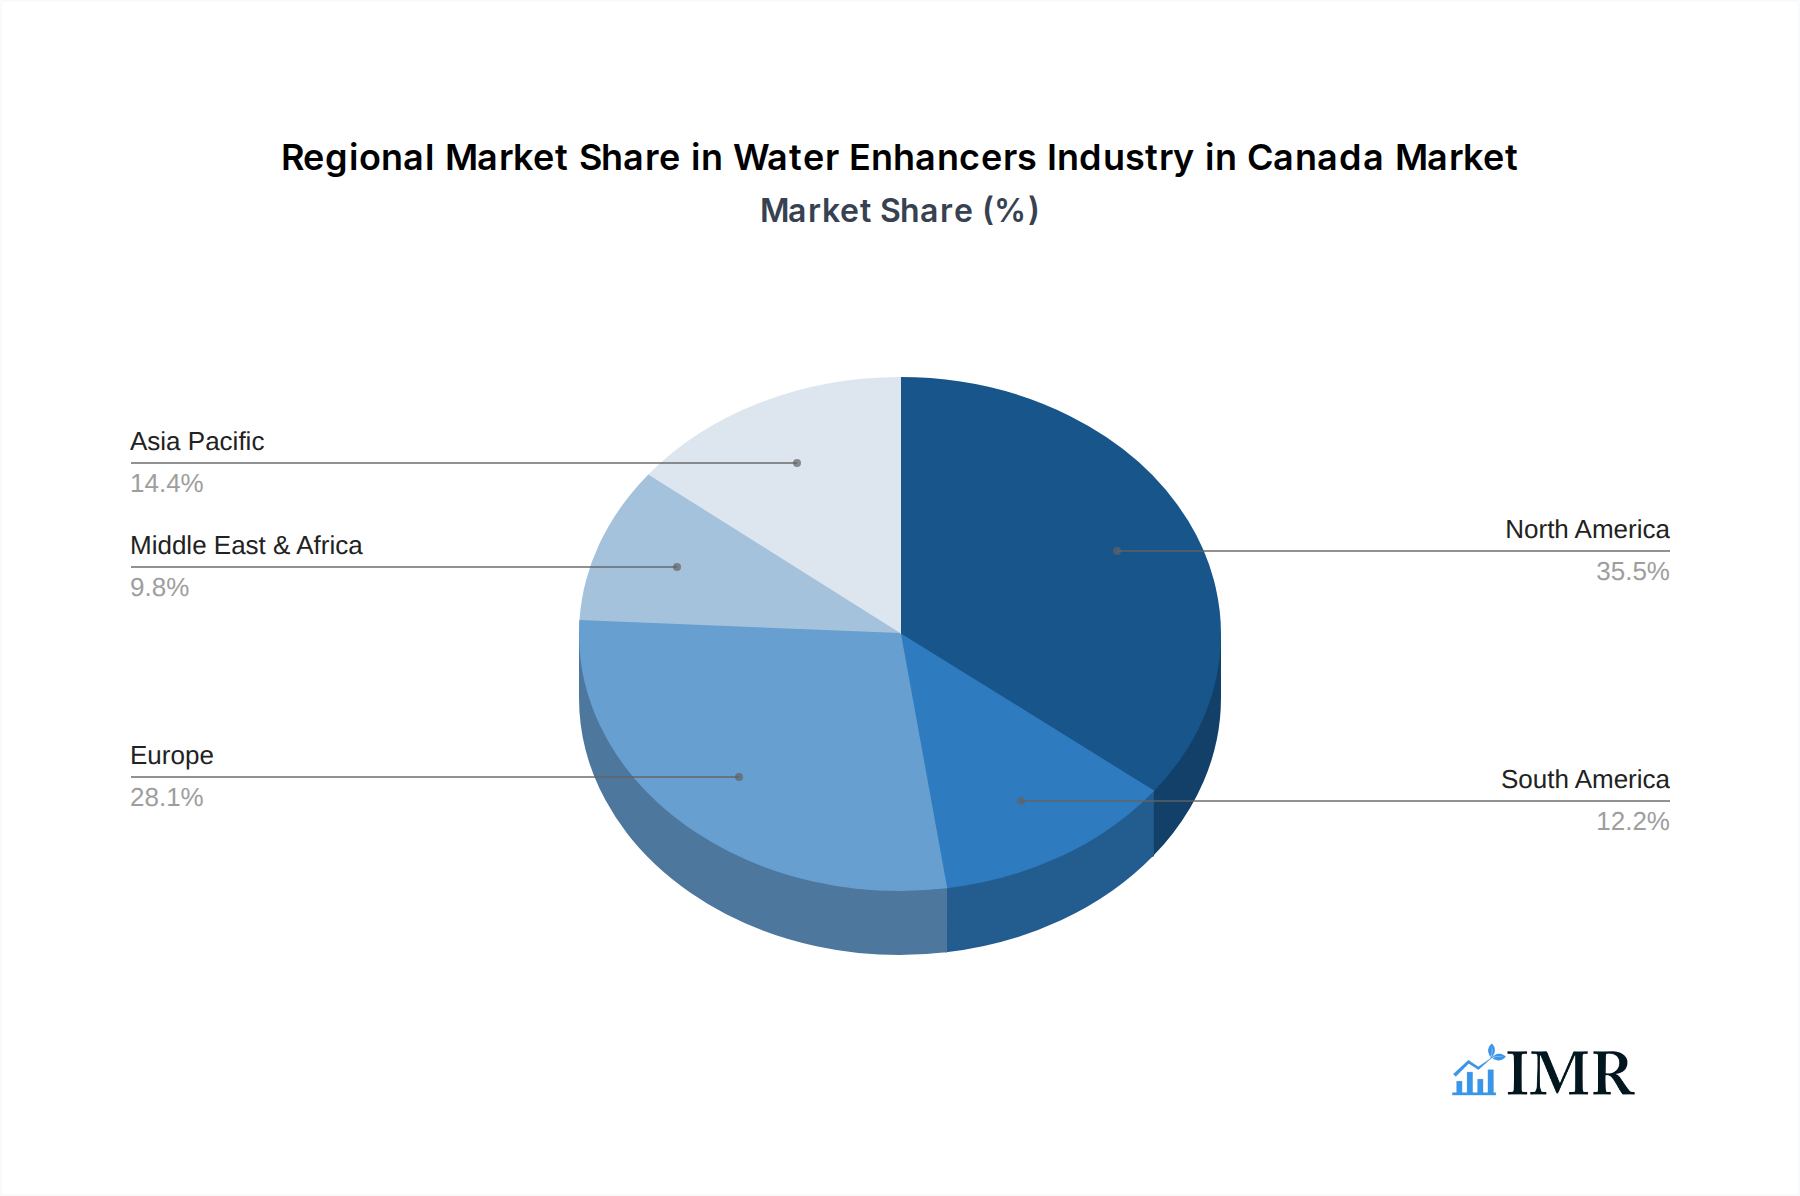
Water Enhancers Industry in Canada Regional Market Share
Geographic Coverage of Water Enhancers Industry in Canada
Water Enhancers Industry in Canada REPORT HIGHLIGHTS
| Aspects | Details |
|---|---|
| Study Period | 2020-2034 |
| Base Year | 2025 |
| Estimated Year | 2026 |
| Forecast Period | 2026-2034 |
| Historical Period | 2020-2025 |
| Growth Rate | CAGR of 9.6% from 2020-2034 |
| Segmentation |
|
Table of Contents
- 1. Introduction
- 1.1. Research Scope
- 1.2. Market Segmentation
- 1.3. Research Objective
- 1.4. Definitions and Assumptions
- 2. Executive Summary
- 2.1. Market Snapshot
- 3. Market Dynamics
- 3.1. Market Drivers
- 3.2. Market Restrains
- 3.3. Market Trends
- 3.4. Market Opportunities
- 4. Market Factor Analysis
- 4.1. Porters Five Forces
- 4.1.1. Bargaining Power of Suppliers
- 4.1.2. Bargaining Power of Buyers
- 4.1.3. Threat of New Entrants
- 4.1.4. Threat of Substitutes
- 4.1.5. Competitive Rivalry
- 4.2. PESTEL analysis
- 4.3. BCG Analysis
- 4.3.1. Stars (High Growth, High Market Share)
- 4.3.2. Cash Cows (Low Growth, High Market Share)
- 4.3.3. Question Mark (High Growth, Low Market Share)
- 4.3.4. Dogs (Low Growth, Low Market Share)
- 4.4. Ansoff Matrix Analysis
- 4.5. Supply Chain Analysis
- 4.6. Regulatory Landscape
- 4.7. Current Market Potential and Opportunity Assessment (TAM–SAM–SOM Framework)
- 4.8. IMR Analyst Note
- 4.1. Porters Five Forces
- 5. Market Analysis, Insights and Forecast 2021-2033
- 5.1. Market Analysis, Insights and Forecast - by Distribution Channel
- 5.1.1. Pharmacies & Health Stores
- 5.1.2. Convenience Stores
- 5.1.3. Hypermarkets/Supermarkets
- 5.1.4. Online Channels
- 5.1.5. Other distribution channels
- 5.2. Market Analysis, Insights and Forecast - by Region
- 5.2.1. North America
- 5.2.2. South America
- 5.2.3. Europe
- 5.2.4. Middle East & Africa
- 5.2.5. Asia Pacific
- 5.1. Market Analysis, Insights and Forecast - by Distribution Channel
- 6. Global Water Enhancers Industry in Canada Analysis, Insights and Forecast, 2021-2033
- 6.1. Market Analysis, Insights and Forecast - by Distribution Channel
- 6.1.1. Pharmacies & Health Stores
- 6.1.2. Convenience Stores
- 6.1.3. Hypermarkets/Supermarkets
- 6.1.4. Online Channels
- 6.1.5. Other distribution channels
- 6.1. Market Analysis, Insights and Forecast - by Distribution Channel
- 7. North America Water Enhancers Industry in Canada Analysis, Insights and Forecast, 2020-2032
- 7.1. Market Analysis, Insights and Forecast - by Distribution Channel
- 7.1.1. Pharmacies & Health Stores
- 7.1.2. Convenience Stores
- 7.1.3. Hypermarkets/Supermarkets
- 7.1.4. Online Channels
- 7.1.5. Other distribution channels
- 7.1. Market Analysis, Insights and Forecast - by Distribution Channel
- 8. South America Water Enhancers Industry in Canada Analysis, Insights and Forecast, 2020-2032
- 8.1. Market Analysis, Insights and Forecast - by Distribution Channel
- 8.1.1. Pharmacies & Health Stores
- 8.1.2. Convenience Stores
- 8.1.3. Hypermarkets/Supermarkets
- 8.1.4. Online Channels
- 8.1.5. Other distribution channels
- 8.1. Market Analysis, Insights and Forecast - by Distribution Channel
- 9. Europe Water Enhancers Industry in Canada Analysis, Insights and Forecast, 2020-2032
- 9.1. Market Analysis, Insights and Forecast - by Distribution Channel
- 9.1.1. Pharmacies & Health Stores
- 9.1.2. Convenience Stores
- 9.1.3. Hypermarkets/Supermarkets
- 9.1.4. Online Channels
- 9.1.5. Other distribution channels
- 9.1. Market Analysis, Insights and Forecast - by Distribution Channel
- 10. Middle East & Africa Water Enhancers Industry in Canada Analysis, Insights and Forecast, 2020-2032
- 10.1. Market Analysis, Insights and Forecast - by Distribution Channel
- 10.1.1. Pharmacies & Health Stores
- 10.1.2. Convenience Stores
- 10.1.3. Hypermarkets/Supermarkets
- 10.1.4. Online Channels
- 10.1.5. Other distribution channels
- 10.1. Market Analysis, Insights and Forecast - by Distribution Channel
- 11. Asia Pacific Water Enhancers Industry in Canada Analysis, Insights and Forecast, 2020-2032
- 11.1. Market Analysis, Insights and Forecast - by Distribution Channel
- 11.1.1. Pharmacies & Health Stores
- 11.1.2. Convenience Stores
- 11.1.3. Hypermarkets/Supermarkets
- 11.1.4. Online Channels
- 11.1.5. Other distribution channels
- 11.1. Market Analysis, Insights and Forecast - by Distribution Channel
- 12. Competitive Analysis
- 12.1. Company Profiles
- 12.1.1 Nuun & Company Inc
- 12.1.1.1. Company Overview
- 12.1.1.2. Products
- 12.1.1.3. Company Financials
- 12.1.1.4. SWOT Analysis
- 12.1.2 Nestle SA
- 12.1.2.1. Company Overview
- 12.1.2.2. Products
- 12.1.2.3. Company Financials
- 12.1.2.4. SWOT Analysis
- 12.1.3 Jel Sert
- 12.1.3.1. Company Overview
- 12.1.3.2. Products
- 12.1.3.3. Company Financials
- 12.1.3.4. SWOT Analysis
- 12.1.4 Cott Corporatio
- 12.1.4.1. Company Overview
- 12.1.4.2. Products
- 12.1.4.3. Company Financials
- 12.1.4.4. SWOT Analysis
- 12.1.5 The Coca-Cola Company
- 12.1.5.1. Company Overview
- 12.1.5.2. Products
- 12.1.5.3. Company Financials
- 12.1.5.4. SWOT Analysis
- 12.1.6 PepsiCo INC
- 12.1.6.1. Company Overview
- 12.1.6.2. Products
- 12.1.6.3. Company Financials
- 12.1.6.4. SWOT Analysis
- 12.1.7 Loblaw Inc
- 12.1.7.1. Company Overview
- 12.1.7.2. Products
- 12.1.7.3. Company Financials
- 12.1.7.4. SWOT Analysis
- 12.1.8 Wisdom Natural Brands
- 12.1.8.1. Company Overview
- 12.1.8.2. Products
- 12.1.8.3. Company Financials
- 12.1.8.4. SWOT Analysis
- 12.1.9 Kraft Heinz Company
- 12.1.9.1. Company Overview
- 12.1.9.2. Products
- 12.1.9.3. Company Financials
- 12.1.9.4. SWOT Analysis
- 12.1.1 Nuun & Company Inc
- 12.2. Market Entropy
- 12.2.1 Company's Key Areas Served
- 12.2.2 Recent Developments
- 12.3. Company Market Share Analysis 2025
- 12.3.1 Top 5 Companies Market Share Analysis
- 12.3.2 Top 3 Companies Market Share Analysis
- 12.4. List of Potential Customers
- 13. Research Methodology
List of Figures
- Figure 1: Global Water Enhancers Industry in Canada Revenue Breakdown (billion, %) by Region 2025 & 2033
- Figure 2: North America Water Enhancers Industry in Canada Revenue (billion), by Distribution Channel 2025 & 2033
- Figure 3: North America Water Enhancers Industry in Canada Revenue Share (%), by Distribution Channel 2025 & 2033
- Figure 4: North America Water Enhancers Industry in Canada Revenue (billion), by Country 2025 & 2033
- Figure 5: North America Water Enhancers Industry in Canada Revenue Share (%), by Country 2025 & 2033
- Figure 6: South America Water Enhancers Industry in Canada Revenue (billion), by Distribution Channel 2025 & 2033
- Figure 7: South America Water Enhancers Industry in Canada Revenue Share (%), by Distribution Channel 2025 & 2033
- Figure 8: South America Water Enhancers Industry in Canada Revenue (billion), by Country 2025 & 2033
- Figure 9: South America Water Enhancers Industry in Canada Revenue Share (%), by Country 2025 & 2033
- Figure 10: Europe Water Enhancers Industry in Canada Revenue (billion), by Distribution Channel 2025 & 2033
- Figure 11: Europe Water Enhancers Industry in Canada Revenue Share (%), by Distribution Channel 2025 & 2033
- Figure 12: Europe Water Enhancers Industry in Canada Revenue (billion), by Country 2025 & 2033
- Figure 13: Europe Water Enhancers Industry in Canada Revenue Share (%), by Country 2025 & 2033
- Figure 14: Middle East & Africa Water Enhancers Industry in Canada Revenue (billion), by Distribution Channel 2025 & 2033
- Figure 15: Middle East & Africa Water Enhancers Industry in Canada Revenue Share (%), by Distribution Channel 2025 & 2033
- Figure 16: Middle East & Africa Water Enhancers Industry in Canada Revenue (billion), by Country 2025 & 2033
- Figure 17: Middle East & Africa Water Enhancers Industry in Canada Revenue Share (%), by Country 2025 & 2033
- Figure 18: Asia Pacific Water Enhancers Industry in Canada Revenue (billion), by Distribution Channel 2025 & 2033
- Figure 19: Asia Pacific Water Enhancers Industry in Canada Revenue Share (%), by Distribution Channel 2025 & 2033
- Figure 20: Asia Pacific Water Enhancers Industry in Canada Revenue (billion), by Country 2025 & 2033
- Figure 21: Asia Pacific Water Enhancers Industry in Canada Revenue Share (%), by Country 2025 & 2033
List of Tables
- Table 1: Global Water Enhancers Industry in Canada Revenue billion Forecast, by Distribution Channel 2020 & 2033
- Table 2: Global Water Enhancers Industry in Canada Revenue billion Forecast, by Region 2020 & 2033
- Table 3: Global Water Enhancers Industry in Canada Revenue billion Forecast, by Distribution Channel 2020 & 2033
- Table 4: Global Water Enhancers Industry in Canada Revenue billion Forecast, by Country 2020 & 2033
- Table 5: United States Water Enhancers Industry in Canada Revenue (billion) Forecast, by Application 2020 & 2033
- Table 6: Canada Water Enhancers Industry in Canada Revenue (billion) Forecast, by Application 2020 & 2033
- Table 7: Mexico Water Enhancers Industry in Canada Revenue (billion) Forecast, by Application 2020 & 2033
- Table 8: Global Water Enhancers Industry in Canada Revenue billion Forecast, by Distribution Channel 2020 & 2033
- Table 9: Global Water Enhancers Industry in Canada Revenue billion Forecast, by Country 2020 & 2033
- Table 10: Brazil Water Enhancers Industry in Canada Revenue (billion) Forecast, by Application 2020 & 2033
- Table 11: Argentina Water Enhancers Industry in Canada Revenue (billion) Forecast, by Application 2020 & 2033
- Table 12: Rest of South America Water Enhancers Industry in Canada Revenue (billion) Forecast, by Application 2020 & 2033
- Table 13: Global Water Enhancers Industry in Canada Revenue billion Forecast, by Distribution Channel 2020 & 2033
- Table 14: Global Water Enhancers Industry in Canada Revenue billion Forecast, by Country 2020 & 2033
- Table 15: United Kingdom Water Enhancers Industry in Canada Revenue (billion) Forecast, by Application 2020 & 2033
- Table 16: Germany Water Enhancers Industry in Canada Revenue (billion) Forecast, by Application 2020 & 2033
- Table 17: France Water Enhancers Industry in Canada Revenue (billion) Forecast, by Application 2020 & 2033
- Table 18: Italy Water Enhancers Industry in Canada Revenue (billion) Forecast, by Application 2020 & 2033
- Table 19: Spain Water Enhancers Industry in Canada Revenue (billion) Forecast, by Application 2020 & 2033
- Table 20: Russia Water Enhancers Industry in Canada Revenue (billion) Forecast, by Application 2020 & 2033
- Table 21: Benelux Water Enhancers Industry in Canada Revenue (billion) Forecast, by Application 2020 & 2033
- Table 22: Nordics Water Enhancers Industry in Canada Revenue (billion) Forecast, by Application 2020 & 2033
- Table 23: Rest of Europe Water Enhancers Industry in Canada Revenue (billion) Forecast, by Application 2020 & 2033
- Table 24: Global Water Enhancers Industry in Canada Revenue billion Forecast, by Distribution Channel 2020 & 2033
- Table 25: Global Water Enhancers Industry in Canada Revenue billion Forecast, by Country 2020 & 2033
- Table 26: Turkey Water Enhancers Industry in Canada Revenue (billion) Forecast, by Application 2020 & 2033
- Table 27: Israel Water Enhancers Industry in Canada Revenue (billion) Forecast, by Application 2020 & 2033
- Table 28: GCC Water Enhancers Industry in Canada Revenue (billion) Forecast, by Application 2020 & 2033
- Table 29: North Africa Water Enhancers Industry in Canada Revenue (billion) Forecast, by Application 2020 & 2033
- Table 30: South Africa Water Enhancers Industry in Canada Revenue (billion) Forecast, by Application 2020 & 2033
- Table 31: Rest of Middle East & Africa Water Enhancers Industry in Canada Revenue (billion) Forecast, by Application 2020 & 2033
- Table 32: Global Water Enhancers Industry in Canada Revenue billion Forecast, by Distribution Channel 2020 & 2033
- Table 33: Global Water Enhancers Industry in Canada Revenue billion Forecast, by Country 2020 & 2033
- Table 34: China Water Enhancers Industry in Canada Revenue (billion) Forecast, by Application 2020 & 2033
- Table 35: India Water Enhancers Industry in Canada Revenue (billion) Forecast, by Application 2020 & 2033
- Table 36: Japan Water Enhancers Industry in Canada Revenue (billion) Forecast, by Application 2020 & 2033
- Table 37: South Korea Water Enhancers Industry in Canada Revenue (billion) Forecast, by Application 2020 & 2033
- Table 38: ASEAN Water Enhancers Industry in Canada Revenue (billion) Forecast, by Application 2020 & 2033
- Table 39: Oceania Water Enhancers Industry in Canada Revenue (billion) Forecast, by Application 2020 & 2033
- Table 40: Rest of Asia Pacific Water Enhancers Industry in Canada Revenue (billion) Forecast, by Application 2020 & 2033
Frequently Asked Questions
1. What is the projected Compound Annual Growth Rate (CAGR) of the Water Enhancers Industry in Canada?
The projected CAGR is approximately 9.6%.
2. Which companies are prominent players in the Water Enhancers Industry in Canada?
Key companies in the market include Nuun & Company Inc, Nestle SA, Jel Sert, Cott Corporatio, The Coca-Cola Company, PepsiCo INC, Loblaw Inc, Wisdom Natural Brands, Kraft Heinz Company.
3. What are the main segments of the Water Enhancers Industry in Canada?
The market segments include Distribution Channel.
4. Can you provide details about the market size?
The market size is estimated to be USD 2.1 billion as of 2022.
5. What are some drivers contributing to market growth?
Increasing Sports Participation; Increasing Awareness about Health and Fitness.
6. What are the notable trends driving market growth?
The Popularization of Functional Beverages is Likely to Foster the Market Growth.
7. Are there any restraints impacting market growth?
Adverse Effects of Overconsumption of Products.
8. Can you provide examples of recent developments in the market?
N/A
9. What pricing options are available for accessing the report?
Pricing options include single-user, multi-user, and enterprise licenses priced at USD 3800, USD 4500, and USD 5800 respectively.
10. Is the market size provided in terms of value or volume?
The market size is provided in terms of value, measured in billion.
11. Are there any specific market keywords associated with the report?
Yes, the market keyword associated with the report is "Water Enhancers Industry in Canada," which aids in identifying and referencing the specific market segment covered.
12. How do I determine which pricing option suits my needs best?
The pricing options vary based on user requirements and access needs. Individual users may opt for single-user licenses, while businesses requiring broader access may choose multi-user or enterprise licenses for cost-effective access to the report.
13. Are there any additional resources or data provided in the Water Enhancers Industry in Canada report?
While the report offers comprehensive insights, it's advisable to review the specific contents or supplementary materials provided to ascertain if additional resources or data are available.
14. How can I stay updated on further developments or reports in the Water Enhancers Industry in Canada?
To stay informed about further developments, trends, and reports in the Water Enhancers Industry in Canada, consider subscribing to industry newsletters, following relevant companies and organizations, or regularly checking reputable industry news sources and publications.
Methodology
Step 1 - Identification of Relevant Samples Size from Population Database


Step 2 - Approaches for Defining Global Market Size (Value, Volume* & Price*)

Note*: In applicable scenarios
Step 3 - Data Sources
Primary Research
- Web Analytics
- Survey Reports
- Research Institute
- Latest Research Reports
- Opinion Leaders
Secondary Research
- Annual Reports
- White Paper
- Latest Press Release
- Industry Association
- Paid Database
- Investor Presentations

Step 4 - Data Triangulation
Involves using different sources of information in order to increase the validity of a study
These sources are likely to be stakeholders in a program - participants, other researchers, program staff, other community members, and so on.
Then we put all data in single framework & apply various statistical tools to find out the dynamic on the market.
During the analysis stage, feedback from the stakeholder groups would be compared to determine areas of agreement as well as areas of divergence