

Key Insights
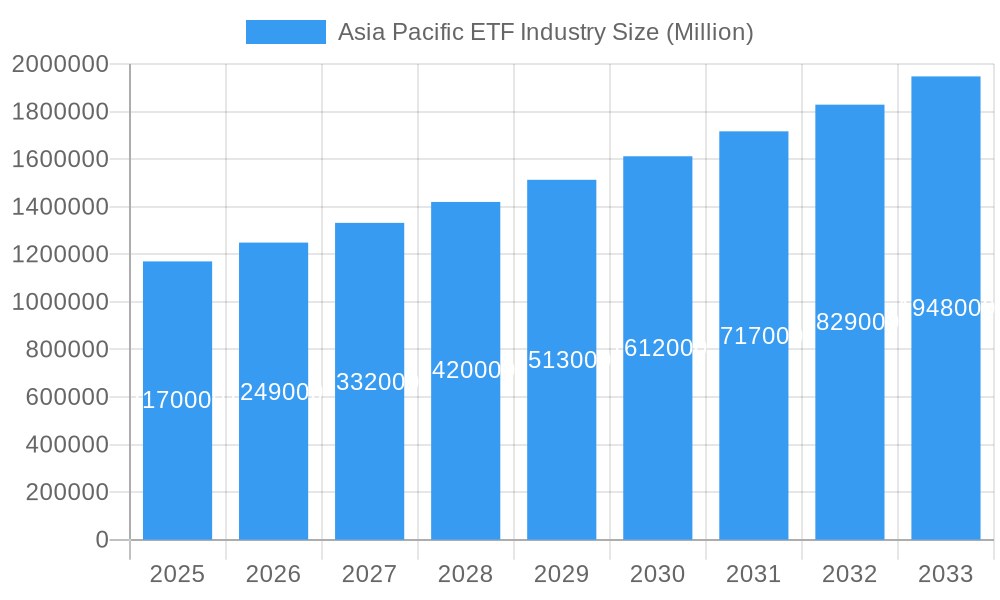
The Asia Pacific exchange-traded fund (ETF) industry is experiencing robust growth, projected to reach a market size of $1.17 trillion in 2025, exhibiting a Compound Annual Growth Rate (CAGR) of 6.59% from 2019 to 2033. This expansion is driven by several key factors. Increasing investor awareness of ETFs' benefits—diversification, low cost, and ease of access—fuels their adoption among retail and institutional investors across the region. Furthermore, the rise of fintech and digital investment platforms simplifies ETF investing, broadening participation. Favorable regulatory environments in many Asia-Pacific markets, coupled with economic growth and increasing household savings, are also significant contributors. The industry's growth is segmented across various asset classes, with strong performances in equities, fixed income, and potentially thematic ETFs focused on emerging technologies and sustainable investments. Competition amongst established players like BlackRock's iShares, Nikko Asset Management, and others, is driving innovation and enhancing product offerings, further stimulating market growth.
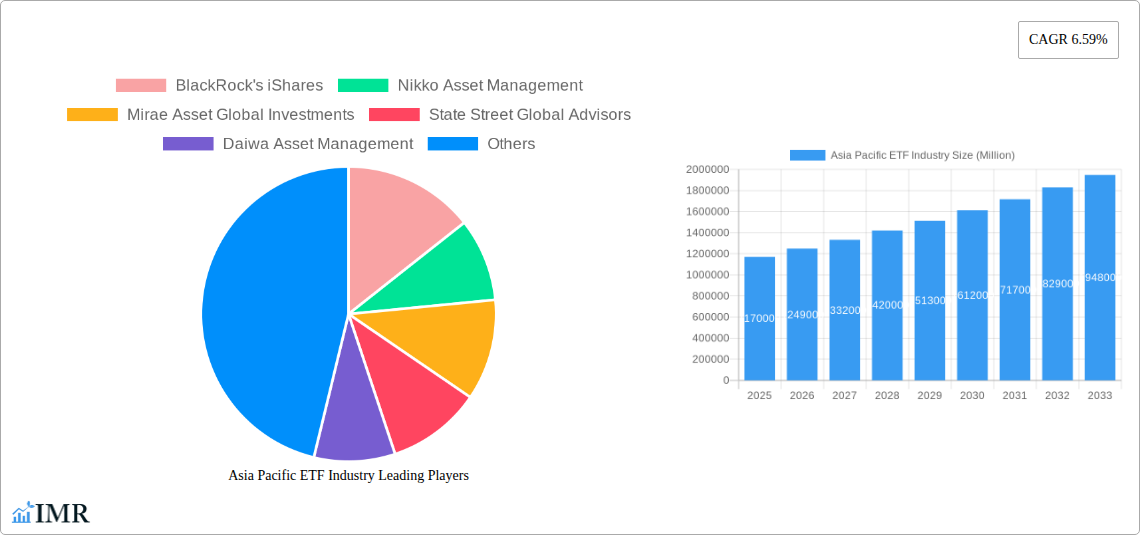
Asia Pacific ETF Industry Market Size (In Million)
However, challenges remain. Geopolitical uncertainties and macroeconomic volatility can impact investor sentiment and investment flows. Regulatory changes and evolving market structures may also present hurdles. Despite these potential restraints, the long-term outlook for the Asia-Pacific ETF market remains positive. The region's expanding middle class, rising disposable incomes, and increasing financial literacy are poised to fuel continued demand for diversified investment products, such as ETFs, in the years to come. The focus will likely shift towards innovative products tailored to specific regional needs and preferences, fostering a dynamic and evolving industry landscape.
Asia Pacific ETF Industry Company Market Share
Asia Pacific ETF Industry: 2019-2033 Market Outlook & Forecast Report
This comprehensive report provides an in-depth analysis of the Asia Pacific Exchange-Traded Funds (ETF) industry, covering market dynamics, growth trends, key players, and future outlook. With a study period spanning 2019-2033, a base year of 2025, and a forecast period of 2025-2033, this report offers invaluable insights for industry professionals, investors, and strategic decision-makers. The report analyzes parent markets (e.g., investment management) and child markets (e.g., specific ETF segments like equity, fixed income, etc.) to provide a granular understanding of the market landscape. Market values are presented in millions.
Asia Pacific ETF Industry Market Dynamics & Structure
The Asia Pacific ETF market is experiencing significant growth, driven by factors such as increasing investor awareness, technological advancements, and favorable regulatory environments. Market concentration is moderate, with several major players holding significant market share, alongside a growing number of niche players. Technological innovation, particularly in areas like algorithmic trading and data analytics, is transforming the industry. Regulatory frameworks, while generally supportive, vary across different jurisdictions within the region, presenting both opportunities and challenges. Competitive product substitutes, such as mutual funds, exist, but ETFs' advantages in terms of transparency, cost-effectiveness, and ease of trading are driving their adoption. End-user demographics are diversifying, with both retail and institutional investors increasingly adopting ETFs. M&A activity has been relatively robust in recent years, with larger players consolidating their market positions.
- Market Concentration: Moderate, with the top 5 players holding approximately xx% market share in 2024 (estimated).
- Technological Innovation: Focus on algorithmic trading, data analytics, and improved trading platforms.
- Regulatory Frameworks: Vary across countries, influencing market access and product offerings.
- Competitive Substitutes: Mutual funds pose the primary competition.
- M&A Activity: xx deals recorded between 2019-2024, with a predicted xx deals for 2025-2033.
- Innovation Barriers: High initial investment costs for technology and regulatory compliance.
Asia Pacific ETF Industry Growth Trends & Insights
The Asia Pacific ETF market is projected to experience robust growth during the forecast period (2025-2033). The market size, currently valued at xx million in 2024 (estimated), is expected to reach xx million by 2033, exhibiting a CAGR of xx%. This growth is fueled by rising investor sophistication, increasing demand for passive investment strategies, and a growing awareness of ETFs' benefits. Technological disruptions, such as the rise of robo-advisors and fractional ETF investing, are further accelerating market expansion. Consumer behavior is shifting towards a more digitally-driven approach to investing, boosting the adoption of online ETF trading platforms. Market penetration remains relatively low in several countries, presenting substantial untapped potential.
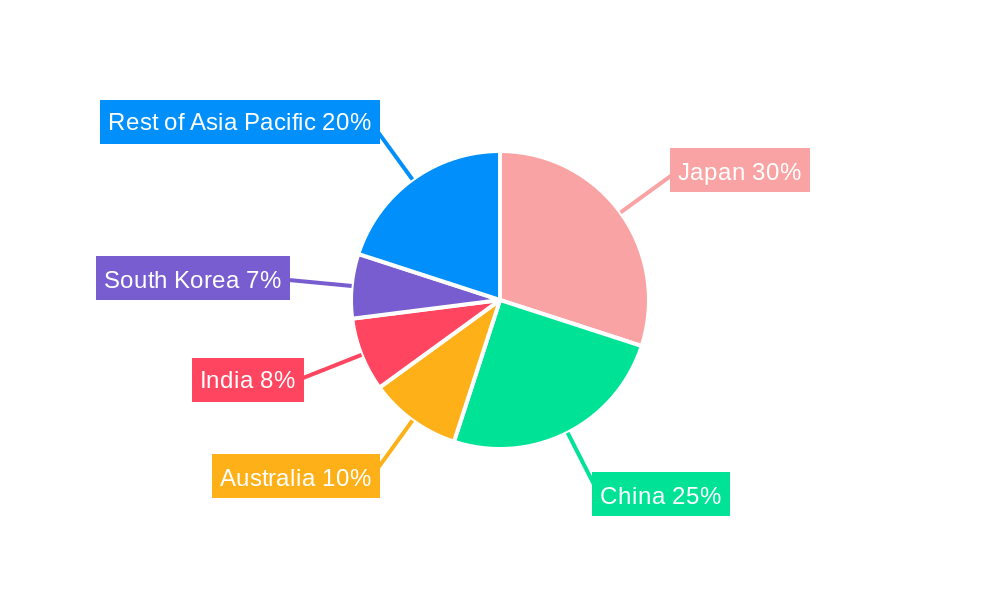
Dominant Regions, Countries, or Segments in Asia Pacific ETF Industry
Japan, Australia, and Hong Kong currently dominate the Asia Pacific ETF market. Japan's well-established capital markets and sophisticated investor base contribute to its leading position. Australia benefits from its robust regulatory framework and a growing investor awareness of ETFs. Hong Kong's strategic location and access to Chinese and international markets position it as a key regional hub. However, rapidly developing markets like South Korea, Singapore, and India show immense growth potential, fueled by a combination of factors:
- Japan: Established markets, sophisticated investors, and strong regulatory environment.
- Australia: Robust regulatory framework and growing investor awareness of ETFs.
- Hong Kong: Strategic location and access to Chinese and international markets.
- South Korea: Increasing retail investor participation and government initiatives.
- India: Growing middle class, rising disposable incomes, and increasing financial literacy.
- Singapore: Strong regulatory framework and sophisticated investment culture.
Asia Pacific ETF Industry Product Landscape
The Asia Pacific ETF market offers a diverse range of products, including equity ETFs, fixed-income ETFs, commodity ETFs, and thematic ETFs. Product innovation is ongoing, with a focus on developing ETFs that cater to specific investor needs and market trends, such as ESG-focused ETFs, smart beta ETFs, and leveraged/inverse ETFs. Performance metrics are closely monitored, with key indicators including expense ratios, tracking error, and liquidity. Unique selling propositions often center around cost efficiency, diversification, and transparency. Technological advancements, such as blockchain technology for enhanced security and transparency, are also transforming the product landscape.
Key Drivers, Barriers & Challenges in Asia Pacific ETF Industry
Key Drivers: Increased investor awareness of ETFs' benefits, favorable regulatory environments in key markets, technological advancements in trading platforms, and the growth of robo-advisors driving adoption.
Challenges: High initial investment costs for product development and marketing, regulatory hurdles in some markets, intense competition among established and emerging players, and varying levels of investor sophistication across the region. These challenges limit market penetration and growth.
Emerging Opportunities in Asia Pacific ETF Industry
Emerging opportunities include the expansion into untapped markets within the Asia Pacific region (e.g., Vietnam, the Philippines), the development of innovative ETF products catering to specific investor needs (e.g., thematic ETFs), and the harnessing of fintech to improve accessibility and efficiency of ETF trading. Growth in ESG investing and demand for sustainable investment options present further opportunities.
Growth Accelerators in the Asia Pacific ETF Industry Industry
Several factors are poised to accelerate long-term growth: technological breakthroughs enhancing trading efficiency, strategic partnerships between ETF providers and financial institutions expanding distribution channels, and government initiatives promoting financial inclusion and market development. The ongoing expansion of ETFs into underserved markets within the Asia Pacific region will also drive growth.
Key Players Shaping the Asia Pacific ETF Industry Market
- BlackRock's iShares
- Nikko Asset Management
- Mirae Asset Global Investments
- State Street Global Advisors
- Daiwa Asset Management
- Mitsubishi UFJ Financial Group
- Samsung Asset Management
- Fortune SG Fund Management
- China Asset Management
- Nomura Asset Management Co Ltd
- List Not Exhaustive
Notable Milestones in Asia Pacific ETF Industry Sector
- December 2022: Launch of the US Equity (Dow Average) ETF by Nikko Asset Management Co. Ltd on the Tokyo Stock Exchange, featuring no currency hedge.
- May 2023: Partnership between Nomura Investor Relations Co. Ltd, Nomura Securities Co. Ltd, and QUICK Corp. to launch a sponsored research company.
In-Depth Asia Pacific ETF Industry Market Outlook
The Asia Pacific ETF market is poised for sustained growth, driven by increased investor participation, technological innovation, and favorable regulatory developments. Strategic opportunities abound for existing players to consolidate market share and for new entrants to capitalize on untapped market segments. The focus on developing tailored products, enhancing technological capabilities, and expanding distribution networks will be crucial for success in this dynamic and evolving market.
Asia Pacific ETF Industry Segmentation
-
1. Types of ETFs
- 1.1. Fixed Income ETFs
- 1.2. Equity ETFs
- 1.3. Commodity ETFs
- 1.4. Currency ETFs
- 1.5. Real Estate ETFs
- 1.6. Specialty ETFs
Asia Pacific ETF Industry Segmentation By Geography
-
1. Asia Pacific
- 1.1. China
- 1.2. Japan
- 1.3. South Korea
- 1.4. India
- 1.5. Australia
- 1.6. New Zealand
- 1.7. Indonesia
- 1.8. Malaysia
- 1.9. Singapore
- 1.10. Thailand
- 1.11. Vietnam
- 1.12. Philippines
Asia Pacific ETF Industry Regional Market Share
Geographic Coverage of Asia Pacific ETF Industry
Asia Pacific ETF Industry REPORT HIGHLIGHTS
| Aspects | Details |
|---|---|
| Study Period | 2020-2034 |
| Base Year | 2025 |
| Estimated Year | 2026 |
| Forecast Period | 2026-2034 |
| Historical Period | 2020-2025 |
| Growth Rate | CAGR of 6.59% from 2020-2034 |
| Segmentation |
|
Table of Contents
- 1. Introduction
- 1.1. Research Scope
- 1.2. Market Segmentation
- 1.3. Research Objective
- 1.4. Definitions and Assumptions
- 2. Executive Summary
- 2.1. Market Snapshot
- 3. Market Dynamics
- 3.1. Market Drivers
- 3.2. Market Restrains
- 3.3. Market Trends
- 3.4. Market Opportunities
- 4. Market Factor Analysis
- 4.1. Porters Five Forces
- 4.1.1. Bargaining Power of Suppliers
- 4.1.2. Bargaining Power of Buyers
- 4.1.3. Threat of New Entrants
- 4.1.4. Threat of Substitutes
- 4.1.5. Competitive Rivalry
- 4.2. PESTEL analysis
- 4.3. BCG Analysis
- 4.3.1. Stars (High Growth, High Market Share)
- 4.3.2. Cash Cows (Low Growth, High Market Share)
- 4.3.3. Question Mark (High Growth, Low Market Share)
- 4.3.4. Dogs (Low Growth, Low Market Share)
- 4.4. Ansoff Matrix Analysis
- 4.5. Supply Chain Analysis
- 4.6. Regulatory Landscape
- 4.7. Current Market Potential and Opportunity Assessment (TAM–SAM–SOM Framework)
- 4.8. IMR Analyst Note
- 4.1. Porters Five Forces
- 5. Market Analysis, Insights and Forecast 2021-2033
- 5.1. Market Analysis, Insights and Forecast - by Types of ETFs
- 5.1.1. Fixed Income ETFs
- 5.1.2. Equity ETFs
- 5.1.3. Commodity ETFs
- 5.1.4. Currency ETFs
- 5.1.5. Real Estate ETFs
- 5.1.6. Specialty ETFs
- 5.2. Market Analysis, Insights and Forecast - by Region
- 5.2.1. Asia Pacific
- 5.1. Market Analysis, Insights and Forecast - by Types of ETFs
- 6. Asia Pacific ETF Industry Analysis, Insights and Forecast, 2021-2033
- 6.1. Market Analysis, Insights and Forecast - by Types of ETFs
- 6.1.1. Fixed Income ETFs
- 6.1.2. Equity ETFs
- 6.1.3. Commodity ETFs
- 6.1.4. Currency ETFs
- 6.1.5. Real Estate ETFs
- 6.1.6. Specialty ETFs
- 6.1. Market Analysis, Insights and Forecast - by Types of ETFs
- 7. Competitive Analysis
- 7.1. Company Profiles
- 7.1.1 BlackRock's iShares
- 7.1.1.1. Company Overview
- 7.1.1.2. Products
- 7.1.1.3. Company Financials
- 7.1.1.4. SWOT Analysis
- 7.1.2 Nikko Asset Management
- 7.1.2.1. Company Overview
- 7.1.2.2. Products
- 7.1.2.3. Company Financials
- 7.1.2.4. SWOT Analysis
- 7.1.3 Mirae Asset Global Investments
- 7.1.3.1. Company Overview
- 7.1.3.2. Products
- 7.1.3.3. Company Financials
- 7.1.3.4. SWOT Analysis
- 7.1.4 State Street Global Advisors
- 7.1.4.1. Company Overview
- 7.1.4.2. Products
- 7.1.4.3. Company Financials
- 7.1.4.4. SWOT Analysis
- 7.1.5 Daiwa Asset Management
- 7.1.5.1. Company Overview
- 7.1.5.2. Products
- 7.1.5.3. Company Financials
- 7.1.5.4. SWOT Analysis
- 7.1.6 Mitsubishi UFJ Financial Group
- 7.1.6.1. Company Overview
- 7.1.6.2. Products
- 7.1.6.3. Company Financials
- 7.1.6.4. SWOT Analysis
- 7.1.7 Samsung Asset Management
- 7.1.7.1. Company Overview
- 7.1.7.2. Products
- 7.1.7.3. Company Financials
- 7.1.7.4. SWOT Analysis
- 7.1.8 Fortune SG Fund Management
- 7.1.8.1. Company Overview
- 7.1.8.2. Products
- 7.1.8.3. Company Financials
- 7.1.8.4. SWOT Analysis
- 7.1.9 China Asset Management
- 7.1.9.1. Company Overview
- 7.1.9.2. Products
- 7.1.9.3. Company Financials
- 7.1.9.4. SWOT Analysis
- 7.1.10 Nomura Asset Management Co Ltd**List Not Exhaustive
- 7.1.10.1. Company Overview
- 7.1.10.2. Products
- 7.1.10.3. Company Financials
- 7.1.10.4. SWOT Analysis
- 7.1.1 BlackRock's iShares
- 7.2. Market Entropy
- 7.2.1 Company's Key Areas Served
- 7.2.2 Recent Developments
- 7.3. Company Market Share Analysis 2025
- 7.3.1 Top 5 Companies Market Share Analysis
- 7.3.2 Top 3 Companies Market Share Analysis
- 7.4. List of Potential Customers
- 8. Research Methodology
List of Figures
- Figure 1: Asia Pacific ETF Industry Revenue Breakdown (Million, %) by Product 2025 & 2033
- Figure 2: Asia Pacific ETF Industry Share (%) by Company 2025
List of Tables
- Table 1: Asia Pacific ETF Industry Revenue Million Forecast, by Types of ETFs 2020 & 2033
- Table 2: Asia Pacific ETF Industry Volume Trillion Forecast, by Types of ETFs 2020 & 2033
- Table 3: Asia Pacific ETF Industry Revenue Million Forecast, by Region 2020 & 2033
- Table 4: Asia Pacific ETF Industry Volume Trillion Forecast, by Region 2020 & 2033
- Table 5: Asia Pacific ETF Industry Revenue Million Forecast, by Types of ETFs 2020 & 2033
- Table 6: Asia Pacific ETF Industry Volume Trillion Forecast, by Types of ETFs 2020 & 2033
- Table 7: Asia Pacific ETF Industry Revenue Million Forecast, by Country 2020 & 2033
- Table 8: Asia Pacific ETF Industry Volume Trillion Forecast, by Country 2020 & 2033
- Table 9: China Asia Pacific ETF Industry Revenue (Million) Forecast, by Application 2020 & 2033
- Table 10: China Asia Pacific ETF Industry Volume (Trillion) Forecast, by Application 2020 & 2033
- Table 11: Japan Asia Pacific ETF Industry Revenue (Million) Forecast, by Application 2020 & 2033
- Table 12: Japan Asia Pacific ETF Industry Volume (Trillion) Forecast, by Application 2020 & 2033
- Table 13: South Korea Asia Pacific ETF Industry Revenue (Million) Forecast, by Application 2020 & 2033
- Table 14: South Korea Asia Pacific ETF Industry Volume (Trillion) Forecast, by Application 2020 & 2033
- Table 15: India Asia Pacific ETF Industry Revenue (Million) Forecast, by Application 2020 & 2033
- Table 16: India Asia Pacific ETF Industry Volume (Trillion) Forecast, by Application 2020 & 2033
- Table 17: Australia Asia Pacific ETF Industry Revenue (Million) Forecast, by Application 2020 & 2033
- Table 18: Australia Asia Pacific ETF Industry Volume (Trillion) Forecast, by Application 2020 & 2033
- Table 19: New Zealand Asia Pacific ETF Industry Revenue (Million) Forecast, by Application 2020 & 2033
- Table 20: New Zealand Asia Pacific ETF Industry Volume (Trillion) Forecast, by Application 2020 & 2033
- Table 21: Indonesia Asia Pacific ETF Industry Revenue (Million) Forecast, by Application 2020 & 2033
- Table 22: Indonesia Asia Pacific ETF Industry Volume (Trillion) Forecast, by Application 2020 & 2033
- Table 23: Malaysia Asia Pacific ETF Industry Revenue (Million) Forecast, by Application 2020 & 2033
- Table 24: Malaysia Asia Pacific ETF Industry Volume (Trillion) Forecast, by Application 2020 & 2033
- Table 25: Singapore Asia Pacific ETF Industry Revenue (Million) Forecast, by Application 2020 & 2033
- Table 26: Singapore Asia Pacific ETF Industry Volume (Trillion) Forecast, by Application 2020 & 2033
- Table 27: Thailand Asia Pacific ETF Industry Revenue (Million) Forecast, by Application 2020 & 2033
- Table 28: Thailand Asia Pacific ETF Industry Volume (Trillion) Forecast, by Application 2020 & 2033
- Table 29: Vietnam Asia Pacific ETF Industry Revenue (Million) Forecast, by Application 2020 & 2033
- Table 30: Vietnam Asia Pacific ETF Industry Volume (Trillion) Forecast, by Application 2020 & 2033
- Table 31: Philippines Asia Pacific ETF Industry Revenue (Million) Forecast, by Application 2020 & 2033
- Table 32: Philippines Asia Pacific ETF Industry Volume (Trillion) Forecast, by Application 2020 & 2033
Frequently Asked Questions
1. What is the projected Compound Annual Growth Rate (CAGR) of the Asia Pacific ETF Industry?
The projected CAGR is approximately 6.59%.
2. Which companies are prominent players in the Asia Pacific ETF Industry?
Key companies in the market include BlackRock's iShares, Nikko Asset Management, Mirae Asset Global Investments, State Street Global Advisors, Daiwa Asset Management, Mitsubishi UFJ Financial Group, Samsung Asset Management, Fortune SG Fund Management, China Asset Management, Nomura Asset Management Co Ltd**List Not Exhaustive.
3. What are the main segments of the Asia Pacific ETF Industry?
The market segments include Types of ETFs.
4. Can you provide details about the market size?
The market size is estimated to be USD 1.17 Million as of 2022.
5. What are some drivers contributing to market growth?
Accessible Investment Platforms; Growing Culture of Financial Investment.
6. What are the notable trends driving market growth?
Equity ETFs Dominate the ETF Market.
7. Are there any restraints impacting market growth?
Accessible Investment Platforms; Growing Culture of Financial Investment.
8. Can you provide examples of recent developments in the market?
May 2023: Nomura Investor Relations Co. Ltd ("Nomura IR") and Nomura Securities Co. Ltd ("Nomura Securities") partnered with QUICK Corp. to run a sponsored research company.
9. What pricing options are available for accessing the report?
Pricing options include single-user, multi-user, and enterprise licenses priced at USD 4750, USD 4950, and USD 6800 respectively.
10. Is the market size provided in terms of value or volume?
The market size is provided in terms of value, measured in Million and volume, measured in Trillion.
11. Are there any specific market keywords associated with the report?
Yes, the market keyword associated with the report is "Asia Pacific ETF Industry," which aids in identifying and referencing the specific market segment covered.
12. How do I determine which pricing option suits my needs best?
The pricing options vary based on user requirements and access needs. Individual users may opt for single-user licenses, while businesses requiring broader access may choose multi-user or enterprise licenses for cost-effective access to the report.
13. Are there any additional resources or data provided in the Asia Pacific ETF Industry report?
While the report offers comprehensive insights, it's advisable to review the specific contents or supplementary materials provided to ascertain if additional resources or data are available.
14. How can I stay updated on further developments or reports in the Asia Pacific ETF Industry?
To stay informed about further developments, trends, and reports in the Asia Pacific ETF Industry, consider subscribing to industry newsletters, following relevant companies and organizations, or regularly checking reputable industry news sources and publications.
Methodology
Step 1 - Identification of Relevant Samples Size from Population Database


Step 2 - Approaches for Defining Global Market Size (Value, Volume* & Price*)

Note*: In applicable scenarios
Step 3 - Data Sources
Primary Research
- Web Analytics
- Survey Reports
- Research Institute
- Latest Research Reports
- Opinion Leaders
Secondary Research
- Annual Reports
- White Paper
- Latest Press Release
- Industry Association
- Paid Database
- Investor Presentations

Step 4 - Data Triangulation
Involves using different sources of information in order to increase the validity of a study
These sources are likely to be stakeholders in a program - participants, other researchers, program staff, other community members, and so on.
Then we put all data in single framework & apply various statistical tools to find out the dynamic on the market.
During the analysis stage, feedback from the stakeholder groups would be compared to determine areas of agreement as well as areas of divergence