

Key Insights
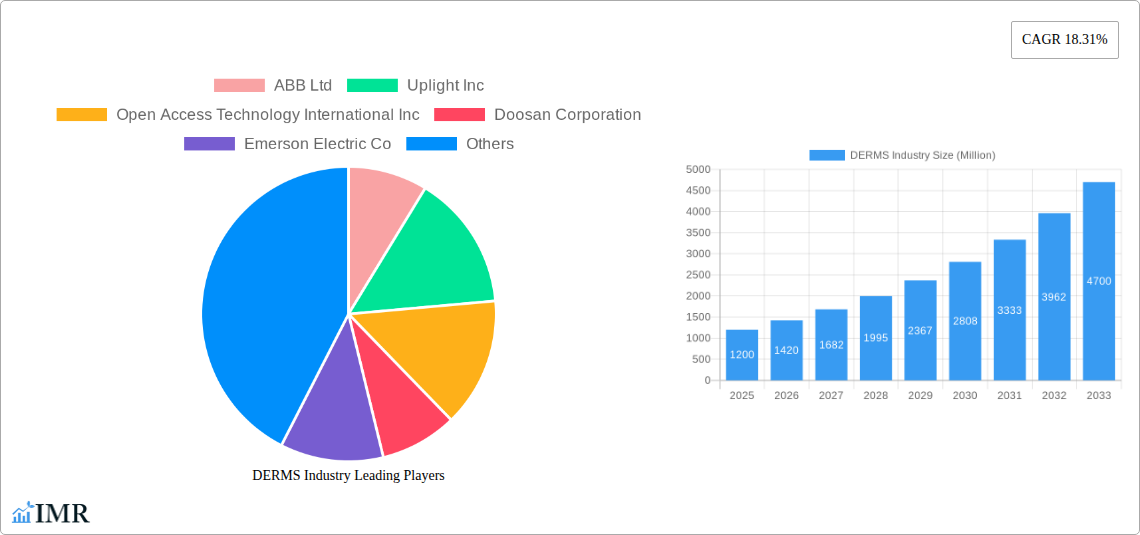
The Distributed Energy Resource Management System (DERMS) market is experiencing robust growth, projected to reach $1.20 billion in 2025 and maintain a Compound Annual Growth Rate (CAGR) of 18.31% from 2025 to 2033. This expansion is fueled by several key factors. The increasing integration of renewable energy sources, such as solar photovoltaic (PV) and wind power, necessitates sophisticated management systems to optimize energy distribution and grid stability. Simultaneously, the proliferation of electric vehicles (EVs) and the growing adoption of microgrids are placing significant strain on existing infrastructure, creating a strong demand for DERMS solutions capable of handling fluctuating energy loads and ensuring reliable power supply. Furthermore, stringent government regulations aimed at reducing carbon emissions and improving grid efficiency are incentivizing the adoption of DERMS technologies. The industrial sector is a primary driver of market growth, followed by the commercial and residential sectors. Key players like ABB, Siemens, and Schneider Electric are actively investing in R&D and strategic partnerships to capitalize on this burgeoning market. Technological advancements in areas like artificial intelligence (AI) and machine learning (ML) are further enhancing the capabilities of DERMS, enabling improved forecasting, control, and optimization of distributed energy resources.
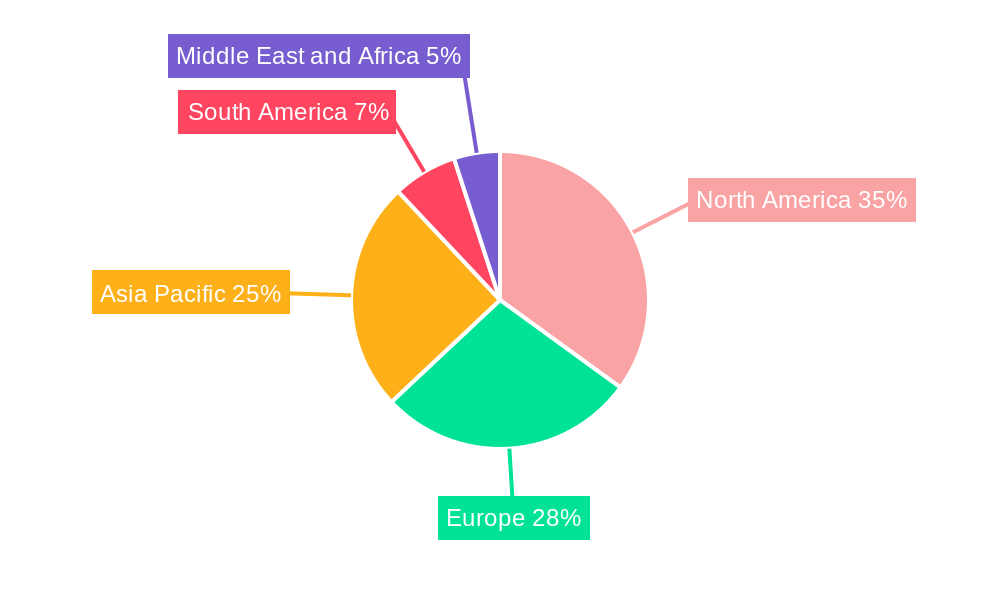
The geographic distribution of the DERMS market reflects the varying levels of renewable energy adoption and infrastructure development across regions. North America, particularly the United States, is expected to hold a substantial market share due to significant investments in renewable energy and smart grid initiatives. Europe is another key region, driven by strong government policies supporting renewable energy integration and grid modernization. The Asia-Pacific region, especially China and India, is poised for significant growth owing to rapid economic development and increasing energy demand, leading to substantial investments in renewable energy infrastructure and smart grids. However, challenges remain, including high initial investment costs for DERMS implementation and the need for skilled workforce to manage and maintain these complex systems. Overcoming these barriers will be crucial for realizing the full potential of the DERMS market and facilitating the transition towards a more sustainable and resilient energy future.
DERMS Industry Market Report: 2019-2033
This comprehensive report provides an in-depth analysis of the Distributed Energy Resource Management System (DERMS) industry, encompassing market dynamics, growth trends, regional dominance, product landscape, challenges, opportunities, and key players. The study period covers 2019-2033, with a base year of 2025 and a forecast period of 2025-2033. The report examines the parent market of energy management systems and the child market of DERMS, providing granular insights for industry professionals, investors, and strategic decision-makers. The total market size is projected to reach xx Million by 2033.
DERMS Industry Market Dynamics & Structure
The DERMS market is experiencing significant growth driven by the increasing adoption of renewable energy sources and the need for efficient grid management. Market concentration is moderate, with key players holding significant shares but facing competition from emerging technology providers. Technological innovation, particularly in AI and machine learning, is a major driver, enabling advanced analytics and predictive capabilities. Regulatory frameworks, varying by region, influence adoption rates and investment decisions. Competitive product substitutes, such as legacy grid management systems, are gradually being replaced by more flexible and scalable DERMS solutions. The end-user demographics are diverse, encompassing residential, commercial, and industrial sectors, each presenting unique opportunities and challenges. M&A activity is expected to remain strong, with larger companies acquiring smaller DERMS providers to expand their capabilities and market reach.
- Market Concentration: Moderate, with top 5 players holding approximately xx% market share in 2025.
- Technological Innovation: AI, machine learning, and advanced analytics are key drivers, improving grid optimization and renewable energy integration.
- Regulatory Frameworks: Vary significantly by region, impacting adoption rates and investment.
- Competitive Substitutes: Legacy grid management systems are facing increasing competition from DERMS solutions.
- End-User Demographics: Residential, commercial, and industrial sectors present diverse market segments.
- M&A Trends: Consolidation expected to continue, with larger companies acquiring smaller players. An estimated xx M&A deals are projected between 2025 and 2033.
DERMS Industry Growth Trends & Insights
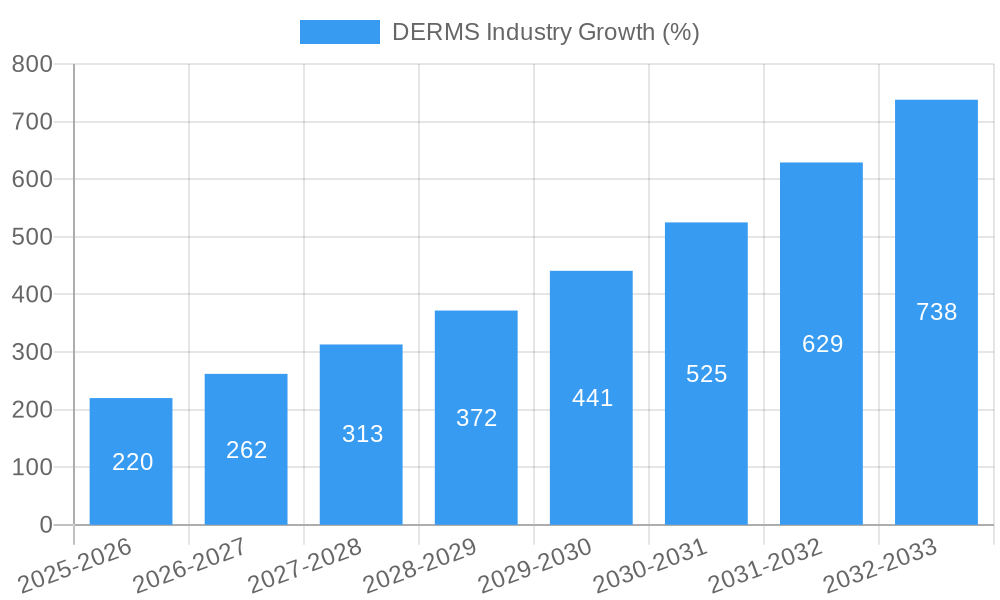
The DERMS market is experiencing robust growth, driven by factors such as the increasing penetration of renewable energy sources (like solar PV and wind), the rise of electric vehicles, the growing adoption of microgrids, and supportive government policies promoting grid modernization. The market size is projected to witness a Compound Annual Growth Rate (CAGR) of xx% during the forecast period (2025-2033), expanding from xx Million in 2025 to xx Million by 2033. This growth is fueled by technological advancements in areas such as AI and IoT, which enhance the efficiency and capabilities of DERMS solutions. Consumer behavior shifts towards sustainability and increased energy awareness are also bolstering market adoption. Market penetration is expected to increase from xx% in 2025 to xx% by 2033. Technological disruptions, particularly in areas like blockchain and edge computing, will further shape the future of the DERMS market.
Dominant Regions, Countries, or Segments in DERMS Industry
North America is expected to dominate the DERMS market through 2033, driven by strong government support for renewable energy integration and advanced grid technologies. Europe follows closely, with robust renewable energy targets and evolving regulatory landscapes fostering growth. Asia-Pacific is projected for significant growth, though regulatory and infrastructural challenges need addressing.
Dominant Segments:
- Technology: Solar Photovoltaic (PV) is the leading technology segment, benefiting from the rapid expansion of solar energy installations.
- End User: The commercial sector is a significant growth driver due to high energy consumption and cost-saving incentives.
Key Drivers:
- Strong government support for renewable energy integration.
- Increasing adoption of solar PV and other renewable energy sources.
- Investment in smart grid infrastructure.
- Demand for improved grid reliability and resilience.
DERMS Industry Product Landscape
DERMS solutions are evolving to incorporate advanced analytics, predictive capabilities, and improved user interfaces. Key product innovations include AI-powered optimization algorithms, enhanced cybersecurity features, and integration with various renewable energy sources. The unique selling propositions of different DERMS offerings lie in their ability to effectively manage and optimize distributed energy resources, minimizing costs and maximizing grid efficiency. Technological advancements are focusing on scalability, interoperability, and improved data analytics for better decision-making.
Key Drivers, Barriers & Challenges in DERMS Industry
Key Drivers:
- The growing adoption of renewable energy sources (solar, wind) necessitates efficient grid management.
- Government incentives and policies supporting grid modernization and renewable energy integration.
- The increasing demand for improved grid resilience and reliability.
Key Challenges:
- High initial investment costs for implementing DERMS solutions can be a barrier to adoption, particularly for smaller utilities.
- Interoperability issues between different DERMS systems and devices remain a challenge.
- Cybersecurity threats pose a significant risk to the security and integrity of DERMS systems. (Estimated xx Million in annual losses due to cybersecurity breaches by 2033).
Emerging Opportunities in DERMS Industry
- Growth in microgrid deployments: Microgrids offer resilience and sustainability benefits, driving DERMS demand.
- Integration of energy storage systems: Batteries and other storage technologies enhance grid stability.
- Expansion into developing economies: Emerging markets represent untapped growth potential.
Growth Accelerators in the DERMS Industry
Technological breakthroughs in AI, machine learning, and edge computing are accelerating DERMS adoption. Strategic partnerships between technology providers and utility companies are creating innovative solutions. Market expansion strategies focusing on developing economies and niche applications (e.g., smart cities) are fueling growth.
Key Players Shaping the DERMS Industry Market
- ABB Ltd
- Uplight Inc
- Open Access Technology International Inc
- Doosan Corporation
- Emerson Electric Co
- Mitsubishi Electric Corporation
- Siemens AG
- Schneider Electric SE
- Oracle Corporation
- Engie SA
- General Electric Company
Notable Milestones in DERMS Industry Sector
- February 2024: 774 grid modernization actions taken across 50+ US states, highlighting the growing interest in virtual power plants and grid resilience.
- January 2024: Global renewable energy capacity increased by 50% in 2023, with solar PV accounting for 75% of additions, underscoring the market's dynamic growth.
- April 2023: Alloy.ai launched new features for demand and inventory control, indicating evolving software solutions for energy management.
In-Depth DERMS Industry Market Outlook
The DERMS market is poised for continued robust growth, driven by the increasing need for efficient and resilient grids, along with the expansion of renewable energy sources. Strategic partnerships, technological advancements, and supportive regulatory environments will further propel market expansion. Untapped opportunities exist in developing economies and emerging applications, promising significant long-term growth potential. The market is expected to continue its strong trajectory, reaching significant market penetration and contributing to a more sustainable and efficient energy future.
DERMS Industry Segmentation
-
1. Technology
- 1.1. Solar Photovoltaic (PV)
- 1.2. Electric Vehicles
- 1.3. Microgrids
- 1.4. Other Technologies
-
2. End User
- 2.1. Industrial
- 2.2. Residential
- 2.3. Commercial
DERMS Industry Segmentation By Geography
-
1. North America
- 1.1. United States
- 1.2. Canada
- 1.3. Rest of North America
-
2. Europe
- 2.1. Germany
- 2.2. Italy
- 2.3. France
- 2.4. United Kingdom
- 2.5. Rest of Europe
-
3. Asia Pacific
- 3.1. India
- 3.2. China
- 3.3. Japan
- 3.4. South Korea
- 3.5. Rest of Asia Pacific
-
4. South America
- 4.1. Brazil
- 4.2. Argentina
- 4.3. Rest of South America
-
5. Middle East and Africa
- 5.1. United Arab Emirates
- 5.2. Saudi Arabia
- 5.3. Saudi Arabia
- 5.4. Rest of Middle East and Africa
DERMS Industry REPORT HIGHLIGHTS
| Aspects | Details |
|---|---|
| Study Period | 2019-2033 |
| Base Year | 2024 |
| Estimated Year | 2025 |
| Forecast Period | 2025-2033 |
| Historical Period | 2019-2024 |
| Growth Rate | CAGR of 18.31% from 2019-2033 |
| Segmentation |
|
Table of Contents
- 1. Introduction
- 1.1. Research Scope
- 1.2. Market Segmentation
- 1.3. Research Methodology
- 1.4. Definitions and Assumptions
- 2. Executive Summary
- 2.1. Introduction
- 3. Market Dynamics
- 3.1. Introduction
- 3.2. Market Drivers
- 3.2.1. 4.; Increasing Shift Toward Renewables-based Distributed Power Generation4.; Rising Investments in Smart Grid
- 3.3. Market Restrains
- 3.3.1. 4.; Expansion and Upgradation of Centralized Grid
- 3.4. Market Trends
- 3.4.1. Solar Photovoltaic (PV) Segment to Dominate the Market
- 4. Market Factor Analysis
- 4.1. Porters Five Forces
- 4.2. Supply/Value Chain
- 4.3. PESTEL analysis
- 4.4. Market Entropy
- 4.5. Patent/Trademark Analysis
- 5. Global DERMS Industry Analysis, Insights and Forecast, 2019-2031
- 5.1. Market Analysis, Insights and Forecast - by Technology
- 5.1.1. Solar Photovoltaic (PV)
- 5.1.2. Electric Vehicles
- 5.1.3. Microgrids
- 5.1.4. Other Technologies
- 5.2. Market Analysis, Insights and Forecast - by End User
- 5.2.1. Industrial
- 5.2.2. Residential
- 5.2.3. Commercial
- 5.3. Market Analysis, Insights and Forecast - by Region
- 5.3.1. North America
- 5.3.2. Europe
- 5.3.3. Asia Pacific
- 5.3.4. South America
- 5.3.5. Middle East and Africa
- 5.1. Market Analysis, Insights and Forecast - by Technology
- 6. North America DERMS Industry Analysis, Insights and Forecast, 2019-2031
- 6.1. Market Analysis, Insights and Forecast - by Technology
- 6.1.1. Solar Photovoltaic (PV)
- 6.1.2. Electric Vehicles
- 6.1.3. Microgrids
- 6.1.4. Other Technologies
- 6.2. Market Analysis, Insights and Forecast - by End User
- 6.2.1. Industrial
- 6.2.2. Residential
- 6.2.3. Commercial
- 6.1. Market Analysis, Insights and Forecast - by Technology
- 7. Europe DERMS Industry Analysis, Insights and Forecast, 2019-2031
- 7.1. Market Analysis, Insights and Forecast - by Technology
- 7.1.1. Solar Photovoltaic (PV)
- 7.1.2. Electric Vehicles
- 7.1.3. Microgrids
- 7.1.4. Other Technologies
- 7.2. Market Analysis, Insights and Forecast - by End User
- 7.2.1. Industrial
- 7.2.2. Residential
- 7.2.3. Commercial
- 7.1. Market Analysis, Insights and Forecast - by Technology
- 8. Asia Pacific DERMS Industry Analysis, Insights and Forecast, 2019-2031
- 8.1. Market Analysis, Insights and Forecast - by Technology
- 8.1.1. Solar Photovoltaic (PV)
- 8.1.2. Electric Vehicles
- 8.1.3. Microgrids
- 8.1.4. Other Technologies
- 8.2. Market Analysis, Insights and Forecast - by End User
- 8.2.1. Industrial
- 8.2.2. Residential
- 8.2.3. Commercial
- 8.1. Market Analysis, Insights and Forecast - by Technology
- 9. South America DERMS Industry Analysis, Insights and Forecast, 2019-2031
- 9.1. Market Analysis, Insights and Forecast - by Technology
- 9.1.1. Solar Photovoltaic (PV)
- 9.1.2. Electric Vehicles
- 9.1.3. Microgrids
- 9.1.4. Other Technologies
- 9.2. Market Analysis, Insights and Forecast - by End User
- 9.2.1. Industrial
- 9.2.2. Residential
- 9.2.3. Commercial
- 9.1. Market Analysis, Insights and Forecast - by Technology
- 10. Middle East and Africa DERMS Industry Analysis, Insights and Forecast, 2019-2031
- 10.1. Market Analysis, Insights and Forecast - by Technology
- 10.1.1. Solar Photovoltaic (PV)
- 10.1.2. Electric Vehicles
- 10.1.3. Microgrids
- 10.1.4. Other Technologies
- 10.2. Market Analysis, Insights and Forecast - by End User
- 10.2.1. Industrial
- 10.2.2. Residential
- 10.2.3. Commercial
- 10.1. Market Analysis, Insights and Forecast - by Technology
- 11. North America DERMS Industry Analysis, Insights and Forecast, 2019-2031
- 11.1. Market Analysis, Insights and Forecast - By Country/Sub-region
- 11.1.1 United States
- 11.1.2 Canada
- 11.1.3 Rest of North America
- 12. Europe DERMS Industry Analysis, Insights and Forecast, 2019-2031
- 12.1. Market Analysis, Insights and Forecast - By Country/Sub-region
- 12.1.1 Germany
- 12.1.2 Italy
- 12.1.3 France
- 12.1.4 United Kingdom
- 12.1.5 Rest of Europe
- 13. Asia Pacific DERMS Industry Analysis, Insights and Forecast, 2019-2031
- 13.1. Market Analysis, Insights and Forecast - By Country/Sub-region
- 13.1.1 India
- 13.1.2 China
- 13.1.3 Japan
- 13.1.4 South Korea
- 13.1.5 Rest of Asia Pacific
- 14. South America DERMS Industry Analysis, Insights and Forecast, 2019-2031
- 14.1. Market Analysis, Insights and Forecast - By Country/Sub-region
- 14.1.1 Brazil
- 14.1.2 Argentina
- 14.1.3 Rest of South America
- 15. Middle East and Africa DERMS Industry Analysis, Insights and Forecast, 2019-2031
- 15.1. Market Analysis, Insights and Forecast - By Country/Sub-region
- 15.1.1 United Arab Emirates
- 15.1.2 Saudi Arabia
- 15.1.3 Saudi Arabia
- 15.1.4 Rest of Middle East and Africa
- 16. Competitive Analysis
- 16.1. Global Market Share Analysis 2024
- 16.2. Company Profiles
- 16.2.1 ABB Ltd
- 16.2.1.1. Overview
- 16.2.1.2. Products
- 16.2.1.3. SWOT Analysis
- 16.2.1.4. Recent Developments
- 16.2.1.5. Financials (Based on Availability)
- 16.2.2 Uplight Inc
- 16.2.2.1. Overview
- 16.2.2.2. Products
- 16.2.2.3. SWOT Analysis
- 16.2.2.4. Recent Developments
- 16.2.2.5. Financials (Based on Availability)
- 16.2.3 Open Access Technology International Inc
- 16.2.3.1. Overview
- 16.2.3.2. Products
- 16.2.3.3. SWOT Analysis
- 16.2.3.4. Recent Developments
- 16.2.3.5. Financials (Based on Availability)
- 16.2.4 Doosan Corporation
- 16.2.4.1. Overview
- 16.2.4.2. Products
- 16.2.4.3. SWOT Analysis
- 16.2.4.4. Recent Developments
- 16.2.4.5. Financials (Based on Availability)
- 16.2.5 Emerson Electric Co
- 16.2.5.1. Overview
- 16.2.5.2. Products
- 16.2.5.3. SWOT Analysis
- 16.2.5.4. Recent Developments
- 16.2.5.5. Financials (Based on Availability)
- 16.2.6 Mitsubishi Electric Corporation
- 16.2.6.1. Overview
- 16.2.6.2. Products
- 16.2.6.3. SWOT Analysis
- 16.2.6.4. Recent Developments
- 16.2.6.5. Financials (Based on Availability)
- 16.2.7 Siemens AG
- 16.2.7.1. Overview
- 16.2.7.2. Products
- 16.2.7.3. SWOT Analysis
- 16.2.7.4. Recent Developments
- 16.2.7.5. Financials (Based on Availability)
- 16.2.8 Schneider Electric SE
- 16.2.8.1. Overview
- 16.2.8.2. Products
- 16.2.8.3. SWOT Analysis
- 16.2.8.4. Recent Developments
- 16.2.8.5. Financials (Based on Availability)
- 16.2.9 Oracle Corporation
- 16.2.9.1. Overview
- 16.2.9.2. Products
- 16.2.9.3. SWOT Analysis
- 16.2.9.4. Recent Developments
- 16.2.9.5. Financials (Based on Availability)
- 16.2.10 Engie SA
- 16.2.10.1. Overview
- 16.2.10.2. Products
- 16.2.10.3. SWOT Analysis
- 16.2.10.4. Recent Developments
- 16.2.10.5. Financials (Based on Availability)
- 16.2.11 General Electric Company
- 16.2.11.1. Overview
- 16.2.11.2. Products
- 16.2.11.3. SWOT Analysis
- 16.2.11.4. Recent Developments
- 16.2.11.5. Financials (Based on Availability)
- 16.2.1 ABB Ltd
List of Figures
- Figure 1: Global DERMS Industry Revenue Breakdown (Million, %) by Region 2024 & 2032
- Figure 2: North America DERMS Industry Revenue (Million), by Country 2024 & 2032
- Figure 3: North America DERMS Industry Revenue Share (%), by Country 2024 & 2032
- Figure 4: Europe DERMS Industry Revenue (Million), by Country 2024 & 2032
- Figure 5: Europe DERMS Industry Revenue Share (%), by Country 2024 & 2032
- Figure 6: Asia Pacific DERMS Industry Revenue (Million), by Country 2024 & 2032
- Figure 7: Asia Pacific DERMS Industry Revenue Share (%), by Country 2024 & 2032
- Figure 8: South America DERMS Industry Revenue (Million), by Country 2024 & 2032
- Figure 9: South America DERMS Industry Revenue Share (%), by Country 2024 & 2032
- Figure 10: Middle East and Africa DERMS Industry Revenue (Million), by Country 2024 & 2032
- Figure 11: Middle East and Africa DERMS Industry Revenue Share (%), by Country 2024 & 2032
- Figure 12: North America DERMS Industry Revenue (Million), by Technology 2024 & 2032
- Figure 13: North America DERMS Industry Revenue Share (%), by Technology 2024 & 2032
- Figure 14: North America DERMS Industry Revenue (Million), by End User 2024 & 2032
- Figure 15: North America DERMS Industry Revenue Share (%), by End User 2024 & 2032
- Figure 16: North America DERMS Industry Revenue (Million), by Country 2024 & 2032
- Figure 17: North America DERMS Industry Revenue Share (%), by Country 2024 & 2032
- Figure 18: Europe DERMS Industry Revenue (Million), by Technology 2024 & 2032
- Figure 19: Europe DERMS Industry Revenue Share (%), by Technology 2024 & 2032
- Figure 20: Europe DERMS Industry Revenue (Million), by End User 2024 & 2032
- Figure 21: Europe DERMS Industry Revenue Share (%), by End User 2024 & 2032
- Figure 22: Europe DERMS Industry Revenue (Million), by Country 2024 & 2032
- Figure 23: Europe DERMS Industry Revenue Share (%), by Country 2024 & 2032
- Figure 24: Asia Pacific DERMS Industry Revenue (Million), by Technology 2024 & 2032
- Figure 25: Asia Pacific DERMS Industry Revenue Share (%), by Technology 2024 & 2032
- Figure 26: Asia Pacific DERMS Industry Revenue (Million), by End User 2024 & 2032
- Figure 27: Asia Pacific DERMS Industry Revenue Share (%), by End User 2024 & 2032
- Figure 28: Asia Pacific DERMS Industry Revenue (Million), by Country 2024 & 2032
- Figure 29: Asia Pacific DERMS Industry Revenue Share (%), by Country 2024 & 2032
- Figure 30: South America DERMS Industry Revenue (Million), by Technology 2024 & 2032
- Figure 31: South America DERMS Industry Revenue Share (%), by Technology 2024 & 2032
- Figure 32: South America DERMS Industry Revenue (Million), by End User 2024 & 2032
- Figure 33: South America DERMS Industry Revenue Share (%), by End User 2024 & 2032
- Figure 34: South America DERMS Industry Revenue (Million), by Country 2024 & 2032
- Figure 35: South America DERMS Industry Revenue Share (%), by Country 2024 & 2032
- Figure 36: Middle East and Africa DERMS Industry Revenue (Million), by Technology 2024 & 2032
- Figure 37: Middle East and Africa DERMS Industry Revenue Share (%), by Technology 2024 & 2032
- Figure 38: Middle East and Africa DERMS Industry Revenue (Million), by End User 2024 & 2032
- Figure 39: Middle East and Africa DERMS Industry Revenue Share (%), by End User 2024 & 2032
- Figure 40: Middle East and Africa DERMS Industry Revenue (Million), by Country 2024 & 2032
- Figure 41: Middle East and Africa DERMS Industry Revenue Share (%), by Country 2024 & 2032
List of Tables
- Table 1: Global DERMS Industry Revenue Million Forecast, by Region 2019 & 2032
- Table 2: Global DERMS Industry Revenue Million Forecast, by Technology 2019 & 2032
- Table 3: Global DERMS Industry Revenue Million Forecast, by End User 2019 & 2032
- Table 4: Global DERMS Industry Revenue Million Forecast, by Region 2019 & 2032
- Table 5: Global DERMS Industry Revenue Million Forecast, by Country 2019 & 2032
- Table 6: United States DERMS Industry Revenue (Million) Forecast, by Application 2019 & 2032
- Table 7: Canada DERMS Industry Revenue (Million) Forecast, by Application 2019 & 2032
- Table 8: Rest of North America DERMS Industry Revenue (Million) Forecast, by Application 2019 & 2032
- Table 9: Global DERMS Industry Revenue Million Forecast, by Country 2019 & 2032
- Table 10: Germany DERMS Industry Revenue (Million) Forecast, by Application 2019 & 2032
- Table 11: Italy DERMS Industry Revenue (Million) Forecast, by Application 2019 & 2032
- Table 12: France DERMS Industry Revenue (Million) Forecast, by Application 2019 & 2032
- Table 13: United Kingdom DERMS Industry Revenue (Million) Forecast, by Application 2019 & 2032
- Table 14: Rest of Europe DERMS Industry Revenue (Million) Forecast, by Application 2019 & 2032
- Table 15: Global DERMS Industry Revenue Million Forecast, by Country 2019 & 2032
- Table 16: India DERMS Industry Revenue (Million) Forecast, by Application 2019 & 2032
- Table 17: China DERMS Industry Revenue (Million) Forecast, by Application 2019 & 2032
- Table 18: Japan DERMS Industry Revenue (Million) Forecast, by Application 2019 & 2032
- Table 19: South Korea DERMS Industry Revenue (Million) Forecast, by Application 2019 & 2032
- Table 20: Rest of Asia Pacific DERMS Industry Revenue (Million) Forecast, by Application 2019 & 2032
- Table 21: Global DERMS Industry Revenue Million Forecast, by Country 2019 & 2032
- Table 22: Brazil DERMS Industry Revenue (Million) Forecast, by Application 2019 & 2032
- Table 23: Argentina DERMS Industry Revenue (Million) Forecast, by Application 2019 & 2032
- Table 24: Rest of South America DERMS Industry Revenue (Million) Forecast, by Application 2019 & 2032
- Table 25: Global DERMS Industry Revenue Million Forecast, by Country 2019 & 2032
- Table 26: United Arab Emirates DERMS Industry Revenue (Million) Forecast, by Application 2019 & 2032
- Table 27: Saudi Arabia DERMS Industry Revenue (Million) Forecast, by Application 2019 & 2032
- Table 28: Saudi Arabia DERMS Industry Revenue (Million) Forecast, by Application 2019 & 2032
- Table 29: Rest of Middle East and Africa DERMS Industry Revenue (Million) Forecast, by Application 2019 & 2032
- Table 30: Global DERMS Industry Revenue Million Forecast, by Technology 2019 & 2032
- Table 31: Global DERMS Industry Revenue Million Forecast, by End User 2019 & 2032
- Table 32: Global DERMS Industry Revenue Million Forecast, by Country 2019 & 2032
- Table 33: United States DERMS Industry Revenue (Million) Forecast, by Application 2019 & 2032
- Table 34: Canada DERMS Industry Revenue (Million) Forecast, by Application 2019 & 2032
- Table 35: Rest of North America DERMS Industry Revenue (Million) Forecast, by Application 2019 & 2032
- Table 36: Global DERMS Industry Revenue Million Forecast, by Technology 2019 & 2032
- Table 37: Global DERMS Industry Revenue Million Forecast, by End User 2019 & 2032
- Table 38: Global DERMS Industry Revenue Million Forecast, by Country 2019 & 2032
- Table 39: Germany DERMS Industry Revenue (Million) Forecast, by Application 2019 & 2032
- Table 40: Italy DERMS Industry Revenue (Million) Forecast, by Application 2019 & 2032
- Table 41: France DERMS Industry Revenue (Million) Forecast, by Application 2019 & 2032
- Table 42: United Kingdom DERMS Industry Revenue (Million) Forecast, by Application 2019 & 2032
- Table 43: Rest of Europe DERMS Industry Revenue (Million) Forecast, by Application 2019 & 2032
- Table 44: Global DERMS Industry Revenue Million Forecast, by Technology 2019 & 2032
- Table 45: Global DERMS Industry Revenue Million Forecast, by End User 2019 & 2032
- Table 46: Global DERMS Industry Revenue Million Forecast, by Country 2019 & 2032
- Table 47: India DERMS Industry Revenue (Million) Forecast, by Application 2019 & 2032
- Table 48: China DERMS Industry Revenue (Million) Forecast, by Application 2019 & 2032
- Table 49: Japan DERMS Industry Revenue (Million) Forecast, by Application 2019 & 2032
- Table 50: South Korea DERMS Industry Revenue (Million) Forecast, by Application 2019 & 2032
- Table 51: Rest of Asia Pacific DERMS Industry Revenue (Million) Forecast, by Application 2019 & 2032
- Table 52: Global DERMS Industry Revenue Million Forecast, by Technology 2019 & 2032
- Table 53: Global DERMS Industry Revenue Million Forecast, by End User 2019 & 2032
- Table 54: Global DERMS Industry Revenue Million Forecast, by Country 2019 & 2032
- Table 55: Brazil DERMS Industry Revenue (Million) Forecast, by Application 2019 & 2032
- Table 56: Argentina DERMS Industry Revenue (Million) Forecast, by Application 2019 & 2032
- Table 57: Rest of South America DERMS Industry Revenue (Million) Forecast, by Application 2019 & 2032
- Table 58: Global DERMS Industry Revenue Million Forecast, by Technology 2019 & 2032
- Table 59: Global DERMS Industry Revenue Million Forecast, by End User 2019 & 2032
- Table 60: Global DERMS Industry Revenue Million Forecast, by Country 2019 & 2032
- Table 61: United Arab Emirates DERMS Industry Revenue (Million) Forecast, by Application 2019 & 2032
- Table 62: Saudi Arabia DERMS Industry Revenue (Million) Forecast, by Application 2019 & 2032
- Table 63: Saudi Arabia DERMS Industry Revenue (Million) Forecast, by Application 2019 & 2032
- Table 64: Rest of Middle East and Africa DERMS Industry Revenue (Million) Forecast, by Application 2019 & 2032
Frequently Asked Questions
1. What is the projected Compound Annual Growth Rate (CAGR) of the DERMS Industry?
The projected CAGR is approximately 18.31%.
2. Which companies are prominent players in the DERMS Industry?
Key companies in the market include ABB Ltd, Uplight Inc, Open Access Technology International Inc, Doosan Corporation, Emerson Electric Co, Mitsubishi Electric Corporation, Siemens AG, Schneider Electric SE, Oracle Corporation, Engie SA, General Electric Company.
3. What are the main segments of the DERMS Industry?
The market segments include Technology, End User.
4. Can you provide details about the market size?
The market size is estimated to be USD 1.20 Million as of 2022.
5. What are some drivers contributing to market growth?
4.; Increasing Shift Toward Renewables-based Distributed Power Generation4.; Rising Investments in Smart Grid.
6. What are the notable trends driving market growth?
Solar Photovoltaic (PV) Segment to Dominate the Market.
7. Are there any restraints impacting market growth?
4.; Expansion and Upgradation of Centralized Grid.
8. Can you provide examples of recent developments in the market?
February 2024: According to the N.C. Clean Energy Technology Center (NCCETC), a total of 774 grid modernization actions were taken in more than fifty states in 2023. The top trend in grid modernization includes the growing interest in virtual power plants, cost recovery for interconnection upgrades, examining the impacts of wholesale market participation, studying long-duration energy storage, utilities proposing new performance incentive mechanisms, undertaking grid resilience planning, utilities pursuing pilot programs and projects, utilizing green button standards for access to customer energy usage data, providing customers with demand response incentive opportunities, and utilities exploring opt-out time-varying rates.
9. What pricing options are available for accessing the report?
Pricing options include single-user, multi-user, and enterprise licenses priced at USD 4750, USD 5250, and USD 8750 respectively.
10. Is the market size provided in terms of value or volume?
The market size is provided in terms of value, measured in Million.
11. Are there any specific market keywords associated with the report?
Yes, the market keyword associated with the report is "DERMS Industry," which aids in identifying and referencing the specific market segment covered.
12. How do I determine which pricing option suits my needs best?
The pricing options vary based on user requirements and access needs. Individual users may opt for single-user licenses, while businesses requiring broader access may choose multi-user or enterprise licenses for cost-effective access to the report.
13. Are there any additional resources or data provided in the DERMS Industry report?
While the report offers comprehensive insights, it's advisable to review the specific contents or supplementary materials provided to ascertain if additional resources or data are available.
14. How can I stay updated on further developments or reports in the DERMS Industry?
To stay informed about further developments, trends, and reports in the DERMS Industry, consider subscribing to industry newsletters, following relevant companies and organizations, or regularly checking reputable industry news sources and publications.
Methodology
Step 1 - Identification of Relevant Samples Size from Population Database


Step 2 - Approaches for Defining Global Market Size (Value, Volume* & Price*)

Note*: In applicable scenarios
Step 3 - Data Sources
Primary Research
- Web Analytics
- Survey Reports
- Research Institute
- Latest Research Reports
- Opinion Leaders
Secondary Research
- Annual Reports
- White Paper
- Latest Press Release
- Industry Association
- Paid Database
- Investor Presentations

Step 4 - Data Triangulation
Involves using different sources of information in order to increase the validity of a study
These sources are likely to be stakeholders in a program - participants, other researchers, program staff, other community members, and so on.
Then we put all data in single framework & apply various statistical tools to find out the dynamic on the market.
During the analysis stage, feedback from the stakeholder groups would be compared to determine areas of agreement as well as areas of divergence
