

Key Insights
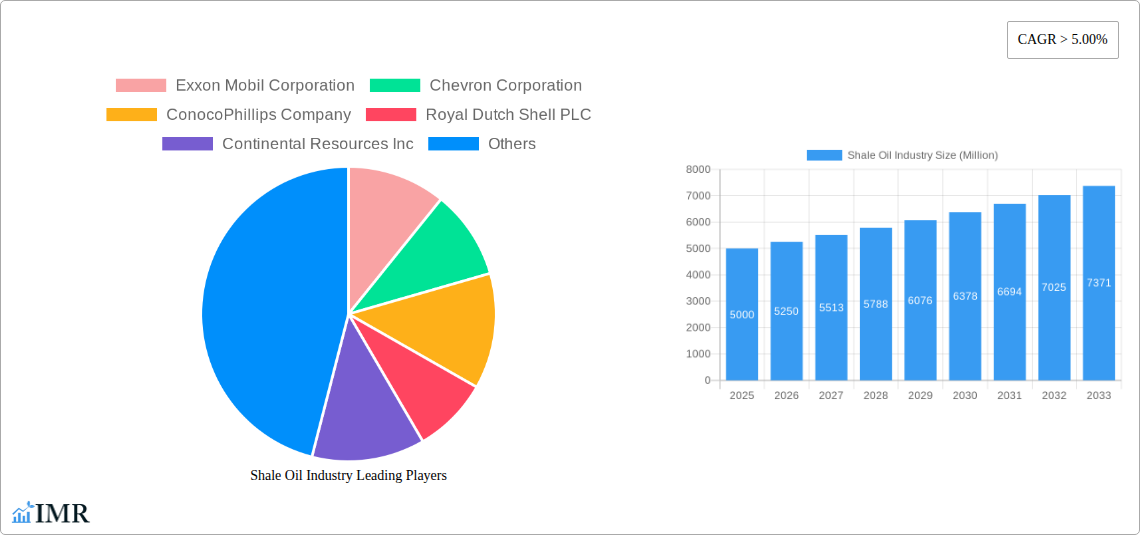
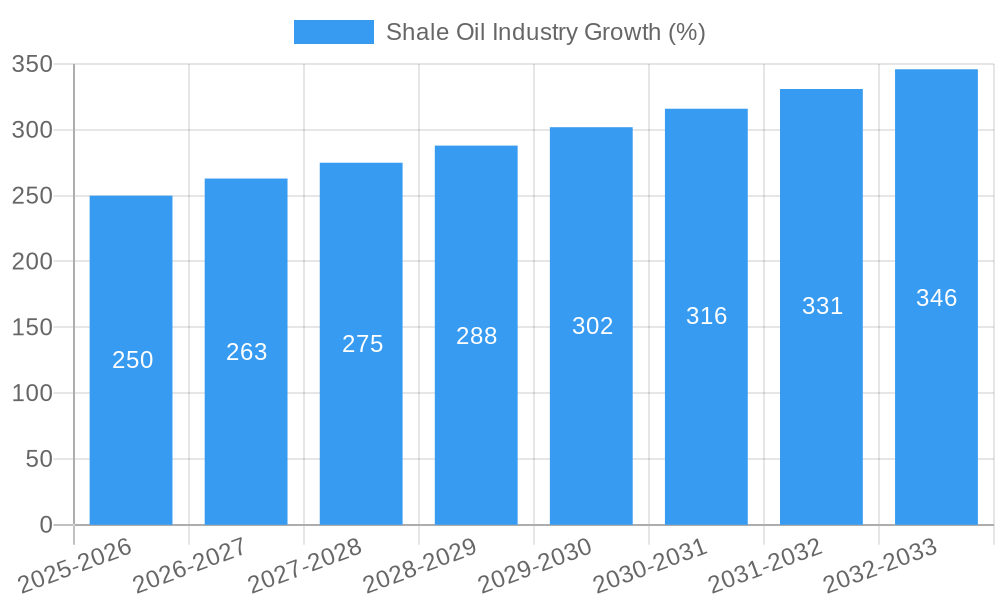
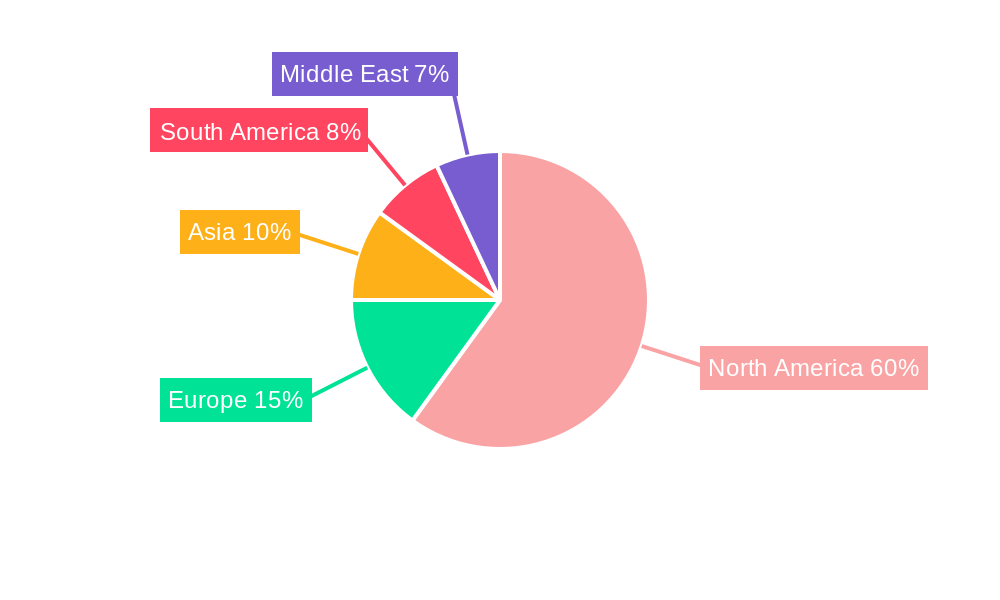
The global shale oil industry, currently experiencing robust growth with a CAGR exceeding 5%, is projected to maintain this trajectory through 2033. Several factors contribute to this positive outlook. Technological advancements in horizontal drilling and hydraulic fracturing continue to enhance extraction efficiency and reduce production costs, making shale oil increasingly competitive with conventional oil sources. Furthermore, consistent global energy demand, particularly from rapidly developing economies, fuels the need for diverse energy sources, including shale oil. Increased investment in exploration and production activities by major players like ExxonMobil, Chevron, and ConocoPhillips, further solidifies the industry's growth potential. However, the industry faces headwinds. Environmental concerns surrounding methane emissions and water usage are prompting stricter regulations and impacting operational costs. Price volatility in the oil market, influenced by geopolitical events and global economic conditions, also presents a significant challenge. Segment-wise, the market is likely diversified across various shale plays globally, with North America currently dominating due to established infrastructure and extensive reserves. The future success of the shale oil industry hinges on finding a balance between profitability, environmental stewardship, and the ability to adapt to fluctuating market conditions.
Despite challenges, the forecast for 2025-2033 remains optimistic, driven by ongoing technological innovation. The industry's response to environmental concerns will play a crucial role in shaping its long-term viability. While specific regional data is unavailable, a reasonable estimation based on existing market dynamics suggests that North America will continue to hold the largest market share, followed by regions with significant shale reserves, such as parts of Europe, South America, and the Middle East. The industry's competitive landscape is largely consolidated, with a handful of major players wielding considerable influence on pricing and production. However, smaller, more agile companies are likely to play a growing role through innovation and focusing on niche markets. The continued expansion of shale oil production will significantly impact global energy security and prices, demanding careful consideration of the environmental and geopolitical ramifications.
Shale Oil Industry Market Report: 2019-2033 Forecast
This comprehensive report provides a detailed analysis of the Shale Oil Industry, encompassing market dynamics, growth trends, regional analysis, key players, and future outlook. The study period covers 2019-2033, with 2025 as the base and estimated year. This in-depth analysis is crucial for industry professionals, investors, and strategic decision-makers seeking to navigate this dynamic market. The report segments the market into various categories and provides a granular view of the parent market (Oil & Gas Industry) and the child market (Shale Oil Extraction & Production).
Shale Oil Industry Market Dynamics & Structure
This section analyzes the competitive landscape, technological advancements, regulatory impacts, and market trends within the Shale Oil Industry. The report delves into market concentration, identifying major players and their respective market shares. It also examines the influence of technological innovation, regulatory frameworks (including environmental regulations and licensing), the availability of competitive substitutes (e.g., renewable energy sources), end-user demographics (e.g., industrial, commercial, residential), and the frequency and impact of mergers and acquisitions (M&A) activities. Quantitative data such as market share percentages and M&A deal volumes (in Millions of USD) are provided, along with qualitative assessments of innovation barriers and market dynamics.
- Market Concentration: xx% dominated by top 5 players (2025).
- Technological Innovation: Focus on enhanced oil recovery (EOR) techniques and automation.
- Regulatory Landscape: Stringent environmental regulations impacting operational costs.
- M&A Activity: xx deals valued at approximately $xx Million in the last 5 years.
- Competitive Substitutes: Growing competition from renewable energy sources impacting demand.
Shale Oil Industry Growth Trends & Insights
This section leverages extensive data and analytical methodologies to provide a comprehensive overview of the Shale Oil Industry’s growth trajectory. It details market size evolution (in Million barrels of oil equivalent), adoption rates of new technologies, the impact of technological disruptions on market dynamics, and shifts in consumer behavior. Key performance indicators (KPIs) such as compound annual growth rate (CAGR) and market penetration rates are included to provide nuanced insights into market performance. The analysis covers the historical period (2019-2024) and projects growth for the forecast period (2025-2033).
- Market Size: Projected to reach $xx Million by 2033.
- CAGR: xx% during the forecast period.
- Technological Disruptions: Increased automation leading to improved efficiency and reduced costs.
- Consumer Behavior Shifts: Growing demand for cleaner energy sources influencing industry strategies.
Dominant Regions, Countries, or Segments in Shale Oil Industry
This section pinpoints the leading regions, countries, or segments driving market growth. It examines the factors contributing to their dominance, including market share, growth potential, economic policies, and infrastructure development. The analysis includes a detailed breakdown of key drivers and insightful commentary on the factors shaping the market landscape.
- North America: Dominant region due to abundant shale reserves and established infrastructure.
- Key Drivers: Favorable government policies, technological advancements, and readily available capital.
- Market Share: xx% (2025).
- Growth Potential: Significant potential for further expansion, driven by exploration and technological progress.
Shale Oil Industry Product Landscape
This section offers a concise overview of product innovations, applications, and performance metrics within the shale oil industry. It highlights unique selling propositions of various products and services and showcases technological advancements that are shaping the market.
Technological advancements such as improved drilling techniques, hydraulic fracturing innovations, and data analytics for enhanced oil recovery (EOR) are driving efficiency and profitability in the industry. The focus is on delivering higher production rates, reduced operational costs, and environmentally friendly practices.
Key Drivers, Barriers & Challenges in Shale Oil Industry
This section outlines the key factors driving market growth, such as technological advancements, favorable economic conditions, and supportive government policies. It also addresses challenges and restraints impacting industry performance, such as supply chain issues, regulatory hurdles, and competitive pressures, providing quantifiable impacts where possible.
Key Drivers:
- Technological innovation in drilling and extraction.
- Increasing global energy demand.
- Government incentives for domestic energy production.
Key Challenges:
- Environmental concerns and regulations.
- Fluctuating oil prices.
- Water scarcity in certain production areas.
Emerging Opportunities in Shale Oil Industry
This section highlights emerging trends and opportunities within the shale oil industry, such as untapped markets, innovative applications, and evolving consumer preferences. These insights could provide valuable leads for businesses aiming to capitalize on market growth.
- Exploration in new shale basins.
- Development of cleaner and more efficient extraction technologies.
- Expansion into emerging markets with high energy demand.
Growth Accelerators in the Shale Oil Industry Industry
This section discusses the catalysts driving long-term growth in the Shale Oil Industry. It emphasizes technological breakthroughs, strategic partnerships, and market expansion strategies that are likely to significantly contribute to the industry's future trajectory.
Technological innovations, strategic partnerships, and efficient resource management are all playing a crucial role in accelerating growth in the sector. These factors are likely to enhance efficiency, reduce costs, and ensure the sustainable development of the industry.
Key Players Shaping the Shale Oil Industry Market
- Exxon Mobil Corporation
- Chevron Corporation
- ConocoPhillips Company
- Royal Dutch Shell PLC
- Continental Resources Inc
- Murphy Oil Corporation
- Occidental Petroleum Corporation
- Marathon Oil Corporation
- Schlumberger Limited
- Halliburton Company
- *List Not Exhaustive
Notable Milestones in Shale Oil Industry Sector
- July 2022: Oilex and Schlumberger secure a contract for hydraulic fracturing services in India.
- April 2022: CNX Resources and Evolution Well Services extend their contract for electric fracturing technology.
In-Depth Shale Oil Industry Market Outlook
The Shale Oil Industry is poised for continued growth, driven by technological advancements, increasing global energy demand, and strategic investments. Future market potential is substantial, particularly in regions with untapped reserves and supportive regulatory environments. Strategic opportunities exist for companies that focus on innovation, sustainability, and efficient resource management. This report presents actionable insights to facilitate informed decision-making within the sector.
Shale Oil Industry Segmentation
- 1. Production Analysis
- 2. Consumption Analysis
- 3. Import Market Analysis (Value & Volume)
- 4. Export Market Analysis (Value & Volume)
- 5. Price Trend Analysis
Shale Oil Industry Segmentation By Geography
- 1. North America
- 2. South America
- 3. Europe
- 4. Asia Pacific
- 5. Middle East and Africa
Shale Oil Industry REPORT HIGHLIGHTS
| Aspects | Details |
|---|---|
| Study Period | 2019-2033 |
| Base Year | 2024 |
| Estimated Year | 2025 |
| Forecast Period | 2025-2033 |
| Historical Period | 2019-2024 |
| Growth Rate | CAGR of > 5.00% from 2019-2033 |
| Segmentation |
|
Table of Contents
- 1. Introduction
- 1.1. Research Scope
- 1.2. Market Segmentation
- 1.3. Research Methodology
- 1.4. Definitions and Assumptions
- 2. Executive Summary
- 2.1. Introduction
- 3. Market Dynamics
- 3.1. Introduction
- 3.2. Market Drivers
- 3.3. Market Restrains
- 3.4. Market Trends
- 3.4.1. Growing Petrochemical Industry to Drive the Market
- 4. Market Factor Analysis
- 4.1. Porters Five Forces
- 4.2. Supply/Value Chain
- 4.3. PESTEL analysis
- 4.4. Market Entropy
- 4.5. Patent/Trademark Analysis
- 5. Global Shale Oil Industry Analysis, Insights and Forecast, 2019-2031
- 5.1. Market Analysis, Insights and Forecast - by Production Analysis
- 5.2. Market Analysis, Insights and Forecast - by Consumption Analysis
- 5.3. Market Analysis, Insights and Forecast - by Import Market Analysis (Value & Volume)
- 5.4. Market Analysis, Insights and Forecast - by Export Market Analysis (Value & Volume)
- 5.5. Market Analysis, Insights and Forecast - by Price Trend Analysis
- 5.6. Market Analysis, Insights and Forecast - by Region
- 5.6.1. North America
- 5.6.2. South America
- 5.6.3. Europe
- 5.6.4. Asia Pacific
- 5.6.5. Middle East and Africa
- 5.1. Market Analysis, Insights and Forecast - by Production Analysis
- 6. North America Shale Oil Industry Analysis, Insights and Forecast, 2019-2031
- 6.1. Market Analysis, Insights and Forecast - by Production Analysis
- 6.2. Market Analysis, Insights and Forecast - by Consumption Analysis
- 6.3. Market Analysis, Insights and Forecast - by Import Market Analysis (Value & Volume)
- 6.4. Market Analysis, Insights and Forecast - by Export Market Analysis (Value & Volume)
- 6.5. Market Analysis, Insights and Forecast - by Price Trend Analysis
- 6.1. Market Analysis, Insights and Forecast - by Production Analysis
- 7. South America Shale Oil Industry Analysis, Insights and Forecast, 2019-2031
- 7.1. Market Analysis, Insights and Forecast - by Production Analysis
- 7.2. Market Analysis, Insights and Forecast - by Consumption Analysis
- 7.3. Market Analysis, Insights and Forecast - by Import Market Analysis (Value & Volume)
- 7.4. Market Analysis, Insights and Forecast - by Export Market Analysis (Value & Volume)
- 7.5. Market Analysis, Insights and Forecast - by Price Trend Analysis
- 7.1. Market Analysis, Insights and Forecast - by Production Analysis
- 8. Europe Shale Oil Industry Analysis, Insights and Forecast, 2019-2031
- 8.1. Market Analysis, Insights and Forecast - by Production Analysis
- 8.2. Market Analysis, Insights and Forecast - by Consumption Analysis
- 8.3. Market Analysis, Insights and Forecast - by Import Market Analysis (Value & Volume)
- 8.4. Market Analysis, Insights and Forecast - by Export Market Analysis (Value & Volume)
- 8.5. Market Analysis, Insights and Forecast - by Price Trend Analysis
- 8.1. Market Analysis, Insights and Forecast - by Production Analysis
- 9. Asia Pacific Shale Oil Industry Analysis, Insights and Forecast, 2019-2031
- 9.1. Market Analysis, Insights and Forecast - by Production Analysis
- 9.2. Market Analysis, Insights and Forecast - by Consumption Analysis
- 9.3. Market Analysis, Insights and Forecast - by Import Market Analysis (Value & Volume)
- 9.4. Market Analysis, Insights and Forecast - by Export Market Analysis (Value & Volume)
- 9.5. Market Analysis, Insights and Forecast - by Price Trend Analysis
- 9.1. Market Analysis, Insights and Forecast - by Production Analysis
- 10. Middle East and Africa Shale Oil Industry Analysis, Insights and Forecast, 2019-2031
- 10.1. Market Analysis, Insights and Forecast - by Production Analysis
- 10.2. Market Analysis, Insights and Forecast - by Consumption Analysis
- 10.3. Market Analysis, Insights and Forecast - by Import Market Analysis (Value & Volume)
- 10.4. Market Analysis, Insights and Forecast - by Export Market Analysis (Value & Volume)
- 10.5. Market Analysis, Insights and Forecast - by Price Trend Analysis
- 10.1. Market Analysis, Insights and Forecast - by Production Analysis
- 11. Competitive Analysis
- 11.1. Global Market Share Analysis 2024
- 11.2. Company Profiles
- 11.2.1 Exxon Mobil Corporation
- 11.2.1.1. Overview
- 11.2.1.2. Products
- 11.2.1.3. SWOT Analysis
- 11.2.1.4. Recent Developments
- 11.2.1.5. Financials (Based on Availability)
- 11.2.2 Chevron Corporation
- 11.2.2.1. Overview
- 11.2.2.2. Products
- 11.2.2.3. SWOT Analysis
- 11.2.2.4. Recent Developments
- 11.2.2.5. Financials (Based on Availability)
- 11.2.3 ConocoPhillips Company
- 11.2.3.1. Overview
- 11.2.3.2. Products
- 11.2.3.3. SWOT Analysis
- 11.2.3.4. Recent Developments
- 11.2.3.5. Financials (Based on Availability)
- 11.2.4 Royal Dutch Shell PLC
- 11.2.4.1. Overview
- 11.2.4.2. Products
- 11.2.4.3. SWOT Analysis
- 11.2.4.4. Recent Developments
- 11.2.4.5. Financials (Based on Availability)
- 11.2.5 Continental Resources Inc
- 11.2.5.1. Overview
- 11.2.5.2. Products
- 11.2.5.3. SWOT Analysis
- 11.2.5.4. Recent Developments
- 11.2.5.5. Financials (Based on Availability)
- 11.2.6 Murphy Oil Corporation
- 11.2.6.1. Overview
- 11.2.6.2. Products
- 11.2.6.3. SWOT Analysis
- 11.2.6.4. Recent Developments
- 11.2.6.5. Financials (Based on Availability)
- 11.2.7 Occidental Petroleum Corporation
- 11.2.7.1. Overview
- 11.2.7.2. Products
- 11.2.7.3. SWOT Analysis
- 11.2.7.4. Recent Developments
- 11.2.7.5. Financials (Based on Availability)
- 11.2.8 Marathon Oil Corporation
- 11.2.8.1. Overview
- 11.2.8.2. Products
- 11.2.8.3. SWOT Analysis
- 11.2.8.4. Recent Developments
- 11.2.8.5. Financials (Based on Availability)
- 11.2.9 Schlumberger Limited
- 11.2.9.1. Overview
- 11.2.9.2. Products
- 11.2.9.3. SWOT Analysis
- 11.2.9.4. Recent Developments
- 11.2.9.5. Financials (Based on Availability)
- 11.2.10 Halliburton Company*List Not Exhaustive
- 11.2.10.1. Overview
- 11.2.10.2. Products
- 11.2.10.3. SWOT Analysis
- 11.2.10.4. Recent Developments
- 11.2.10.5. Financials (Based on Availability)
- 11.2.1 Exxon Mobil Corporation
List of Figures
- Figure 1: Global Shale Oil Industry Revenue Breakdown (Million, %) by Region 2024 & 2032
- Figure 2: North America Shale Oil Industry Revenue (Million), by Production Analysis 2024 & 2032
- Figure 3: North America Shale Oil Industry Revenue Share (%), by Production Analysis 2024 & 2032
- Figure 4: North America Shale Oil Industry Revenue (Million), by Consumption Analysis 2024 & 2032
- Figure 5: North America Shale Oil Industry Revenue Share (%), by Consumption Analysis 2024 & 2032
- Figure 6: North America Shale Oil Industry Revenue (Million), by Import Market Analysis (Value & Volume) 2024 & 2032
- Figure 7: North America Shale Oil Industry Revenue Share (%), by Import Market Analysis (Value & Volume) 2024 & 2032
- Figure 8: North America Shale Oil Industry Revenue (Million), by Export Market Analysis (Value & Volume) 2024 & 2032
- Figure 9: North America Shale Oil Industry Revenue Share (%), by Export Market Analysis (Value & Volume) 2024 & 2032
- Figure 10: North America Shale Oil Industry Revenue (Million), by Price Trend Analysis 2024 & 2032
- Figure 11: North America Shale Oil Industry Revenue Share (%), by Price Trend Analysis 2024 & 2032
- Figure 12: North America Shale Oil Industry Revenue (Million), by Country 2024 & 2032
- Figure 13: North America Shale Oil Industry Revenue Share (%), by Country 2024 & 2032
- Figure 14: South America Shale Oil Industry Revenue (Million), by Production Analysis 2024 & 2032
- Figure 15: South America Shale Oil Industry Revenue Share (%), by Production Analysis 2024 & 2032
- Figure 16: South America Shale Oil Industry Revenue (Million), by Consumption Analysis 2024 & 2032
- Figure 17: South America Shale Oil Industry Revenue Share (%), by Consumption Analysis 2024 & 2032
- Figure 18: South America Shale Oil Industry Revenue (Million), by Import Market Analysis (Value & Volume) 2024 & 2032
- Figure 19: South America Shale Oil Industry Revenue Share (%), by Import Market Analysis (Value & Volume) 2024 & 2032
- Figure 20: South America Shale Oil Industry Revenue (Million), by Export Market Analysis (Value & Volume) 2024 & 2032
- Figure 21: South America Shale Oil Industry Revenue Share (%), by Export Market Analysis (Value & Volume) 2024 & 2032
- Figure 22: South America Shale Oil Industry Revenue (Million), by Price Trend Analysis 2024 & 2032
- Figure 23: South America Shale Oil Industry Revenue Share (%), by Price Trend Analysis 2024 & 2032
- Figure 24: South America Shale Oil Industry Revenue (Million), by Country 2024 & 2032
- Figure 25: South America Shale Oil Industry Revenue Share (%), by Country 2024 & 2032
- Figure 26: Europe Shale Oil Industry Revenue (Million), by Production Analysis 2024 & 2032
- Figure 27: Europe Shale Oil Industry Revenue Share (%), by Production Analysis 2024 & 2032
- Figure 28: Europe Shale Oil Industry Revenue (Million), by Consumption Analysis 2024 & 2032
- Figure 29: Europe Shale Oil Industry Revenue Share (%), by Consumption Analysis 2024 & 2032
- Figure 30: Europe Shale Oil Industry Revenue (Million), by Import Market Analysis (Value & Volume) 2024 & 2032
- Figure 31: Europe Shale Oil Industry Revenue Share (%), by Import Market Analysis (Value & Volume) 2024 & 2032
- Figure 32: Europe Shale Oil Industry Revenue (Million), by Export Market Analysis (Value & Volume) 2024 & 2032
- Figure 33: Europe Shale Oil Industry Revenue Share (%), by Export Market Analysis (Value & Volume) 2024 & 2032
- Figure 34: Europe Shale Oil Industry Revenue (Million), by Price Trend Analysis 2024 & 2032
- Figure 35: Europe Shale Oil Industry Revenue Share (%), by Price Trend Analysis 2024 & 2032
- Figure 36: Europe Shale Oil Industry Revenue (Million), by Country 2024 & 2032
- Figure 37: Europe Shale Oil Industry Revenue Share (%), by Country 2024 & 2032
- Figure 38: Asia Pacific Shale Oil Industry Revenue (Million), by Production Analysis 2024 & 2032
- Figure 39: Asia Pacific Shale Oil Industry Revenue Share (%), by Production Analysis 2024 & 2032
- Figure 40: Asia Pacific Shale Oil Industry Revenue (Million), by Consumption Analysis 2024 & 2032
- Figure 41: Asia Pacific Shale Oil Industry Revenue Share (%), by Consumption Analysis 2024 & 2032
- Figure 42: Asia Pacific Shale Oil Industry Revenue (Million), by Import Market Analysis (Value & Volume) 2024 & 2032
- Figure 43: Asia Pacific Shale Oil Industry Revenue Share (%), by Import Market Analysis (Value & Volume) 2024 & 2032
- Figure 44: Asia Pacific Shale Oil Industry Revenue (Million), by Export Market Analysis (Value & Volume) 2024 & 2032
- Figure 45: Asia Pacific Shale Oil Industry Revenue Share (%), by Export Market Analysis (Value & Volume) 2024 & 2032
- Figure 46: Asia Pacific Shale Oil Industry Revenue (Million), by Price Trend Analysis 2024 & 2032
- Figure 47: Asia Pacific Shale Oil Industry Revenue Share (%), by Price Trend Analysis 2024 & 2032
- Figure 48: Asia Pacific Shale Oil Industry Revenue (Million), by Country 2024 & 2032
- Figure 49: Asia Pacific Shale Oil Industry Revenue Share (%), by Country 2024 & 2032
- Figure 50: Middle East and Africa Shale Oil Industry Revenue (Million), by Production Analysis 2024 & 2032
- Figure 51: Middle East and Africa Shale Oil Industry Revenue Share (%), by Production Analysis 2024 & 2032
- Figure 52: Middle East and Africa Shale Oil Industry Revenue (Million), by Consumption Analysis 2024 & 2032
- Figure 53: Middle East and Africa Shale Oil Industry Revenue Share (%), by Consumption Analysis 2024 & 2032
- Figure 54: Middle East and Africa Shale Oil Industry Revenue (Million), by Import Market Analysis (Value & Volume) 2024 & 2032
- Figure 55: Middle East and Africa Shale Oil Industry Revenue Share (%), by Import Market Analysis (Value & Volume) 2024 & 2032
- Figure 56: Middle East and Africa Shale Oil Industry Revenue (Million), by Export Market Analysis (Value & Volume) 2024 & 2032
- Figure 57: Middle East and Africa Shale Oil Industry Revenue Share (%), by Export Market Analysis (Value & Volume) 2024 & 2032
- Figure 58: Middle East and Africa Shale Oil Industry Revenue (Million), by Price Trend Analysis 2024 & 2032
- Figure 59: Middle East and Africa Shale Oil Industry Revenue Share (%), by Price Trend Analysis 2024 & 2032
- Figure 60: Middle East and Africa Shale Oil Industry Revenue (Million), by Country 2024 & 2032
- Figure 61: Middle East and Africa Shale Oil Industry Revenue Share (%), by Country 2024 & 2032
List of Tables
- Table 1: Global Shale Oil Industry Revenue Million Forecast, by Region 2019 & 2032
- Table 2: Global Shale Oil Industry Revenue Million Forecast, by Production Analysis 2019 & 2032
- Table 3: Global Shale Oil Industry Revenue Million Forecast, by Consumption Analysis 2019 & 2032
- Table 4: Global Shale Oil Industry Revenue Million Forecast, by Import Market Analysis (Value & Volume) 2019 & 2032
- Table 5: Global Shale Oil Industry Revenue Million Forecast, by Export Market Analysis (Value & Volume) 2019 & 2032
- Table 6: Global Shale Oil Industry Revenue Million Forecast, by Price Trend Analysis 2019 & 2032
- Table 7: Global Shale Oil Industry Revenue Million Forecast, by Region 2019 & 2032
- Table 8: Global Shale Oil Industry Revenue Million Forecast, by Production Analysis 2019 & 2032
- Table 9: Global Shale Oil Industry Revenue Million Forecast, by Consumption Analysis 2019 & 2032
- Table 10: Global Shale Oil Industry Revenue Million Forecast, by Import Market Analysis (Value & Volume) 2019 & 2032
- Table 11: Global Shale Oil Industry Revenue Million Forecast, by Export Market Analysis (Value & Volume) 2019 & 2032
- Table 12: Global Shale Oil Industry Revenue Million Forecast, by Price Trend Analysis 2019 & 2032
- Table 13: Global Shale Oil Industry Revenue Million Forecast, by Country 2019 & 2032
- Table 14: Global Shale Oil Industry Revenue Million Forecast, by Production Analysis 2019 & 2032
- Table 15: Global Shale Oil Industry Revenue Million Forecast, by Consumption Analysis 2019 & 2032
- Table 16: Global Shale Oil Industry Revenue Million Forecast, by Import Market Analysis (Value & Volume) 2019 & 2032
- Table 17: Global Shale Oil Industry Revenue Million Forecast, by Export Market Analysis (Value & Volume) 2019 & 2032
- Table 18: Global Shale Oil Industry Revenue Million Forecast, by Price Trend Analysis 2019 & 2032
- Table 19: Global Shale Oil Industry Revenue Million Forecast, by Country 2019 & 2032
- Table 20: Global Shale Oil Industry Revenue Million Forecast, by Production Analysis 2019 & 2032
- Table 21: Global Shale Oil Industry Revenue Million Forecast, by Consumption Analysis 2019 & 2032
- Table 22: Global Shale Oil Industry Revenue Million Forecast, by Import Market Analysis (Value & Volume) 2019 & 2032
- Table 23: Global Shale Oil Industry Revenue Million Forecast, by Export Market Analysis (Value & Volume) 2019 & 2032
- Table 24: Global Shale Oil Industry Revenue Million Forecast, by Price Trend Analysis 2019 & 2032
- Table 25: Global Shale Oil Industry Revenue Million Forecast, by Country 2019 & 2032
- Table 26: Global Shale Oil Industry Revenue Million Forecast, by Production Analysis 2019 & 2032
- Table 27: Global Shale Oil Industry Revenue Million Forecast, by Consumption Analysis 2019 & 2032
- Table 28: Global Shale Oil Industry Revenue Million Forecast, by Import Market Analysis (Value & Volume) 2019 & 2032
- Table 29: Global Shale Oil Industry Revenue Million Forecast, by Export Market Analysis (Value & Volume) 2019 & 2032
- Table 30: Global Shale Oil Industry Revenue Million Forecast, by Price Trend Analysis 2019 & 2032
- Table 31: Global Shale Oil Industry Revenue Million Forecast, by Country 2019 & 2032
- Table 32: Global Shale Oil Industry Revenue Million Forecast, by Production Analysis 2019 & 2032
- Table 33: Global Shale Oil Industry Revenue Million Forecast, by Consumption Analysis 2019 & 2032
- Table 34: Global Shale Oil Industry Revenue Million Forecast, by Import Market Analysis (Value & Volume) 2019 & 2032
- Table 35: Global Shale Oil Industry Revenue Million Forecast, by Export Market Analysis (Value & Volume) 2019 & 2032
- Table 36: Global Shale Oil Industry Revenue Million Forecast, by Price Trend Analysis 2019 & 2032
- Table 37: Global Shale Oil Industry Revenue Million Forecast, by Country 2019 & 2032
Frequently Asked Questions
1. What is the projected Compound Annual Growth Rate (CAGR) of the Shale Oil Industry?
The projected CAGR is approximately > 5.00%.
2. Which companies are prominent players in the Shale Oil Industry?
Key companies in the market include Exxon Mobil Corporation, Chevron Corporation, ConocoPhillips Company, Royal Dutch Shell PLC, Continental Resources Inc, Murphy Oil Corporation, Occidental Petroleum Corporation, Marathon Oil Corporation, Schlumberger Limited, Halliburton Company*List Not Exhaustive.
3. What are the main segments of the Shale Oil Industry?
The market segments include Production Analysis, Consumption Analysis, Import Market Analysis (Value & Volume), Export Market Analysis (Value & Volume), Price Trend Analysis.
4. Can you provide details about the market size?
The market size is estimated to be USD XX Million as of 2022.
5. What are some drivers contributing to market growth?
N/A
6. What are the notable trends driving market growth?
Growing Petrochemical Industry to Drive the Market.
7. Are there any restraints impacting market growth?
N/A
8. Can you provide examples of recent developments in the market?
In July 2022, Oilex and Schlumberger won a contract for the supply by Schlumberger of hydraulic fracturing services, coiled tubing and nitrogen services, and perforation services for the planned re-frac of the Cambay C-77H well in Gujarat, India.
9. What pricing options are available for accessing the report?
Pricing options include single-user, multi-user, and enterprise licenses priced at USD 4750, USD 5250, and USD 8750 respectively.
10. Is the market size provided in terms of value or volume?
The market size is provided in terms of value, measured in Million.
11. Are there any specific market keywords associated with the report?
Yes, the market keyword associated with the report is "Shale Oil Industry," which aids in identifying and referencing the specific market segment covered.
12. How do I determine which pricing option suits my needs best?
The pricing options vary based on user requirements and access needs. Individual users may opt for single-user licenses, while businesses requiring broader access may choose multi-user or enterprise licenses for cost-effective access to the report.
13. Are there any additional resources or data provided in the Shale Oil Industry report?
While the report offers comprehensive insights, it's advisable to review the specific contents or supplementary materials provided to ascertain if additional resources or data are available.
14. How can I stay updated on further developments or reports in the Shale Oil Industry?
To stay informed about further developments, trends, and reports in the Shale Oil Industry, consider subscribing to industry newsletters, following relevant companies and organizations, or regularly checking reputable industry news sources and publications.
Methodology
Step 1 - Identification of Relevant Samples Size from Population Database


Step 2 - Approaches for Defining Global Market Size (Value, Volume* & Price*)

Note*: In applicable scenarios
Step 3 - Data Sources
Primary Research
- Web Analytics
- Survey Reports
- Research Institute
- Latest Research Reports
- Opinion Leaders
Secondary Research
- Annual Reports
- White Paper
- Latest Press Release
- Industry Association
- Paid Database
- Investor Presentations

Step 4 - Data Triangulation
Involves using different sources of information in order to increase the validity of a study
These sources are likely to be stakeholders in a program - participants, other researchers, program staff, other community members, and so on.
Then we put all data in single framework & apply various statistical tools to find out the dynamic on the market.
During the analysis stage, feedback from the stakeholder groups would be compared to determine areas of agreement as well as areas of divergence
