

Key Insights
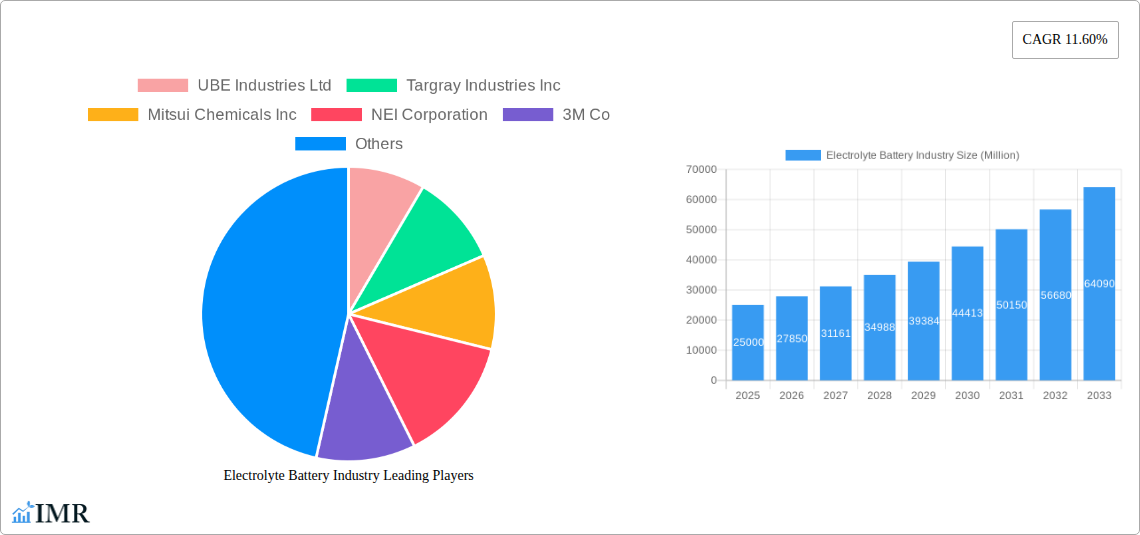
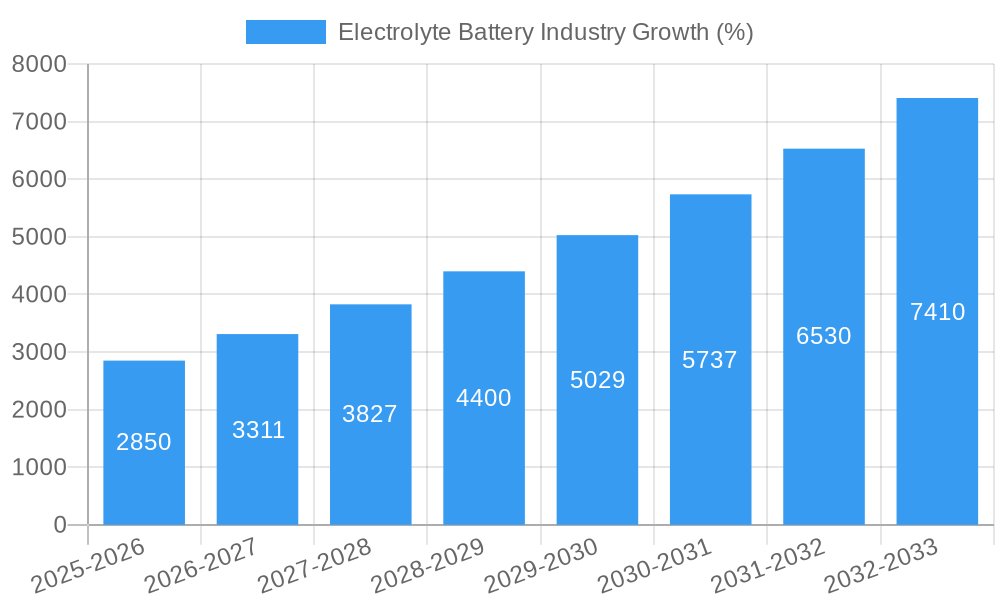
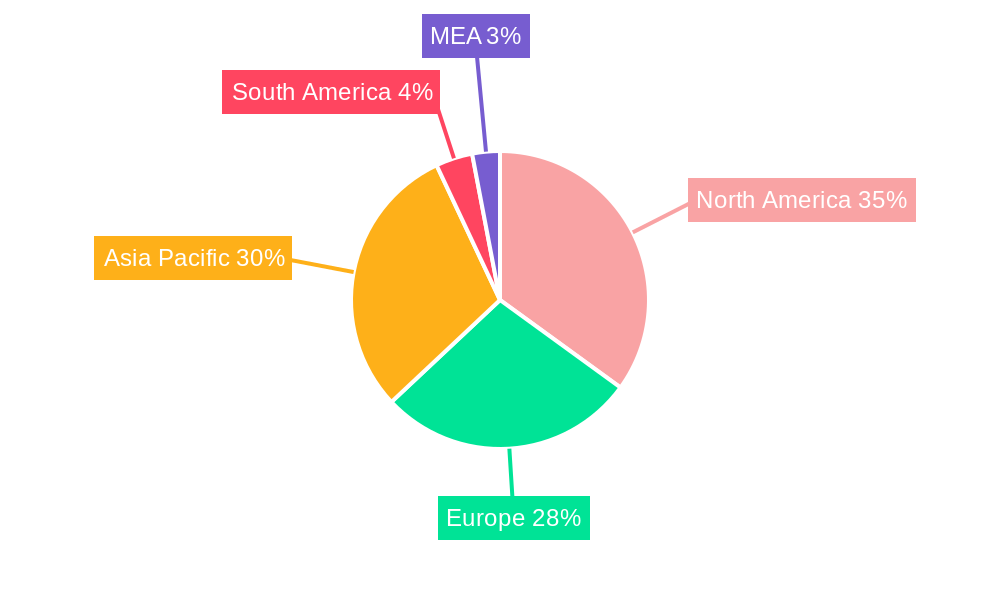
The global electrolyte battery market is experiencing robust growth, projected to reach a significant value by 2033. A compound annual growth rate (CAGR) of 11.60% from 2025 to 2033 indicates substantial market expansion driven by the increasing demand for electric vehicles (EVs) and energy storage solutions. The rising adoption of renewable energy sources and the need for efficient energy management systems are key catalysts. Lithium-ion batteries dominate the battery type segment due to their high energy density and performance characteristics, though other technologies like flow batteries are gaining traction for large-scale energy storage applications. The electric vehicle segment constitutes a major portion of the end-user market, influenced by government policies promoting electric mobility and growing consumer preference for environmentally friendly transportation. However, challenges remain, such as the high initial cost of certain battery types and concerns regarding raw material availability and sustainability of the manufacturing processes. Geographical distribution reveals strong market presence in North America and Asia Pacific, regions with established manufacturing bases and significant investments in renewable energy infrastructure. Competition among key players, including UBE Industries Ltd, Targray Industries Inc, and others, is intensifying, prompting innovation and cost reduction strategies. Future growth will be shaped by advancements in battery technology, improvements in charging infrastructure, and the continued expansion of the renewable energy sector.
The market segmentation reveals diverse growth trajectories. While the lithium-ion battery segment leads, the flow battery market exhibits promising growth potential for grid-scale energy storage, driven by its longer lifespan and improved safety profile. Growth within the end-user segments is also expected to be uneven; the consumer electronics sector, while significant, is projected to exhibit comparatively slower growth compared to the explosive growth anticipated in the electric vehicle and energy storage sectors. Regional differences in growth rates will be influenced by factors like government incentives, technological advancements, and infrastructure development. The dominance of North America and Asia Pacific is likely to persist, but regions like Europe and South America are poised for increased market penetration, fueled by escalating environmental concerns and a shift towards sustainable energy solutions. Maintaining a competitive edge will require companies to focus on R&D to develop higher-performance, more cost-effective, and environmentally sustainable battery technologies.
Electrolyte Battery Industry Market Report: 2019-2033
This comprehensive report provides an in-depth analysis of the Electrolyte Battery industry, encompassing market dynamics, growth trends, regional dominance, product landscapes, and key player strategies. The study period covers 2019-2033, with a base year of 2025 and a forecast period of 2025-2033. This report is essential for industry professionals, investors, and researchers seeking to understand and capitalize on the evolving landscape of this crucial sector. Millions of units are used throughout.
Electrolyte Battery Industry Market Dynamics & Structure
The electrolyte battery market is characterized by a moderately concentrated landscape, with several major players vying for market share. Technological innovation, particularly in lithium-ion battery technology and flow battery advancements, is a key driver. Stringent regulatory frameworks concerning battery safety and environmental impact are shaping industry practices. Competitive substitutes, such as fuel cells, present challenges, while the burgeoning electric vehicle (EV) and energy storage markets drive significant demand. Mergers and acquisitions (M&A) activity, though not exceptionally high, is focused on securing critical materials and enhancing technological capabilities.
- Market Concentration: Moderately concentrated, with top 5 players holding xx% market share in 2024.
- Technological Innovation: Focus on improving energy density, lifespan, and safety of lithium-ion and flow batteries.
- Regulatory Landscape: Stringent safety and environmental regulations impacting manufacturing and disposal.
- Competitive Substitutes: Fuel cells and other energy storage technologies pose competition.
- M&A Activity: xx deals recorded in the historical period, primarily focused on material sourcing and technology acquisition.
- End-User Demographics: Significant growth driven by increasing demand from the EV and energy storage sectors.
Electrolyte Battery Industry Growth Trends & Insights
The electrolyte battery market exhibits robust growth, driven primarily by the exponential rise in electric vehicle adoption and the expanding energy storage sector. The Compound Annual Growth Rate (CAGR) during the forecast period (2025-2033) is estimated at xx%. This growth is fueled by advancements in battery technology, leading to improved energy density, longer lifespans, and reduced costs. Consumer behavior shifts toward eco-friendly technologies further propel market expansion. Technological disruptions, such as the emergence of solid-state batteries, are poised to reshape the market dynamics in the later forecast years. Market penetration of lithium-ion batteries continues to rise, while flow batteries are experiencing gradual but significant adoption in large-scale energy storage applications. The global market size reached xx million units in 2024 and is projected to reach xx million units by 2033.
Dominant Regions, Countries, or Segments in Electrolyte Battery Industry
The Asia-Pacific region dominates the electrolyte battery market, driven by robust demand from China, Japan, and South Korea, which are major players in the electric vehicle and consumer electronics industries. Within battery types, lithium-ion batteries hold the largest market share, followed by lead-acid batteries. The electric vehicle (EV) sector is the leading end-user segment, followed by energy storage systems.
- Key Drivers (Asia-Pacific): Strong government support for EV adoption, extensive manufacturing infrastructure, and a large consumer base.
- Key Drivers (Lithium-ion Batteries): High energy density, suitability for various applications, and continuous technological advancements.
- Key Drivers (Electric Vehicle Sector): Rapid growth of the EV market globally, driving demand for high-performance batteries.
- Market Share: Asia-Pacific holds approximately xx% of the global market in 2024, with China and Japan as the leading countries. Lithium-ion batteries account for approximately xx% of the total market.
Electrolyte Battery Industry Product Landscape
The electrolyte battery product landscape is characterized by a range of battery types catering to diverse applications. Lithium-ion batteries dominate, offering high energy density and power output, while lead-acid batteries remain prevalent in less demanding applications due to their cost-effectiveness. Flow batteries are gaining traction in large-scale energy storage projects due to their long lifespans and scalability. Ongoing innovations focus on enhancing energy density, safety features, and reducing costs across all battery types. Unique selling propositions often center around improved performance metrics such as cycle life, charge/discharge rates, and overall efficiency.
Key Drivers, Barriers & Challenges in Electrolyte Battery Industry
Key Drivers:
- Growing demand from the electric vehicle and renewable energy sectors.
- Advancements in battery technology, leading to improved performance and reduced costs.
- Government incentives and policies promoting the adoption of electric vehicles and energy storage solutions.
Key Challenges:
- Raw material supply chain disruptions, particularly for lithium and cobalt, leading to price volatility and potential shortages (impact: xx% price increase in 2024).
- Concerns regarding battery safety and environmental impact, necessitating stringent regulations.
- Intense competition among battery manufacturers, leading to price pressures and margin compression.
Emerging Opportunities in Electrolyte Battery Industry
- Growing demand for energy storage solutions in grid-scale applications.
- Development of advanced battery technologies, such as solid-state batteries, offering improved performance and safety.
- Expansion into emerging markets with high growth potential in the EV and renewable energy sectors.
- Development of battery recycling and reuse technologies to address sustainability concerns.
Growth Accelerators in the Electrolyte Battery Industry
Technological breakthroughs in battery materials and cell design will play a vital role. Strategic partnerships between battery manufacturers and automotive companies or energy providers will secure supply chains and accelerate market penetration. Expansion into new geographic markets and diversification of applications will fuel long-term growth. The increasing adoption of renewable energy sources and the growing emphasis on energy independence will further enhance market prospects.
Key Players Shaping the Electrolyte Battery Industry Market
- UBE Industries Ltd
- Targray Industries Inc
- Mitsui Chemicals Inc
- NEI Corporation
- 3M Co
- Guangzhou Tinci Materials Technology Co Ltd
- Mitsubishi Chemical Holdings Corporation
- Shenzhen Capchem Technology Co Ltd
Notable Milestones in Electrolyte Battery Industry Sector
- February 2022: US Vanadium announces an expanded purchase agreement with Enerox for up to 3 million additional liters/year of vanadium electrolyte.
- January 2022: Nexeon Limited licenses its NSP-1 technology to SKC Co. Ltd. for next-generation lithium-ion batteries.
In-Depth Electrolyte Battery Industry Market Outlook
The electrolyte battery market is poised for continued strong growth, driven by technological advancements, increasing demand from key end-user sectors, and supportive government policies. Strategic partnerships, investments in research and development, and a focus on sustainable manufacturing practices will be crucial for success. The market presents significant opportunities for companies that can innovate, adapt to evolving regulations, and effectively manage their supply chains. The focus on higher energy density, longer lifespan, and improved safety will define the future of the electrolyte battery industry.
Electrolyte Battery Industry Segmentation
-
1. Battery Type and Electrolyte Type
-
1.1. Lead Acid
- 1.1.1. Liquid Electrolyte
- 1.1.2. Gel Electrolyte
-
1.2. Lithium-ion
- 1.2.1. Solid Electrolyte
-
1.3. Flow Battery
- 1.3.1. Vanadium
- 1.3.2. Zinc Bromide
- 1.4. Other Battery Types and Electrolyte Types
- 1.5. Liquid Electrolyte
-
1.1. Lead Acid
-
2. End User
- 2.1. Electric Vehicle
- 2.2. Energy Storage
- 2.3. Consumer Electronics
- 2.4. Other End Users
Electrolyte Battery Industry Segmentation By Geography
- 1. North America
- 2. Europe
- 3. Asia Pacific
- 4. South America
- 5. Middle East and Africa
Electrolyte Battery Industry REPORT HIGHLIGHTS
| Aspects | Details |
|---|---|
| Study Period | 2019-2033 |
| Base Year | 2024 |
| Estimated Year | 2025 |
| Forecast Period | 2025-2033 |
| Historical Period | 2019-2024 |
| Growth Rate | CAGR of 11.60% from 2019-2033 |
| Segmentation |
|
Table of Contents
- 1. Introduction
- 1.1. Research Scope
- 1.2. Market Segmentation
- 1.3. Research Methodology
- 1.4. Definitions and Assumptions
- 2. Executive Summary
- 2.1. Introduction
- 3. Market Dynamics
- 3.1. Introduction
- 3.2. Market Drivers
- 3.2.1. Increasing Energy Demand.; Increasing Export Opportunities
- 3.3. Market Restrains
- 3.3.1. Volatility in Energy Prices
- 3.4. Market Trends
- 3.4.1. Lithium-ion Battery Expected to Dominate the Market
- 4. Market Factor Analysis
- 4.1. Porters Five Forces
- 4.2. Supply/Value Chain
- 4.3. PESTEL analysis
- 4.4. Market Entropy
- 4.5. Patent/Trademark Analysis
- 5. Global Electrolyte Battery Industry Analysis, Insights and Forecast, 2019-2031
- 5.1. Market Analysis, Insights and Forecast - by Battery Type and Electrolyte Type
- 5.1.1. Lead Acid
- 5.1.1.1. Liquid Electrolyte
- 5.1.1.2. Gel Electrolyte
- 5.1.2. Lithium-ion
- 5.1.2.1. Solid Electrolyte
- 5.1.3. Flow Battery
- 5.1.3.1. Vanadium
- 5.1.3.2. Zinc Bromide
- 5.1.4. Other Battery Types and Electrolyte Types
- 5.1.5. Liquid Electrolyte
- 5.1.1. Lead Acid
- 5.2. Market Analysis, Insights and Forecast - by End User
- 5.2.1. Electric Vehicle
- 5.2.2. Energy Storage
- 5.2.3. Consumer Electronics
- 5.2.4. Other End Users
- 5.3. Market Analysis, Insights and Forecast - by Region
- 5.3.1. North America
- 5.3.2. Europe
- 5.3.3. Asia Pacific
- 5.3.4. South America
- 5.3.5. Middle East and Africa
- 5.1. Market Analysis, Insights and Forecast - by Battery Type and Electrolyte Type
- 6. North America Electrolyte Battery Industry Analysis, Insights and Forecast, 2019-2031
- 6.1. Market Analysis, Insights and Forecast - by Battery Type and Electrolyte Type
- 6.1.1. Lead Acid
- 6.1.1.1. Liquid Electrolyte
- 6.1.1.2. Gel Electrolyte
- 6.1.2. Lithium-ion
- 6.1.2.1. Solid Electrolyte
- 6.1.3. Flow Battery
- 6.1.3.1. Vanadium
- 6.1.3.2. Zinc Bromide
- 6.1.4. Other Battery Types and Electrolyte Types
- 6.1.5. Liquid Electrolyte
- 6.1.1. Lead Acid
- 6.2. Market Analysis, Insights and Forecast - by End User
- 6.2.1. Electric Vehicle
- 6.2.2. Energy Storage
- 6.2.3. Consumer Electronics
- 6.2.4. Other End Users
- 6.1. Market Analysis, Insights and Forecast - by Battery Type and Electrolyte Type
- 7. Europe Electrolyte Battery Industry Analysis, Insights and Forecast, 2019-2031
- 7.1. Market Analysis, Insights and Forecast - by Battery Type and Electrolyte Type
- 7.1.1. Lead Acid
- 7.1.1.1. Liquid Electrolyte
- 7.1.1.2. Gel Electrolyte
- 7.1.2. Lithium-ion
- 7.1.2.1. Solid Electrolyte
- 7.1.3. Flow Battery
- 7.1.3.1. Vanadium
- 7.1.3.2. Zinc Bromide
- 7.1.4. Other Battery Types and Electrolyte Types
- 7.1.5. Liquid Electrolyte
- 7.1.1. Lead Acid
- 7.2. Market Analysis, Insights and Forecast - by End User
- 7.2.1. Electric Vehicle
- 7.2.2. Energy Storage
- 7.2.3. Consumer Electronics
- 7.2.4. Other End Users
- 7.1. Market Analysis, Insights and Forecast - by Battery Type and Electrolyte Type
- 8. Asia Pacific Electrolyte Battery Industry Analysis, Insights and Forecast, 2019-2031
- 8.1. Market Analysis, Insights and Forecast - by Battery Type and Electrolyte Type
- 8.1.1. Lead Acid
- 8.1.1.1. Liquid Electrolyte
- 8.1.1.2. Gel Electrolyte
- 8.1.2. Lithium-ion
- 8.1.2.1. Solid Electrolyte
- 8.1.3. Flow Battery
- 8.1.3.1. Vanadium
- 8.1.3.2. Zinc Bromide
- 8.1.4. Other Battery Types and Electrolyte Types
- 8.1.5. Liquid Electrolyte
- 8.1.1. Lead Acid
- 8.2. Market Analysis, Insights and Forecast - by End User
- 8.2.1. Electric Vehicle
- 8.2.2. Energy Storage
- 8.2.3. Consumer Electronics
- 8.2.4. Other End Users
- 8.1. Market Analysis, Insights and Forecast - by Battery Type and Electrolyte Type
- 9. South America Electrolyte Battery Industry Analysis, Insights and Forecast, 2019-2031
- 9.1. Market Analysis, Insights and Forecast - by Battery Type and Electrolyte Type
- 9.1.1. Lead Acid
- 9.1.1.1. Liquid Electrolyte
- 9.1.1.2. Gel Electrolyte
- 9.1.2. Lithium-ion
- 9.1.2.1. Solid Electrolyte
- 9.1.3. Flow Battery
- 9.1.3.1. Vanadium
- 9.1.3.2. Zinc Bromide
- 9.1.4. Other Battery Types and Electrolyte Types
- 9.1.5. Liquid Electrolyte
- 9.1.1. Lead Acid
- 9.2. Market Analysis, Insights and Forecast - by End User
- 9.2.1. Electric Vehicle
- 9.2.2. Energy Storage
- 9.2.3. Consumer Electronics
- 9.2.4. Other End Users
- 9.1. Market Analysis, Insights and Forecast - by Battery Type and Electrolyte Type
- 10. Middle East and Africa Electrolyte Battery Industry Analysis, Insights and Forecast, 2019-2031
- 10.1. Market Analysis, Insights and Forecast - by Battery Type and Electrolyte Type
- 10.1.1. Lead Acid
- 10.1.1.1. Liquid Electrolyte
- 10.1.1.2. Gel Electrolyte
- 10.1.2. Lithium-ion
- 10.1.2.1. Solid Electrolyte
- 10.1.3. Flow Battery
- 10.1.3.1. Vanadium
- 10.1.3.2. Zinc Bromide
- 10.1.4. Other Battery Types and Electrolyte Types
- 10.1.5. Liquid Electrolyte
- 10.1.1. Lead Acid
- 10.2. Market Analysis, Insights and Forecast - by End User
- 10.2.1. Electric Vehicle
- 10.2.2. Energy Storage
- 10.2.3. Consumer Electronics
- 10.2.4. Other End Users
- 10.1. Market Analysis, Insights and Forecast - by Battery Type and Electrolyte Type
- 11. North America Electrolyte Battery Industry Analysis, Insights and Forecast, 2019-2031
- 11.1. Market Analysis, Insights and Forecast - By Country/Sub-region
- 11.1.1 United States
- 11.1.2 Canada
- 11.1.3 Mexico
- 12. Europe Electrolyte Battery Industry Analysis, Insights and Forecast, 2019-2031
- 12.1. Market Analysis, Insights and Forecast - By Country/Sub-region
- 12.1.1 Germany
- 12.1.2 United Kingdom
- 12.1.3 France
- 12.1.4 Spain
- 12.1.5 Italy
- 12.1.6 Spain
- 12.1.7 Belgium
- 12.1.8 Netherland
- 12.1.9 Nordics
- 12.1.10 Rest of Europe
- 13. Asia Pacific Electrolyte Battery Industry Analysis, Insights and Forecast, 2019-2031
- 13.1. Market Analysis, Insights and Forecast - By Country/Sub-region
- 13.1.1 China
- 13.1.2 Japan
- 13.1.3 India
- 13.1.4 South Korea
- 13.1.5 Southeast Asia
- 13.1.6 Australia
- 13.1.7 Indonesia
- 13.1.8 Phillipes
- 13.1.9 Singapore
- 13.1.10 Thailandc
- 13.1.11 Rest of Asia Pacific
- 14. South America Electrolyte Battery Industry Analysis, Insights and Forecast, 2019-2031
- 14.1. Market Analysis, Insights and Forecast - By Country/Sub-region
- 14.1.1 Brazil
- 14.1.2 Argentina
- 14.1.3 Peru
- 14.1.4 Chile
- 14.1.5 Colombia
- 14.1.6 Ecuador
- 14.1.7 Venezuela
- 14.1.8 Rest of South America
- 15. North America Electrolyte Battery Industry Analysis, Insights and Forecast, 2019-2031
- 15.1. Market Analysis, Insights and Forecast - By Country/Sub-region
- 15.1.1 United States
- 15.1.2 Canada
- 15.1.3 Mexico
- 16. MEA Electrolyte Battery Industry Analysis, Insights and Forecast, 2019-2031
- 16.1. Market Analysis, Insights and Forecast - By Country/Sub-region
- 16.1.1 United Arab Emirates
- 16.1.2 Saudi Arabia
- 16.1.3 South Africa
- 16.1.4 Rest of Middle East and Africa
- 17. Competitive Analysis
- 17.1. Global Market Share Analysis 2024
- 17.2. Company Profiles
- 17.2.1 UBE Industries Ltd
- 17.2.1.1. Overview
- 17.2.1.2. Products
- 17.2.1.3. SWOT Analysis
- 17.2.1.4. Recent Developments
- 17.2.1.5. Financials (Based on Availability)
- 17.2.2 Targray Industries Inc
- 17.2.2.1. Overview
- 17.2.2.2. Products
- 17.2.2.3. SWOT Analysis
- 17.2.2.4. Recent Developments
- 17.2.2.5. Financials (Based on Availability)
- 17.2.3 Mitsui Chemicals Inc
- 17.2.3.1. Overview
- 17.2.3.2. Products
- 17.2.3.3. SWOT Analysis
- 17.2.3.4. Recent Developments
- 17.2.3.5. Financials (Based on Availability)
- 17.2.4 NEI Corporation
- 17.2.4.1. Overview
- 17.2.4.2. Products
- 17.2.4.3. SWOT Analysis
- 17.2.4.4. Recent Developments
- 17.2.4.5. Financials (Based on Availability)
- 17.2.5 3M Co
- 17.2.5.1. Overview
- 17.2.5.2. Products
- 17.2.5.3. SWOT Analysis
- 17.2.5.4. Recent Developments
- 17.2.5.5. Financials (Based on Availability)
- 17.2.6 Guangzhou Tinci Materials Technology Co Ltd
- 17.2.6.1. Overview
- 17.2.6.2. Products
- 17.2.6.3. SWOT Analysis
- 17.2.6.4. Recent Developments
- 17.2.6.5. Financials (Based on Availability)
- 17.2.7 Mitsubishi Chemical Holdings Corporation
- 17.2.7.1. Overview
- 17.2.7.2. Products
- 17.2.7.3. SWOT Analysis
- 17.2.7.4. Recent Developments
- 17.2.7.5. Financials (Based on Availability)
- 17.2.8 Shenzhen Capchem Technology Co Ltd
- 17.2.8.1. Overview
- 17.2.8.2. Products
- 17.2.8.3. SWOT Analysis
- 17.2.8.4. Recent Developments
- 17.2.8.5. Financials (Based on Availability)
- 17.2.1 UBE Industries Ltd
List of Figures
- Figure 1: Global Electrolyte Battery Industry Revenue Breakdown (Million, %) by Region 2024 & 2032
- Figure 2: North America Electrolyte Battery Industry Revenue (Million), by Country 2024 & 2032
- Figure 3: North America Electrolyte Battery Industry Revenue Share (%), by Country 2024 & 2032
- Figure 4: Europe Electrolyte Battery Industry Revenue (Million), by Country 2024 & 2032
- Figure 5: Europe Electrolyte Battery Industry Revenue Share (%), by Country 2024 & 2032
- Figure 6: Asia Pacific Electrolyte Battery Industry Revenue (Million), by Country 2024 & 2032
- Figure 7: Asia Pacific Electrolyte Battery Industry Revenue Share (%), by Country 2024 & 2032
- Figure 8: South America Electrolyte Battery Industry Revenue (Million), by Country 2024 & 2032
- Figure 9: South America Electrolyte Battery Industry Revenue Share (%), by Country 2024 & 2032
- Figure 10: North America Electrolyte Battery Industry Revenue (Million), by Country 2024 & 2032
- Figure 11: North America Electrolyte Battery Industry Revenue Share (%), by Country 2024 & 2032
- Figure 12: MEA Electrolyte Battery Industry Revenue (Million), by Country 2024 & 2032
- Figure 13: MEA Electrolyte Battery Industry Revenue Share (%), by Country 2024 & 2032
- Figure 14: North America Electrolyte Battery Industry Revenue (Million), by Battery Type and Electrolyte Type 2024 & 2032
- Figure 15: North America Electrolyte Battery Industry Revenue Share (%), by Battery Type and Electrolyte Type 2024 & 2032
- Figure 16: North America Electrolyte Battery Industry Revenue (Million), by End User 2024 & 2032
- Figure 17: North America Electrolyte Battery Industry Revenue Share (%), by End User 2024 & 2032
- Figure 18: North America Electrolyte Battery Industry Revenue (Million), by Country 2024 & 2032
- Figure 19: North America Electrolyte Battery Industry Revenue Share (%), by Country 2024 & 2032
- Figure 20: Europe Electrolyte Battery Industry Revenue (Million), by Battery Type and Electrolyte Type 2024 & 2032
- Figure 21: Europe Electrolyte Battery Industry Revenue Share (%), by Battery Type and Electrolyte Type 2024 & 2032
- Figure 22: Europe Electrolyte Battery Industry Revenue (Million), by End User 2024 & 2032
- Figure 23: Europe Electrolyte Battery Industry Revenue Share (%), by End User 2024 & 2032
- Figure 24: Europe Electrolyte Battery Industry Revenue (Million), by Country 2024 & 2032
- Figure 25: Europe Electrolyte Battery Industry Revenue Share (%), by Country 2024 & 2032
- Figure 26: Asia Pacific Electrolyte Battery Industry Revenue (Million), by Battery Type and Electrolyte Type 2024 & 2032
- Figure 27: Asia Pacific Electrolyte Battery Industry Revenue Share (%), by Battery Type and Electrolyte Type 2024 & 2032
- Figure 28: Asia Pacific Electrolyte Battery Industry Revenue (Million), by End User 2024 & 2032
- Figure 29: Asia Pacific Electrolyte Battery Industry Revenue Share (%), by End User 2024 & 2032
- Figure 30: Asia Pacific Electrolyte Battery Industry Revenue (Million), by Country 2024 & 2032
- Figure 31: Asia Pacific Electrolyte Battery Industry Revenue Share (%), by Country 2024 & 2032
- Figure 32: South America Electrolyte Battery Industry Revenue (Million), by Battery Type and Electrolyte Type 2024 & 2032
- Figure 33: South America Electrolyte Battery Industry Revenue Share (%), by Battery Type and Electrolyte Type 2024 & 2032
- Figure 34: South America Electrolyte Battery Industry Revenue (Million), by End User 2024 & 2032
- Figure 35: South America Electrolyte Battery Industry Revenue Share (%), by End User 2024 & 2032
- Figure 36: South America Electrolyte Battery Industry Revenue (Million), by Country 2024 & 2032
- Figure 37: South America Electrolyte Battery Industry Revenue Share (%), by Country 2024 & 2032
- Figure 38: Middle East and Africa Electrolyte Battery Industry Revenue (Million), by Battery Type and Electrolyte Type 2024 & 2032
- Figure 39: Middle East and Africa Electrolyte Battery Industry Revenue Share (%), by Battery Type and Electrolyte Type 2024 & 2032
- Figure 40: Middle East and Africa Electrolyte Battery Industry Revenue (Million), by End User 2024 & 2032
- Figure 41: Middle East and Africa Electrolyte Battery Industry Revenue Share (%), by End User 2024 & 2032
- Figure 42: Middle East and Africa Electrolyte Battery Industry Revenue (Million), by Country 2024 & 2032
- Figure 43: Middle East and Africa Electrolyte Battery Industry Revenue Share (%), by Country 2024 & 2032
List of Tables
- Table 1: Global Electrolyte Battery Industry Revenue Million Forecast, by Region 2019 & 2032
- Table 2: Global Electrolyte Battery Industry Revenue Million Forecast, by Battery Type and Electrolyte Type 2019 & 2032
- Table 3: Global Electrolyte Battery Industry Revenue Million Forecast, by End User 2019 & 2032
- Table 4: Global Electrolyte Battery Industry Revenue Million Forecast, by Region 2019 & 2032
- Table 5: Global Electrolyte Battery Industry Revenue Million Forecast, by Country 2019 & 2032
- Table 6: United States Electrolyte Battery Industry Revenue (Million) Forecast, by Application 2019 & 2032
- Table 7: Canada Electrolyte Battery Industry Revenue (Million) Forecast, by Application 2019 & 2032
- Table 8: Mexico Electrolyte Battery Industry Revenue (Million) Forecast, by Application 2019 & 2032
- Table 9: Global Electrolyte Battery Industry Revenue Million Forecast, by Country 2019 & 2032
- Table 10: Germany Electrolyte Battery Industry Revenue (Million) Forecast, by Application 2019 & 2032
- Table 11: United Kingdom Electrolyte Battery Industry Revenue (Million) Forecast, by Application 2019 & 2032
- Table 12: France Electrolyte Battery Industry Revenue (Million) Forecast, by Application 2019 & 2032
- Table 13: Spain Electrolyte Battery Industry Revenue (Million) Forecast, by Application 2019 & 2032
- Table 14: Italy Electrolyte Battery Industry Revenue (Million) Forecast, by Application 2019 & 2032
- Table 15: Spain Electrolyte Battery Industry Revenue (Million) Forecast, by Application 2019 & 2032
- Table 16: Belgium Electrolyte Battery Industry Revenue (Million) Forecast, by Application 2019 & 2032
- Table 17: Netherland Electrolyte Battery Industry Revenue (Million) Forecast, by Application 2019 & 2032
- Table 18: Nordics Electrolyte Battery Industry Revenue (Million) Forecast, by Application 2019 & 2032
- Table 19: Rest of Europe Electrolyte Battery Industry Revenue (Million) Forecast, by Application 2019 & 2032
- Table 20: Global Electrolyte Battery Industry Revenue Million Forecast, by Country 2019 & 2032
- Table 21: China Electrolyte Battery Industry Revenue (Million) Forecast, by Application 2019 & 2032
- Table 22: Japan Electrolyte Battery Industry Revenue (Million) Forecast, by Application 2019 & 2032
- Table 23: India Electrolyte Battery Industry Revenue (Million) Forecast, by Application 2019 & 2032
- Table 24: South Korea Electrolyte Battery Industry Revenue (Million) Forecast, by Application 2019 & 2032
- Table 25: Southeast Asia Electrolyte Battery Industry Revenue (Million) Forecast, by Application 2019 & 2032
- Table 26: Australia Electrolyte Battery Industry Revenue (Million) Forecast, by Application 2019 & 2032
- Table 27: Indonesia Electrolyte Battery Industry Revenue (Million) Forecast, by Application 2019 & 2032
- Table 28: Phillipes Electrolyte Battery Industry Revenue (Million) Forecast, by Application 2019 & 2032
- Table 29: Singapore Electrolyte Battery Industry Revenue (Million) Forecast, by Application 2019 & 2032
- Table 30: Thailandc Electrolyte Battery Industry Revenue (Million) Forecast, by Application 2019 & 2032
- Table 31: Rest of Asia Pacific Electrolyte Battery Industry Revenue (Million) Forecast, by Application 2019 & 2032
- Table 32: Global Electrolyte Battery Industry Revenue Million Forecast, by Country 2019 & 2032
- Table 33: Brazil Electrolyte Battery Industry Revenue (Million) Forecast, by Application 2019 & 2032
- Table 34: Argentina Electrolyte Battery Industry Revenue (Million) Forecast, by Application 2019 & 2032
- Table 35: Peru Electrolyte Battery Industry Revenue (Million) Forecast, by Application 2019 & 2032
- Table 36: Chile Electrolyte Battery Industry Revenue (Million) Forecast, by Application 2019 & 2032
- Table 37: Colombia Electrolyte Battery Industry Revenue (Million) Forecast, by Application 2019 & 2032
- Table 38: Ecuador Electrolyte Battery Industry Revenue (Million) Forecast, by Application 2019 & 2032
- Table 39: Venezuela Electrolyte Battery Industry Revenue (Million) Forecast, by Application 2019 & 2032
- Table 40: Rest of South America Electrolyte Battery Industry Revenue (Million) Forecast, by Application 2019 & 2032
- Table 41: Global Electrolyte Battery Industry Revenue Million Forecast, by Country 2019 & 2032
- Table 42: United States Electrolyte Battery Industry Revenue (Million) Forecast, by Application 2019 & 2032
- Table 43: Canada Electrolyte Battery Industry Revenue (Million) Forecast, by Application 2019 & 2032
- Table 44: Mexico Electrolyte Battery Industry Revenue (Million) Forecast, by Application 2019 & 2032
- Table 45: Global Electrolyte Battery Industry Revenue Million Forecast, by Country 2019 & 2032
- Table 46: United Arab Emirates Electrolyte Battery Industry Revenue (Million) Forecast, by Application 2019 & 2032
- Table 47: Saudi Arabia Electrolyte Battery Industry Revenue (Million) Forecast, by Application 2019 & 2032
- Table 48: South Africa Electrolyte Battery Industry Revenue (Million) Forecast, by Application 2019 & 2032
- Table 49: Rest of Middle East and Africa Electrolyte Battery Industry Revenue (Million) Forecast, by Application 2019 & 2032
- Table 50: Global Electrolyte Battery Industry Revenue Million Forecast, by Battery Type and Electrolyte Type 2019 & 2032
- Table 51: Global Electrolyte Battery Industry Revenue Million Forecast, by End User 2019 & 2032
- Table 52: Global Electrolyte Battery Industry Revenue Million Forecast, by Country 2019 & 2032
- Table 53: Global Electrolyte Battery Industry Revenue Million Forecast, by Battery Type and Electrolyte Type 2019 & 2032
- Table 54: Global Electrolyte Battery Industry Revenue Million Forecast, by End User 2019 & 2032
- Table 55: Global Electrolyte Battery Industry Revenue Million Forecast, by Country 2019 & 2032
- Table 56: Global Electrolyte Battery Industry Revenue Million Forecast, by Battery Type and Electrolyte Type 2019 & 2032
- Table 57: Global Electrolyte Battery Industry Revenue Million Forecast, by End User 2019 & 2032
- Table 58: Global Electrolyte Battery Industry Revenue Million Forecast, by Country 2019 & 2032
- Table 59: Global Electrolyte Battery Industry Revenue Million Forecast, by Battery Type and Electrolyte Type 2019 & 2032
- Table 60: Global Electrolyte Battery Industry Revenue Million Forecast, by End User 2019 & 2032
- Table 61: Global Electrolyte Battery Industry Revenue Million Forecast, by Country 2019 & 2032
- Table 62: Global Electrolyte Battery Industry Revenue Million Forecast, by Battery Type and Electrolyte Type 2019 & 2032
- Table 63: Global Electrolyte Battery Industry Revenue Million Forecast, by End User 2019 & 2032
- Table 64: Global Electrolyte Battery Industry Revenue Million Forecast, by Country 2019 & 2032
Frequently Asked Questions
1. What is the projected Compound Annual Growth Rate (CAGR) of the Electrolyte Battery Industry?
The projected CAGR is approximately 11.60%.
2. Which companies are prominent players in the Electrolyte Battery Industry?
Key companies in the market include UBE Industries Ltd, Targray Industries Inc, Mitsui Chemicals Inc, NEI Corporation, 3M Co, Guangzhou Tinci Materials Technology Co Ltd, Mitsubishi Chemical Holdings Corporation, Shenzhen Capchem Technology Co Ltd.
3. What are the main segments of the Electrolyte Battery Industry?
The market segments include Battery Type and Electrolyte Type, End User.
4. Can you provide details about the market size?
The market size is estimated to be USD XX Million as of 2022.
5. What are some drivers contributing to market growth?
Increasing Energy Demand.; Increasing Export Opportunities.
6. What are the notable trends driving market growth?
Lithium-ion Battery Expected to Dominate the Market.
7. Are there any restraints impacting market growth?
Volatility in Energy Prices.
8. Can you provide examples of recent developments in the market?
In February 2022, US Vanadium announced an expanded purchase agreement under which Austrian-based Enerox, which sells vanadium redox flow battery (VRFB) systems under its brand name CellCube, can purchase up to 3 million additional liters/year of US Vanadium's ultra-high-purity electrolyte with a price cap over the next five years. The agreement boosts the initial purchase agreement for 580,000 liters/year of US Vanadium electrolyte, announced in September 2021.
9. What pricing options are available for accessing the report?
Pricing options include single-user, multi-user, and enterprise licenses priced at USD 4750, USD 5250, and USD 8750 respectively.
10. Is the market size provided in terms of value or volume?
The market size is provided in terms of value, measured in Million.
11. Are there any specific market keywords associated with the report?
Yes, the market keyword associated with the report is "Electrolyte Battery Industry," which aids in identifying and referencing the specific market segment covered.
12. How do I determine which pricing option suits my needs best?
The pricing options vary based on user requirements and access needs. Individual users may opt for single-user licenses, while businesses requiring broader access may choose multi-user or enterprise licenses for cost-effective access to the report.
13. Are there any additional resources or data provided in the Electrolyte Battery Industry report?
While the report offers comprehensive insights, it's advisable to review the specific contents or supplementary materials provided to ascertain if additional resources or data are available.
14. How can I stay updated on further developments or reports in the Electrolyte Battery Industry?
To stay informed about further developments, trends, and reports in the Electrolyte Battery Industry, consider subscribing to industry newsletters, following relevant companies and organizations, or regularly checking reputable industry news sources and publications.
Methodology
Step 1 - Identification of Relevant Samples Size from Population Database


Step 2 - Approaches for Defining Global Market Size (Value, Volume* & Price*)

Note*: In applicable scenarios
Step 3 - Data Sources
Primary Research
- Web Analytics
- Survey Reports
- Research Institute
- Latest Research Reports
- Opinion Leaders
Secondary Research
- Annual Reports
- White Paper
- Latest Press Release
- Industry Association
- Paid Database
- Investor Presentations

Step 4 - Data Triangulation
Involves using different sources of information in order to increase the validity of a study
These sources are likely to be stakeholders in a program - participants, other researchers, program staff, other community members, and so on.
Then we put all data in single framework & apply various statistical tools to find out the dynamic on the market.
During the analysis stage, feedback from the stakeholder groups would be compared to determine areas of agreement as well as areas of divergence
