

Key Insights
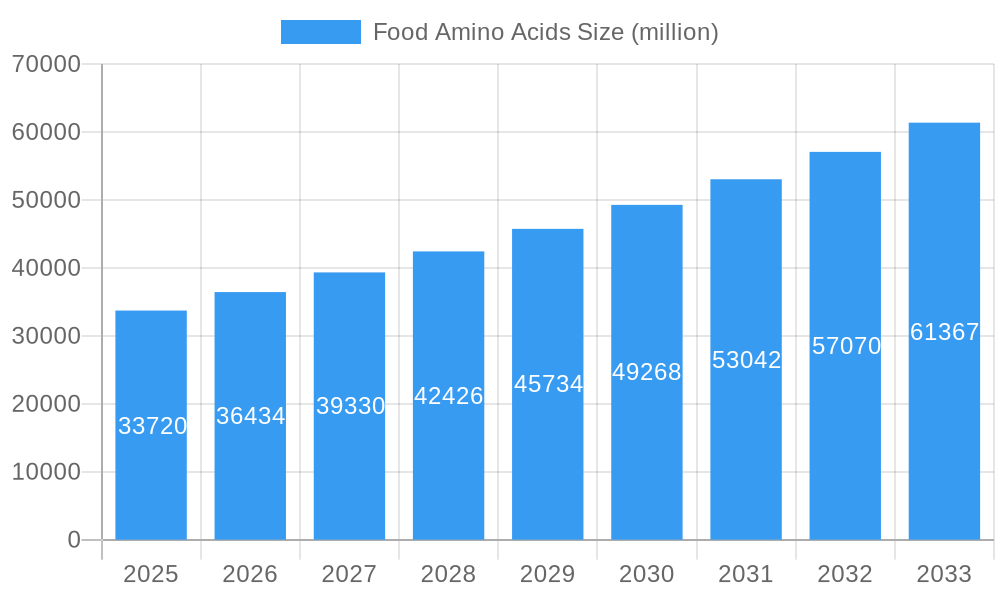
The global Food Amino Acids market is poised for significant expansion, projected to reach $33.72 billion by 2025. This robust growth is fueled by an increasing consumer demand for healthier and more nutritious food options, driven by heightened awareness of the health benefits associated with amino acids. The nutraceutical and dietary supplement segment is a primary growth engine, benefiting from the rising popularity of functional foods and beverages that offer targeted health advantages. Furthermore, the expanding infant formula sector, where amino acids play a crucial role in infant development, and the growing adoption of food fortification strategies to address micronutrient deficiencies, are also contributing substantially to market expansion. The convenience food industry's embrace of amino acids for flavor enhancement and nutritional boosting further solidifies its upward trajectory. The market is anticipated to witness a Compound Annual Growth Rate (CAGR) of 8.3% during the forecast period of 2025-2033, indicating a sustained and dynamic market environment.
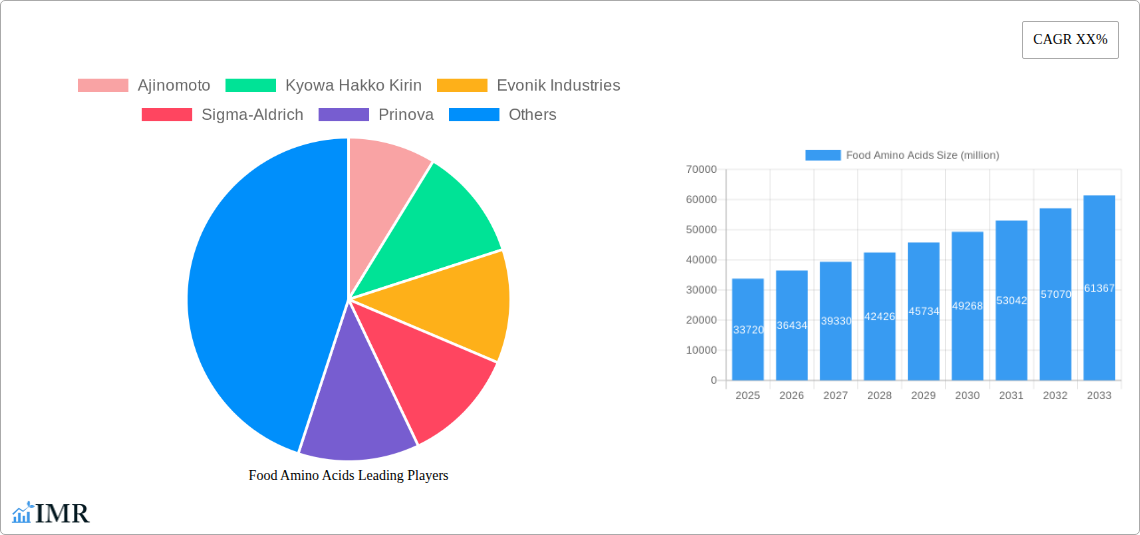
Food Amino Acids Market Size (In Billion)
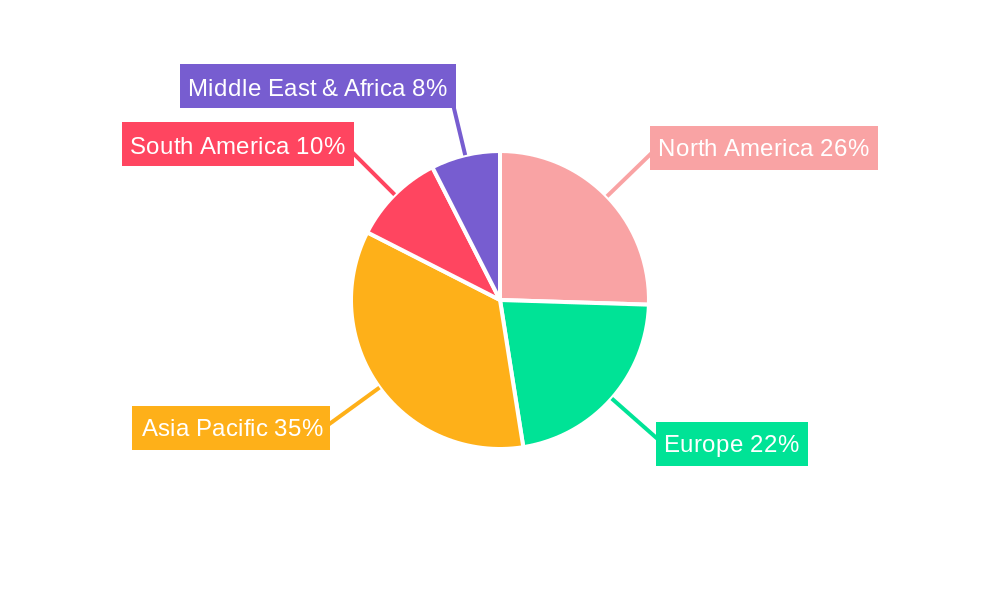
The market's expansion is further propelled by advancements in production technologies and a broader understanding of amino acid applications across various food categories. Key amino acids like Glutamic Acid, Lysine, Tryptophan, and Methionine are integral components in fortifying a wide array of food products, from baked goods and dairy to meat substitutes. While the market enjoys strong growth drivers, potential restraints such as volatile raw material prices and stringent regulatory frameworks in certain regions necessitate strategic planning for market participants. However, the overall outlook remains highly positive, with Asia Pacific expected to emerge as a dominant region due to its large population, increasing disposable incomes, and growing health consciousness, closely followed by North America and Europe. Companies are actively investing in research and development to innovate new applications and improve production efficiency, ensuring a consistent supply to meet burgeoning global demand.
Food Amino Acids Company Market Share
Explore the dynamic landscape of the global food amino acids market with this in-depth report. Covering the historical period from 2019 to 2024 and extending to a comprehensive forecast up to 2033, this analysis provides critical insights into market size evolution, growth drivers, regional dominance, product innovations, and key player strategies. Delve into the intricacies of amino acids like Glutamic Acid, Lysine, Tryptophan, and Methionine, and their vital applications in Nutraceutical & Dietary Supplements, Infant Formula, Food Fortification, and Convenience Foods. Understand the competitive environment, technological advancements, and emerging opportunities that will shape the future of this indispensable sector.
Food Amino Acids Market Dynamics & Structure
The global food amino acids market exhibits a moderately concentrated structure, with key players like Ajinomoto, Kyowa Hakko Kirin, and Evonik Industries holding significant market shares. Technological innovation is a primary driver, fueled by advancements in fermentation and synthesis techniques leading to higher purity and cost-effectiveness. The regulatory framework, particularly concerning food safety standards and labeling requirements in regions like the EU and North America, plays a crucial role in market entry and product development. Competitive product substitutes, such as alternative protein sources and other functional food ingredients, pose a moderate threat, necessitating continuous product differentiation and value proposition enhancement. End-user demographics are shifting towards health-conscious consumers seeking functional foods and dietary supplements, driving demand for specialized amino acid formulations. Mergers and acquisitions (M&A) are a notable trend, with larger companies acquiring smaller innovators to expand their product portfolios and geographical reach. For instance, in 2023, an estimated 5-7 M&A deals occurred within the broader food ingredients sector, indicating strategic consolidation. Barriers to innovation include high R&D costs, stringent regulatory approvals, and the need for extensive clinical validation for novel applications.
- Market Concentration: Moderately concentrated with a few dominant players.
- Technological Innovation Drivers: Advanced fermentation, synthetic biology, purification technologies.
- Regulatory Frameworks: Strict food safety (e.g., FDA, EFSA), labeling, and quality standards.
- Competitive Product Substitutes: Plant-based proteins, other functional food additives.
- End-User Demographics: Growing demand from health-conscious consumers, aging populations, and specialized dietary needs.
- M&A Trends: Strategic acquisitions for portfolio expansion and market consolidation.
- Estimated M&A Deal Volume (2023): 5-7 deals in the broader food ingredients sector.
- Innovation Barriers: High R&D investment, regulatory hurdles, clinical validation requirements.
Food Amino Acids Growth Trends & Insights
The global food amino acids market is projected for substantial growth, driven by an escalating demand for functional foods, dietary supplements, and fortified food products. The market size, estimated to be $7.2 billion in the base year 2025, is anticipated to expand to $11.5 billion by 2033, exhibiting a compound annual growth rate (CAGR) of approximately 6.0%. Adoption rates for amino acid-based nutritional products are on an upward trajectory, propelled by increasing consumer awareness of their health benefits, including muscle synthesis, immune support, and cognitive function. Technological disruptions, such as the development of more efficient and sustainable production methods (e.g., precision fermentation), are further enhancing market competitiveness and product accessibility. Consumer behavior shifts are evident, with a growing preference for natural, clean-label ingredients and personalized nutrition solutions. This trend is fostering innovation in amino acid blends tailored for specific health outcomes and life stages. The nutraceutical and dietary supplement segment, in particular, is a key contributor to market growth, with an estimated market penetration of over 65% in developed economies for certain amino acid derivatives. The infant formula segment also demonstrates robust growth, driven by the demand for essential amino acids crucial for infant development and the increasing prevalence of specialized formulas addressing allergies and digestive issues. The market penetration for essential amino acids in infant formula is estimated at 80% globally.
Dominant Regions, Countries, or Segments in Food Amino Acids
The Nutraceutical & Dietary Supplements segment emerges as the dominant force in the global food amino acids market, significantly outpacing other applications. In 2025, this segment is expected to account for an estimated 38% of the total market value, projected to reach $2.7 billion. This dominance is fueled by a confluence of factors including rising health consciousness among consumers, an aging global population seeking to maintain vitality, and a burgeoning interest in preventative healthcare. The increasing availability of evidence-based research highlighting the benefits of amino acids for muscle recovery, cognitive function, and immune support further bolsters consumer confidence and demand. Developed regions, particularly North America and Europe, represent the leading geographical markets for nutraceuticals and dietary supplements, driven by high disposable incomes, established healthcare infrastructure, and proactive consumer engagement with health and wellness trends. The market share within these regions for amino acid-based supplements is estimated at 70% and 65% respectively. Economic policies in these regions often support the growth of the health and wellness industry through favorable regulations and research funding.
Furthermore, within the Types of food amino acids, Glutamic Acid and Lysine are expected to maintain their leading positions. Glutamic Acid, primarily used as a flavor enhancer (MSG) and a building block in various food products, holds a substantial market share, estimated at 25% of the total market value. Lysine, an essential amino acid crucial for protein synthesis and often supplemented in animal feed and human nutrition, is also a significant contributor, expected to capture around 20% of the market share. The demand for Lysine is particularly strong in the animal feed industry, a significant sub-sector of the broader food amino acids market. The growth potential for these amino acids remains robust due to their widespread applications and essential nutritional roles.
- Dominant Segment: Nutraceutical & Dietary Supplements
- Estimated Market Share (2025): 38%
- Projected Market Value (2025): $2.7 billion
- Key Drivers: Rising health consciousness, aging population, preventative healthcare trend, strong scientific backing.
- Leading Regions: North America & Europe
- Market Share (Nutraceuticals, North America): 70%
- Market Share (Nutraceuticals, Europe): 65%
- Dominance Factors: High disposable income, advanced healthcare, consumer engagement with wellness.
- Dominant Amino Acid Types: Glutamic Acid & Lysine
- Estimated Market Share (Glutamic Acid): 25%
- Estimated Market Share (Lysine): 20%
- Growth Drivers: Versatile applications, essential nutritional value.
Food Amino Acids Product Landscape
The food amino acids product landscape is characterized by continuous innovation aimed at enhancing purity, bioavailability, and functionality. Companies are focusing on developing specialized amino acid blends for targeted applications, such as post-workout recovery supplements, cognitive enhancers, and immune boosters. Advancements in manufacturing processes, including enzymatic synthesis and precision fermentation, are enabling the production of high-quality, cost-effective amino acids with unique properties. For instance, novel delivery systems are being explored to improve amino acid absorption rates. Product performance metrics are increasingly evaluated based on efficacy, safety, and sustainability. Unique selling propositions revolve around natural sourcing, allergen-free formulations, and enhanced nutritional profiles, catering to the growing demand for clean-label products. Technological advancements are also enabling the development of amino acid derivatives with improved stability and shelf life for diverse food matrices.
Key Drivers, Barriers & Challenges in Food Amino Acids
Key Drivers: The food amino acids market is propelled by several key drivers. Increasing health and wellness awareness among consumers worldwide is a primary catalyst, leading to higher demand for dietary supplements and fortified foods that incorporate amino acids for various health benefits. The growing prevalence of chronic diseases and an aging global population further fuel the need for nutritional interventions that support overall well-being. Technological advancements in fermentation and biotechnology are making production more efficient and cost-effective, thereby expanding market accessibility. Furthermore, the expansion of the global food and beverage industry, particularly in emerging economies, creates a larger base for the incorporation of amino acids as functional ingredients.
Barriers & Challenges: Despite the positive growth trajectory, the food amino acids market faces several barriers and challenges. Stringent regulatory approvals for new ingredients and applications, particularly in the pharmaceutical and infant nutrition sectors, can slow down market entry and product launches, representing a significant hurdle. Fluctuations in raw material prices and the complexity of supply chains can impact production costs and availability, posing a challenge for manufacturers. Consumer perception and education surrounding the benefits and safety of certain amino acid derivatives, such as MSG, remain a concern, necessitating ongoing marketing and educational efforts. The highly competitive landscape with established players and emerging innovators can lead to price pressures and necessitate continuous investment in research and development to maintain market share.
Emerging Opportunities in Food Amino Acids
Emerging opportunities in the food amino acids sector are abundant, driven by evolving consumer preferences and scientific advancements. The demand for plant-based protein alternatives is creating a significant opportunity for amino acid fortification to ensure complete amino acid profiles. Furthermore, the growing interest in personalized nutrition presents a lucrative avenue, with tailored amino acid formulations catering to specific genetic predispositions, activity levels, and health goals. The expansion of sports nutrition and performance enhancement products is another key opportunity, as athletes and fitness enthusiasts increasingly recognize the role of amino acids in muscle recovery and performance. Innovations in bioavailability enhancement technologies and novel delivery systems for amino acids are also opening up new application possibilities in functional foods and beverages, promising improved efficacy and consumer experience. The untapped potential in developing countries with growing middle classes and increasing health consciousness also represents a significant growth frontier.
Growth Accelerators in the Food Amino Acids Industry
Several factors are acting as growth accelerators for the food amino acids industry. Continuous research and development into the health benefits of various amino acids are uncovering new applications and reinforcing existing ones, driving demand from both consumers and formulators. Strategic partnerships and collaborations between amino acid manufacturers, food and beverage companies, and research institutions are fostering innovation and accelerating product development cycles. The increasing adoption of advanced manufacturing technologies, such as AI-driven process optimization and sustainable fermentation techniques, is enhancing efficiency, reducing costs, and improving product quality, thereby accelerating market expansion. Furthermore, favorable government initiatives and funding for health and nutrition research and development in key markets are providing further impetus for growth.
Key Players Shaping the Food Amino Acids Market
- Ajinomoto
- Kyowa Hakko Kirin
- Evonik Industries
- Sigma-Aldrich
- Prinova
- Daesang
- Shaoxing Yamei Biotechnology
- Qingdao Samin Chemical
- Hugestone Enterprise
- Brenntag
- Pangaea Sciences
- Amino
- Kingchem
- Rochem International
- Sunrise Nutrachem
- Monteloeder
- Kraemer Martin
- Pacific Rainbow International
Notable Milestones in Food Amino Acids Sector
- 2019: Launch of novel, highly bioavailable Lysine formulation by a leading player, enhancing muscle protein synthesis for sports nutrition.
- 2020: Increased demand for immune-boosting supplements containing essential amino acids like Arginine and Glutamine due to global health concerns.
- 2021: Significant advancements in precision fermentation techniques for producing L-Tryptophan sustainably and cost-effectively.
- 2022: Acquisition of a specialized amino acid ingredient supplier by a major food ingredient distributor to expand its portfolio and market reach.
- 2023: Introduction of plant-based infant formula fortified with a complete profile of essential amino acids, addressing growing vegan and vegetarian consumer bases.
- 2024: Expansion of production capacity for Methionine by key manufacturers to meet the rising demand in animal feed applications.
In-Depth Food Amino Acids Market Outlook
The future outlook for the food amino acids market remains exceptionally positive, driven by a robust combination of sustained consumer demand for health-enhancing products and ongoing technological innovation. Growth accelerators such as pioneering research into the multifaceted benefits of amino acids, strategic alliances across the value chain, and the widespread adoption of cutting-edge biotechnological production methods will continue to fuel market expansion. The market is poised for further penetration into emerging economies as awareness of nutritional science grows. Strategic opportunities lie in developing specialized amino acid blends for personalized nutrition, catering to the increasing demand for customized health solutions, and further enhancing the sustainability of production processes to align with global environmental goals. The continuous evolution of the food and beverage industry towards functional and fortified products ensures a dynamic and promising future for the food amino acids sector.
Food Amino Acids Segmentation
-
1. Application
- 1.1. Nutraceutical & Dietary Supplements
- 1.2. Infant Formula
- 1.3. Food Fortification
- 1.4. Convenience Foods
-
2. Types
- 2.1. Glutamic Acid
- 2.2. Lysine
- 2.3. Tryptophan
- 2.4. Methionine
Food Amino Acids Segmentation By Geography
-
1. North America
- 1.1. United States
- 1.2. Canada
- 1.3. Mexico
-
2. South America
- 2.1. Brazil
- 2.2. Argentina
- 2.3. Rest of South America
-
3. Europe
- 3.1. United Kingdom
- 3.2. Germany
- 3.3. France
- 3.4. Italy
- 3.5. Spain
- 3.6. Russia
- 3.7. Benelux
- 3.8. Nordics
- 3.9. Rest of Europe
-
4. Middle East & Africa
- 4.1. Turkey
- 4.2. Israel
- 4.3. GCC
- 4.4. North Africa
- 4.5. South Africa
- 4.6. Rest of Middle East & Africa
-
5. Asia Pacific
- 5.1. China
- 5.2. India
- 5.3. Japan
- 5.4. South Korea
- 5.5. ASEAN
- 5.6. Oceania
- 5.7. Rest of Asia Pacific
Food Amino Acids Regional Market Share
Geographic Coverage of Food Amino Acids
Food Amino Acids REPORT HIGHLIGHTS
| Aspects | Details |
|---|---|
| Study Period | 2020-2034 |
| Base Year | 2025 |
| Estimated Year | 2026 |
| Forecast Period | 2026-2034 |
| Historical Period | 2020-2025 |
| Growth Rate | CAGR of 7.1% from 2020-2034 |
| Segmentation |
|
Table of Contents
- 1. Introduction
- 1.1. Research Scope
- 1.2. Market Segmentation
- 1.3. Research Objective
- 1.4. Definitions and Assumptions
- 2. Executive Summary
- 2.1. Market Snapshot
- 3. Market Dynamics
- 3.1. Market Drivers
- 3.2. Market Restrains
- 3.3. Market Trends
- 3.4. Market Opportunities
- 4. Market Factor Analysis
- 4.1. Porters Five Forces
- 4.1.1. Bargaining Power of Suppliers
- 4.1.2. Bargaining Power of Buyers
- 4.1.3. Threat of New Entrants
- 4.1.4. Threat of Substitutes
- 4.1.5. Competitive Rivalry
- 4.2. PESTEL analysis
- 4.3. BCG Analysis
- 4.3.1. Stars (High Growth, High Market Share)
- 4.3.2. Cash Cows (Low Growth, High Market Share)
- 4.3.3. Question Mark (High Growth, Low Market Share)
- 4.3.4. Dogs (Low Growth, Low Market Share)
- 4.4. Ansoff Matrix Analysis
- 4.5. Supply Chain Analysis
- 4.6. Regulatory Landscape
- 4.7. Current Market Potential and Opportunity Assessment (TAM–SAM–SOM Framework)
- 4.8. IMR Analyst Note
- 4.1. Porters Five Forces
- 5. Market Analysis, Insights and Forecast 2021-2033
- 5.1. Market Analysis, Insights and Forecast - by Application
- 5.1.1. Nutraceutical & Dietary Supplements
- 5.1.2. Infant Formula
- 5.1.3. Food Fortification
- 5.1.4. Convenience Foods
- 5.2. Market Analysis, Insights and Forecast - by Types
- 5.2.1. Glutamic Acid
- 5.2.2. Lysine
- 5.2.3. Tryptophan
- 5.2.4. Methionine
- 5.3. Market Analysis, Insights and Forecast - by Region
- 5.3.1. North America
- 5.3.2. South America
- 5.3.3. Europe
- 5.3.4. Middle East & Africa
- 5.3.5. Asia Pacific
- 5.1. Market Analysis, Insights and Forecast - by Application
- 6. Global Food Amino Acids Analysis, Insights and Forecast, 2021-2033
- 6.1. Market Analysis, Insights and Forecast - by Application
- 6.1.1. Nutraceutical & Dietary Supplements
- 6.1.2. Infant Formula
- 6.1.3. Food Fortification
- 6.1.4. Convenience Foods
- 6.2. Market Analysis, Insights and Forecast - by Types
- 6.2.1. Glutamic Acid
- 6.2.2. Lysine
- 6.2.3. Tryptophan
- 6.2.4. Methionine
- 6.1. Market Analysis, Insights and Forecast - by Application
- 7. North America Food Amino Acids Analysis, Insights and Forecast, 2020-2032
- 7.1. Market Analysis, Insights and Forecast - by Application
- 7.1.1. Nutraceutical & Dietary Supplements
- 7.1.2. Infant Formula
- 7.1.3. Food Fortification
- 7.1.4. Convenience Foods
- 7.2. Market Analysis, Insights and Forecast - by Types
- 7.2.1. Glutamic Acid
- 7.2.2. Lysine
- 7.2.3. Tryptophan
- 7.2.4. Methionine
- 7.1. Market Analysis, Insights and Forecast - by Application
- 8. South America Food Amino Acids Analysis, Insights and Forecast, 2020-2032
- 8.1. Market Analysis, Insights and Forecast - by Application
- 8.1.1. Nutraceutical & Dietary Supplements
- 8.1.2. Infant Formula
- 8.1.3. Food Fortification
- 8.1.4. Convenience Foods
- 8.2. Market Analysis, Insights and Forecast - by Types
- 8.2.1. Glutamic Acid
- 8.2.2. Lysine
- 8.2.3. Tryptophan
- 8.2.4. Methionine
- 8.1. Market Analysis, Insights and Forecast - by Application
- 9. Europe Food Amino Acids Analysis, Insights and Forecast, 2020-2032
- 9.1. Market Analysis, Insights and Forecast - by Application
- 9.1.1. Nutraceutical & Dietary Supplements
- 9.1.2. Infant Formula
- 9.1.3. Food Fortification
- 9.1.4. Convenience Foods
- 9.2. Market Analysis, Insights and Forecast - by Types
- 9.2.1. Glutamic Acid
- 9.2.2. Lysine
- 9.2.3. Tryptophan
- 9.2.4. Methionine
- 9.1. Market Analysis, Insights and Forecast - by Application
- 10. Middle East & Africa Food Amino Acids Analysis, Insights and Forecast, 2020-2032
- 10.1. Market Analysis, Insights and Forecast - by Application
- 10.1.1. Nutraceutical & Dietary Supplements
- 10.1.2. Infant Formula
- 10.1.3. Food Fortification
- 10.1.4. Convenience Foods
- 10.2. Market Analysis, Insights and Forecast - by Types
- 10.2.1. Glutamic Acid
- 10.2.2. Lysine
- 10.2.3. Tryptophan
- 10.2.4. Methionine
- 10.1. Market Analysis, Insights and Forecast - by Application
- 11. Asia Pacific Food Amino Acids Analysis, Insights and Forecast, 2020-2032
- 11.1. Market Analysis, Insights and Forecast - by Application
- 11.1.1. Nutraceutical & Dietary Supplements
- 11.1.2. Infant Formula
- 11.1.3. Food Fortification
- 11.1.4. Convenience Foods
- 11.2. Market Analysis, Insights and Forecast - by Types
- 11.2.1. Glutamic Acid
- 11.2.2. Lysine
- 11.2.3. Tryptophan
- 11.2.4. Methionine
- 11.1. Market Analysis, Insights and Forecast - by Application
- 12. Competitive Analysis
- 12.1. Company Profiles
- 12.1.1 Ajinomoto
- 12.1.1.1. Company Overview
- 12.1.1.2. Products
- 12.1.1.3. Company Financials
- 12.1.1.4. SWOT Analysis
- 12.1.2 Kyowa Hakko Kirin
- 12.1.2.1. Company Overview
- 12.1.2.2. Products
- 12.1.2.3. Company Financials
- 12.1.2.4. SWOT Analysis
- 12.1.3 Evonik Industries
- 12.1.3.1. Company Overview
- 12.1.3.2. Products
- 12.1.3.3. Company Financials
- 12.1.3.4. SWOT Analysis
- 12.1.4 Sigma-Aldrich
- 12.1.4.1. Company Overview
- 12.1.4.2. Products
- 12.1.4.3. Company Financials
- 12.1.4.4. SWOT Analysis
- 12.1.5 Prinova
- 12.1.5.1. Company Overview
- 12.1.5.2. Products
- 12.1.5.3. Company Financials
- 12.1.5.4. SWOT Analysis
- 12.1.6 Daesang
- 12.1.6.1. Company Overview
- 12.1.6.2. Products
- 12.1.6.3. Company Financials
- 12.1.6.4. SWOT Analysis
- 12.1.7 Shaoxing Yamei Biotechnology
- 12.1.7.1. Company Overview
- 12.1.7.2. Products
- 12.1.7.3. Company Financials
- 12.1.7.4. SWOT Analysis
- 12.1.8 Qingdao Samin Chemical
- 12.1.8.1. Company Overview
- 12.1.8.2. Products
- 12.1.8.3. Company Financials
- 12.1.8.4. SWOT Analysis
- 12.1.9 Hugestone Enterprise
- 12.1.9.1. Company Overview
- 12.1.9.2. Products
- 12.1.9.3. Company Financials
- 12.1.9.4. SWOT Analysis
- 12.1.10 Brenntag
- 12.1.10.1. Company Overview
- 12.1.10.2. Products
- 12.1.10.3. Company Financials
- 12.1.10.4. SWOT Analysis
- 12.1.11 Pangaea Sciences
- 12.1.11.1. Company Overview
- 12.1.11.2. Products
- 12.1.11.3. Company Financials
- 12.1.11.4. SWOT Analysis
- 12.1.12 Amino
- 12.1.12.1. Company Overview
- 12.1.12.2. Products
- 12.1.12.3. Company Financials
- 12.1.12.4. SWOT Analysis
- 12.1.13 Kingchem
- 12.1.13.1. Company Overview
- 12.1.13.2. Products
- 12.1.13.3. Company Financials
- 12.1.13.4. SWOT Analysis
- 12.1.14 Rochem International
- 12.1.14.1. Company Overview
- 12.1.14.2. Products
- 12.1.14.3. Company Financials
- 12.1.14.4. SWOT Analysis
- 12.1.15 Sunrise Nutrachem
- 12.1.15.1. Company Overview
- 12.1.15.2. Products
- 12.1.15.3. Company Financials
- 12.1.15.4. SWOT Analysis
- 12.1.16 Monteloeder
- 12.1.16.1. Company Overview
- 12.1.16.2. Products
- 12.1.16.3. Company Financials
- 12.1.16.4. SWOT Analysis
- 12.1.17 Kraemer Martin
- 12.1.17.1. Company Overview
- 12.1.17.2. Products
- 12.1.17.3. Company Financials
- 12.1.17.4. SWOT Analysis
- 12.1.18 Pacific Rainbow International
- 12.1.18.1. Company Overview
- 12.1.18.2. Products
- 12.1.18.3. Company Financials
- 12.1.18.4. SWOT Analysis
- 12.1.1 Ajinomoto
- 12.2. Market Entropy
- 12.2.1 Company's Key Areas Served
- 12.2.2 Recent Developments
- 12.3. Company Market Share Analysis 2025
- 12.3.1 Top 5 Companies Market Share Analysis
- 12.3.2 Top 3 Companies Market Share Analysis
- 12.4. List of Potential Customers
- 13. Research Methodology
List of Figures
- Figure 1: Global Food Amino Acids Revenue Breakdown (billion, %) by Region 2025 & 2033
- Figure 2: Global Food Amino Acids Volume Breakdown (K, %) by Region 2025 & 2033
- Figure 3: North America Food Amino Acids Revenue (billion), by Application 2025 & 2033
- Figure 4: North America Food Amino Acids Volume (K), by Application 2025 & 2033
- Figure 5: North America Food Amino Acids Revenue Share (%), by Application 2025 & 2033
- Figure 6: North America Food Amino Acids Volume Share (%), by Application 2025 & 2033
- Figure 7: North America Food Amino Acids Revenue (billion), by Types 2025 & 2033
- Figure 8: North America Food Amino Acids Volume (K), by Types 2025 & 2033
- Figure 9: North America Food Amino Acids Revenue Share (%), by Types 2025 & 2033
- Figure 10: North America Food Amino Acids Volume Share (%), by Types 2025 & 2033
- Figure 11: North America Food Amino Acids Revenue (billion), by Country 2025 & 2033
- Figure 12: North America Food Amino Acids Volume (K), by Country 2025 & 2033
- Figure 13: North America Food Amino Acids Revenue Share (%), by Country 2025 & 2033
- Figure 14: North America Food Amino Acids Volume Share (%), by Country 2025 & 2033
- Figure 15: South America Food Amino Acids Revenue (billion), by Application 2025 & 2033
- Figure 16: South America Food Amino Acids Volume (K), by Application 2025 & 2033
- Figure 17: South America Food Amino Acids Revenue Share (%), by Application 2025 & 2033
- Figure 18: South America Food Amino Acids Volume Share (%), by Application 2025 & 2033
- Figure 19: South America Food Amino Acids Revenue (billion), by Types 2025 & 2033
- Figure 20: South America Food Amino Acids Volume (K), by Types 2025 & 2033
- Figure 21: South America Food Amino Acids Revenue Share (%), by Types 2025 & 2033
- Figure 22: South America Food Amino Acids Volume Share (%), by Types 2025 & 2033
- Figure 23: South America Food Amino Acids Revenue (billion), by Country 2025 & 2033
- Figure 24: South America Food Amino Acids Volume (K), by Country 2025 & 2033
- Figure 25: South America Food Amino Acids Revenue Share (%), by Country 2025 & 2033
- Figure 26: South America Food Amino Acids Volume Share (%), by Country 2025 & 2033
- Figure 27: Europe Food Amino Acids Revenue (billion), by Application 2025 & 2033
- Figure 28: Europe Food Amino Acids Volume (K), by Application 2025 & 2033
- Figure 29: Europe Food Amino Acids Revenue Share (%), by Application 2025 & 2033
- Figure 30: Europe Food Amino Acids Volume Share (%), by Application 2025 & 2033
- Figure 31: Europe Food Amino Acids Revenue (billion), by Types 2025 & 2033
- Figure 32: Europe Food Amino Acids Volume (K), by Types 2025 & 2033
- Figure 33: Europe Food Amino Acids Revenue Share (%), by Types 2025 & 2033
- Figure 34: Europe Food Amino Acids Volume Share (%), by Types 2025 & 2033
- Figure 35: Europe Food Amino Acids Revenue (billion), by Country 2025 & 2033
- Figure 36: Europe Food Amino Acids Volume (K), by Country 2025 & 2033
- Figure 37: Europe Food Amino Acids Revenue Share (%), by Country 2025 & 2033
- Figure 38: Europe Food Amino Acids Volume Share (%), by Country 2025 & 2033
- Figure 39: Middle East & Africa Food Amino Acids Revenue (billion), by Application 2025 & 2033
- Figure 40: Middle East & Africa Food Amino Acids Volume (K), by Application 2025 & 2033
- Figure 41: Middle East & Africa Food Amino Acids Revenue Share (%), by Application 2025 & 2033
- Figure 42: Middle East & Africa Food Amino Acids Volume Share (%), by Application 2025 & 2033
- Figure 43: Middle East & Africa Food Amino Acids Revenue (billion), by Types 2025 & 2033
- Figure 44: Middle East & Africa Food Amino Acids Volume (K), by Types 2025 & 2033
- Figure 45: Middle East & Africa Food Amino Acids Revenue Share (%), by Types 2025 & 2033
- Figure 46: Middle East & Africa Food Amino Acids Volume Share (%), by Types 2025 & 2033
- Figure 47: Middle East & Africa Food Amino Acids Revenue (billion), by Country 2025 & 2033
- Figure 48: Middle East & Africa Food Amino Acids Volume (K), by Country 2025 & 2033
- Figure 49: Middle East & Africa Food Amino Acids Revenue Share (%), by Country 2025 & 2033
- Figure 50: Middle East & Africa Food Amino Acids Volume Share (%), by Country 2025 & 2033
- Figure 51: Asia Pacific Food Amino Acids Revenue (billion), by Application 2025 & 2033
- Figure 52: Asia Pacific Food Amino Acids Volume (K), by Application 2025 & 2033
- Figure 53: Asia Pacific Food Amino Acids Revenue Share (%), by Application 2025 & 2033
- Figure 54: Asia Pacific Food Amino Acids Volume Share (%), by Application 2025 & 2033
- Figure 55: Asia Pacific Food Amino Acids Revenue (billion), by Types 2025 & 2033
- Figure 56: Asia Pacific Food Amino Acids Volume (K), by Types 2025 & 2033
- Figure 57: Asia Pacific Food Amino Acids Revenue Share (%), by Types 2025 & 2033
- Figure 58: Asia Pacific Food Amino Acids Volume Share (%), by Types 2025 & 2033
- Figure 59: Asia Pacific Food Amino Acids Revenue (billion), by Country 2025 & 2033
- Figure 60: Asia Pacific Food Amino Acids Volume (K), by Country 2025 & 2033
- Figure 61: Asia Pacific Food Amino Acids Revenue Share (%), by Country 2025 & 2033
- Figure 62: Asia Pacific Food Amino Acids Volume Share (%), by Country 2025 & 2033
List of Tables
- Table 1: Global Food Amino Acids Revenue billion Forecast, by Application 2020 & 2033
- Table 2: Global Food Amino Acids Volume K Forecast, by Application 2020 & 2033
- Table 3: Global Food Amino Acids Revenue billion Forecast, by Types 2020 & 2033
- Table 4: Global Food Amino Acids Volume K Forecast, by Types 2020 & 2033
- Table 5: Global Food Amino Acids Revenue billion Forecast, by Region 2020 & 2033
- Table 6: Global Food Amino Acids Volume K Forecast, by Region 2020 & 2033
- Table 7: Global Food Amino Acids Revenue billion Forecast, by Application 2020 & 2033
- Table 8: Global Food Amino Acids Volume K Forecast, by Application 2020 & 2033
- Table 9: Global Food Amino Acids Revenue billion Forecast, by Types 2020 & 2033
- Table 10: Global Food Amino Acids Volume K Forecast, by Types 2020 & 2033
- Table 11: Global Food Amino Acids Revenue billion Forecast, by Country 2020 & 2033
- Table 12: Global Food Amino Acids Volume K Forecast, by Country 2020 & 2033
- Table 13: United States Food Amino Acids Revenue (billion) Forecast, by Application 2020 & 2033
- Table 14: United States Food Amino Acids Volume (K) Forecast, by Application 2020 & 2033
- Table 15: Canada Food Amino Acids Revenue (billion) Forecast, by Application 2020 & 2033
- Table 16: Canada Food Amino Acids Volume (K) Forecast, by Application 2020 & 2033
- Table 17: Mexico Food Amino Acids Revenue (billion) Forecast, by Application 2020 & 2033
- Table 18: Mexico Food Amino Acids Volume (K) Forecast, by Application 2020 & 2033
- Table 19: Global Food Amino Acids Revenue billion Forecast, by Application 2020 & 2033
- Table 20: Global Food Amino Acids Volume K Forecast, by Application 2020 & 2033
- Table 21: Global Food Amino Acids Revenue billion Forecast, by Types 2020 & 2033
- Table 22: Global Food Amino Acids Volume K Forecast, by Types 2020 & 2033
- Table 23: Global Food Amino Acids Revenue billion Forecast, by Country 2020 & 2033
- Table 24: Global Food Amino Acids Volume K Forecast, by Country 2020 & 2033
- Table 25: Brazil Food Amino Acids Revenue (billion) Forecast, by Application 2020 & 2033
- Table 26: Brazil Food Amino Acids Volume (K) Forecast, by Application 2020 & 2033
- Table 27: Argentina Food Amino Acids Revenue (billion) Forecast, by Application 2020 & 2033
- Table 28: Argentina Food Amino Acids Volume (K) Forecast, by Application 2020 & 2033
- Table 29: Rest of South America Food Amino Acids Revenue (billion) Forecast, by Application 2020 & 2033
- Table 30: Rest of South America Food Amino Acids Volume (K) Forecast, by Application 2020 & 2033
- Table 31: Global Food Amino Acids Revenue billion Forecast, by Application 2020 & 2033
- Table 32: Global Food Amino Acids Volume K Forecast, by Application 2020 & 2033
- Table 33: Global Food Amino Acids Revenue billion Forecast, by Types 2020 & 2033
- Table 34: Global Food Amino Acids Volume K Forecast, by Types 2020 & 2033
- Table 35: Global Food Amino Acids Revenue billion Forecast, by Country 2020 & 2033
- Table 36: Global Food Amino Acids Volume K Forecast, by Country 2020 & 2033
- Table 37: United Kingdom Food Amino Acids Revenue (billion) Forecast, by Application 2020 & 2033
- Table 38: United Kingdom Food Amino Acids Volume (K) Forecast, by Application 2020 & 2033
- Table 39: Germany Food Amino Acids Revenue (billion) Forecast, by Application 2020 & 2033
- Table 40: Germany Food Amino Acids Volume (K) Forecast, by Application 2020 & 2033
- Table 41: France Food Amino Acids Revenue (billion) Forecast, by Application 2020 & 2033
- Table 42: France Food Amino Acids Volume (K) Forecast, by Application 2020 & 2033
- Table 43: Italy Food Amino Acids Revenue (billion) Forecast, by Application 2020 & 2033
- Table 44: Italy Food Amino Acids Volume (K) Forecast, by Application 2020 & 2033
- Table 45: Spain Food Amino Acids Revenue (billion) Forecast, by Application 2020 & 2033
- Table 46: Spain Food Amino Acids Volume (K) Forecast, by Application 2020 & 2033
- Table 47: Russia Food Amino Acids Revenue (billion) Forecast, by Application 2020 & 2033
- Table 48: Russia Food Amino Acids Volume (K) Forecast, by Application 2020 & 2033
- Table 49: Benelux Food Amino Acids Revenue (billion) Forecast, by Application 2020 & 2033
- Table 50: Benelux Food Amino Acids Volume (K) Forecast, by Application 2020 & 2033
- Table 51: Nordics Food Amino Acids Revenue (billion) Forecast, by Application 2020 & 2033
- Table 52: Nordics Food Amino Acids Volume (K) Forecast, by Application 2020 & 2033
- Table 53: Rest of Europe Food Amino Acids Revenue (billion) Forecast, by Application 2020 & 2033
- Table 54: Rest of Europe Food Amino Acids Volume (K) Forecast, by Application 2020 & 2033
- Table 55: Global Food Amino Acids Revenue billion Forecast, by Application 2020 & 2033
- Table 56: Global Food Amino Acids Volume K Forecast, by Application 2020 & 2033
- Table 57: Global Food Amino Acids Revenue billion Forecast, by Types 2020 & 2033
- Table 58: Global Food Amino Acids Volume K Forecast, by Types 2020 & 2033
- Table 59: Global Food Amino Acids Revenue billion Forecast, by Country 2020 & 2033
- Table 60: Global Food Amino Acids Volume K Forecast, by Country 2020 & 2033
- Table 61: Turkey Food Amino Acids Revenue (billion) Forecast, by Application 2020 & 2033
- Table 62: Turkey Food Amino Acids Volume (K) Forecast, by Application 2020 & 2033
- Table 63: Israel Food Amino Acids Revenue (billion) Forecast, by Application 2020 & 2033
- Table 64: Israel Food Amino Acids Volume (K) Forecast, by Application 2020 & 2033
- Table 65: GCC Food Amino Acids Revenue (billion) Forecast, by Application 2020 & 2033
- Table 66: GCC Food Amino Acids Volume (K) Forecast, by Application 2020 & 2033
- Table 67: North Africa Food Amino Acids Revenue (billion) Forecast, by Application 2020 & 2033
- Table 68: North Africa Food Amino Acids Volume (K) Forecast, by Application 2020 & 2033
- Table 69: South Africa Food Amino Acids Revenue (billion) Forecast, by Application 2020 & 2033
- Table 70: South Africa Food Amino Acids Volume (K) Forecast, by Application 2020 & 2033
- Table 71: Rest of Middle East & Africa Food Amino Acids Revenue (billion) Forecast, by Application 2020 & 2033
- Table 72: Rest of Middle East & Africa Food Amino Acids Volume (K) Forecast, by Application 2020 & 2033
- Table 73: Global Food Amino Acids Revenue billion Forecast, by Application 2020 & 2033
- Table 74: Global Food Amino Acids Volume K Forecast, by Application 2020 & 2033
- Table 75: Global Food Amino Acids Revenue billion Forecast, by Types 2020 & 2033
- Table 76: Global Food Amino Acids Volume K Forecast, by Types 2020 & 2033
- Table 77: Global Food Amino Acids Revenue billion Forecast, by Country 2020 & 2033
- Table 78: Global Food Amino Acids Volume K Forecast, by Country 2020 & 2033
- Table 79: China Food Amino Acids Revenue (billion) Forecast, by Application 2020 & 2033
- Table 80: China Food Amino Acids Volume (K) Forecast, by Application 2020 & 2033
- Table 81: India Food Amino Acids Revenue (billion) Forecast, by Application 2020 & 2033
- Table 82: India Food Amino Acids Volume (K) Forecast, by Application 2020 & 2033
- Table 83: Japan Food Amino Acids Revenue (billion) Forecast, by Application 2020 & 2033
- Table 84: Japan Food Amino Acids Volume (K) Forecast, by Application 2020 & 2033
- Table 85: South Korea Food Amino Acids Revenue (billion) Forecast, by Application 2020 & 2033
- Table 86: South Korea Food Amino Acids Volume (K) Forecast, by Application 2020 & 2033
- Table 87: ASEAN Food Amino Acids Revenue (billion) Forecast, by Application 2020 & 2033
- Table 88: ASEAN Food Amino Acids Volume (K) Forecast, by Application 2020 & 2033
- Table 89: Oceania Food Amino Acids Revenue (billion) Forecast, by Application 2020 & 2033
- Table 90: Oceania Food Amino Acids Volume (K) Forecast, by Application 2020 & 2033
- Table 91: Rest of Asia Pacific Food Amino Acids Revenue (billion) Forecast, by Application 2020 & 2033
- Table 92: Rest of Asia Pacific Food Amino Acids Volume (K) Forecast, by Application 2020 & 2033
Frequently Asked Questions
1. What is the projected Compound Annual Growth Rate (CAGR) of the Food Amino Acids?
The projected CAGR is approximately 7.1%.
2. Which companies are prominent players in the Food Amino Acids?
Key companies in the market include Ajinomoto, Kyowa Hakko Kirin, Evonik Industries, Sigma-Aldrich, Prinova, Daesang, Shaoxing Yamei Biotechnology, Qingdao Samin Chemical, Hugestone Enterprise, Brenntag, Pangaea Sciences, Amino, Kingchem, Rochem International, Sunrise Nutrachem, Monteloeder, Kraemer Martin, Pacific Rainbow International.
3. What are the main segments of the Food Amino Acids?
The market segments include Application, Types.
4. Can you provide details about the market size?
The market size is estimated to be USD 32.57 billion as of 2022.
5. What are some drivers contributing to market growth?
N/A
6. What are the notable trends driving market growth?
N/A
7. Are there any restraints impacting market growth?
N/A
8. Can you provide examples of recent developments in the market?
N/A
9. What pricing options are available for accessing the report?
Pricing options include single-user, multi-user, and enterprise licenses priced at USD 3350.00, USD 5025.00, and USD 6700.00 respectively.
10. Is the market size provided in terms of value or volume?
The market size is provided in terms of value, measured in billion and volume, measured in K.
11. Are there any specific market keywords associated with the report?
Yes, the market keyword associated with the report is "Food Amino Acids," which aids in identifying and referencing the specific market segment covered.
12. How do I determine which pricing option suits my needs best?
The pricing options vary based on user requirements and access needs. Individual users may opt for single-user licenses, while businesses requiring broader access may choose multi-user or enterprise licenses for cost-effective access to the report.
13. Are there any additional resources or data provided in the Food Amino Acids report?
While the report offers comprehensive insights, it's advisable to review the specific contents or supplementary materials provided to ascertain if additional resources or data are available.
14. How can I stay updated on further developments or reports in the Food Amino Acids?
To stay informed about further developments, trends, and reports in the Food Amino Acids, consider subscribing to industry newsletters, following relevant companies and organizations, or regularly checking reputable industry news sources and publications.
Methodology
Step 1 - Identification of Relevant Samples Size from Population Database


Step 2 - Approaches for Defining Global Market Size (Value, Volume* & Price*)

Note*: In applicable scenarios
Step 3 - Data Sources
Primary Research
- Web Analytics
- Survey Reports
- Research Institute
- Latest Research Reports
- Opinion Leaders
Secondary Research
- Annual Reports
- White Paper
- Latest Press Release
- Industry Association
- Paid Database
- Investor Presentations

Step 4 - Data Triangulation
Involves using different sources of information in order to increase the validity of a study
These sources are likely to be stakeholders in a program - participants, other researchers, program staff, other community members, and so on.
Then we put all data in single framework & apply various statistical tools to find out the dynamic on the market.
During the analysis stage, feedback from the stakeholder groups would be compared to determine areas of agreement as well as areas of divergence