

Key Insights
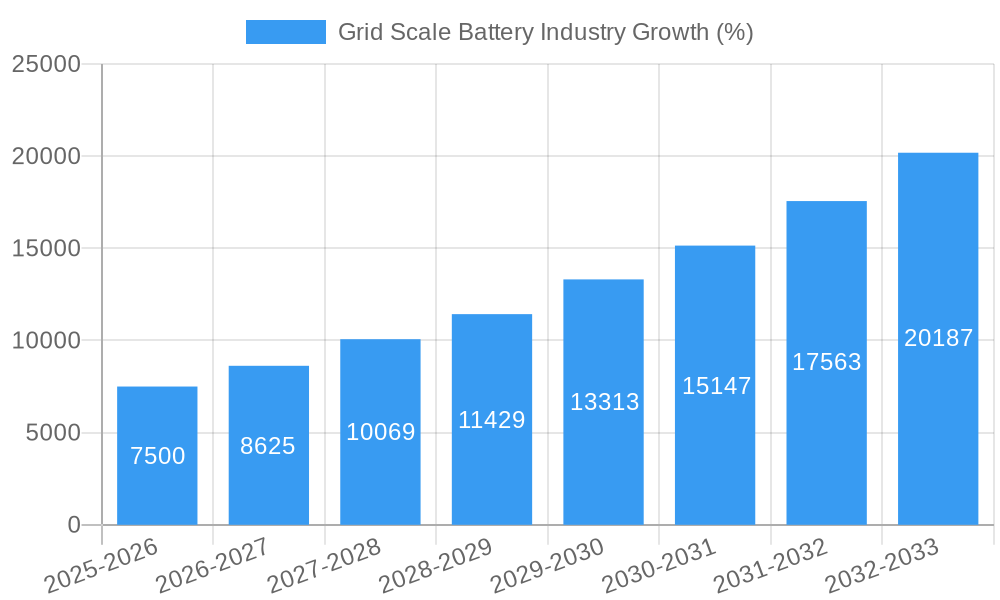
The grid-scale battery industry is experiencing explosive growth, driven by the increasing need for reliable and sustainable energy solutions. A compound annual growth rate (CAGR) exceeding 15% indicates a rapidly expanding market, projected to reach substantial value in the coming years. Key drivers include the intermittent nature of renewable energy sources like solar and wind, necessitating energy storage for grid stability and reliability. Furthermore, the increasing demand for frequency regulation, efficient bill management, and load shifting capabilities are significantly boosting market adoption. The shift towards smart grids and the integration of distributed energy resources further fuels this growth. While the industry faces challenges such as high initial investment costs and potential battery lifecycle concerns, ongoing technological advancements and supportive government policies are mitigating these restraints. Segmentation reveals a strong preference for Lithium-ion batteries due to their superior energy density and lifespan compared to Lead-acid alternatives, although the "Others" category, encompassing emerging technologies, represents a significant and growing market segment for future innovation. Geographically, North America and Asia Pacific are currently leading the market, driven by strong government support and large-scale renewable energy projects. However, Europe and other regions are rapidly catching up, demonstrating global interest in grid-scale battery solutions. The diverse applications across frequency regulation, bill management, load shifting, and renewable integration create a robust and diversified market, promising continued expansion throughout the forecast period (2025-2033). Major players, including Samsung SDI, LG Chem, Tesla, and BYD, are heavily investing in research and development, as well as expanding their manufacturing capabilities to meet the soaring demand.
The continued growth trajectory is expected to be sustained by several factors. Government initiatives promoting renewable energy integration and grid modernization are crucial. The decreasing cost of battery technology is also making grid-scale storage more economically viable. Moreover, advancements in battery chemistry, such as solid-state batteries, promise even higher energy density and safety, further propelling market expansion. Competition among major players is driving innovation and reducing prices, ensuring accessibility for a wider range of applications and geographical locations. The long-term outlook for the grid-scale battery industry remains exceptionally positive, with substantial opportunities for growth and technological advancement in the coming decade. The industry’s evolution is directly linked to the global transition towards cleaner and more sustainable energy systems.

Grid Scale Battery Industry Market Report: 2019-2033
This comprehensive report provides an in-depth analysis of the grid scale battery industry, encompassing market dynamics, growth trends, regional dominance, product landscape, key players, and future outlook. The study period covers 2019-2033, with a base year of 2025 and a forecast period of 2025-2033. This report is crucial for industry professionals, investors, and stakeholders seeking to understand the evolving landscape of this rapidly expanding market. The analysis includes detailed insights into parent markets (energy storage systems) and child markets (specific battery applications within grid infrastructure).
Grid Scale Battery Industry Market Dynamics & Structure
This section analyzes the competitive landscape of the grid-scale battery market, encompassing market concentration, technological innovation, regulatory influences, and competitive dynamics. The analysis considers market share distribution among key players, examining M&A activity and its impact on market structure. Quantitative data, such as market share percentages and M&A deal volumes (in millions of USD), will be presented alongside qualitative insights.
- Market Concentration: Analysis of the Herfindahl-Hirschman Index (HHI) to assess market concentration and identify dominant players. xx% of the market is currently controlled by the top 5 players.
- Technological Innovation: Examination of key technological advancements, including improvements in battery chemistry, energy density, and lifecycle management. Assessment of innovation barriers and R&D investments.
- Regulatory Frameworks: Analysis of government policies, subsidies, and regulations influencing market growth across different regions. Impact of carbon emission reduction targets and renewable energy integration mandates.
- Competitive Product Substitutes: Exploration of alternative energy storage technologies and their impact on market share. Assessment of the competitive advantages and disadvantages of grid-scale batteries compared to other options.
- End-User Demographics: Analysis of the diverse end-user segments (utilities, independent power producers, etc.) and their influence on market demand.
- M&A Trends: Review of significant mergers, acquisitions, and joint ventures in the industry during the historical and forecast periods, quantifying deal volume in millions of USD (xx Million USD in M&A activity from 2019-2024).
Grid Scale Battery Industry Growth Trends & Insights
This section provides a comprehensive overview of the grid scale battery market's growth trajectory, exploring market size evolution, adoption rates, technological disruptions, and changing consumer behavior (shifting demand from utilities towards independent power producers). The analysis utilizes statistical modelling to project market size and growth rates (CAGR).
Utilizing advanced statistical methodologies, this section projects a CAGR of xx% from 2025 to 2033. Market penetration is expected to reach xx% by 2033, driven by factors such as increasing renewable energy adoption, grid modernization initiatives, and declining battery costs. The detailed analysis will cover market size evolution (in Million units) across the study period and the impact of technological advancements and consumer behavior. Specific metrics will be included to illustrate market penetration and growth rates.
Dominant Regions, Countries, or Segments in Grid Scale Battery Industry
This section identifies leading regions, countries, and market segments (Application and Battery Type) within the grid scale battery industry. The analysis highlights key growth drivers and dominance factors, including economic policies, infrastructure development, and market share.
Leading Regions: North America and Europe are projected to be dominant regions, driven by supportive government policies and large-scale renewable energy integration projects. Asia-Pacific is expected to witness significant growth due to expanding energy demand and government initiatives.
Application Segments: Frequency regulation and renewable integration are identified as dominant application segments, expected to drive xx Million units growth in the forecast period.
Battery Type: Lithium-ion batteries are the leading battery type, however Lead-acid battery segment is anticipated to decline.
Key Drivers:
- Strong government support for renewable energy integration.
- Increasing demand for grid stabilization and reliability.
- Declining battery costs.
- Advanced grid modernization initiatives.
Dominance Factors:
- Robust regulatory frameworks encouraging renewable energy integration.
- Well-established grid infrastructure facilitating battery deployment.
- High concentration of renewable energy resources.
Grid Scale Battery Industry Product Landscape
This section details product innovations, applications, and performance metrics. The analysis will highlight the unique selling propositions (USPs) of various battery technologies, emphasizing energy density, lifespan, charging times, and safety features. The section also covers technological advancements in battery management systems (BMS) and energy storage solutions.
The grid-scale battery landscape is characterized by continuous innovation in battery chemistries (Lithium-ion and beyond), advancements in thermal management systems, and improved energy density. This leads to more efficient and cost-effective energy storage solutions for grid applications, with enhanced performance metrics like longer cycle life and faster charging capabilities.
Key Drivers, Barriers & Challenges in Grid Scale Battery Industry
This section analyzes the key factors driving market growth and the challenges hindering its expansion.
Key Drivers:
- Increasing penetration of renewable energy sources.
- Growing demand for grid modernization and stability.
- Government incentives and supportive policies.
- Technological advancements leading to reduced costs and improved performance.
Key Challenges and Restraints:
- High initial investment costs.
- Limited battery lifecycle and recycling infrastructure.
- Concerns about safety and environmental impact.
- Supply chain vulnerabilities affecting raw material availability. (Quantifiable impact: xx% increase in raw material costs projected by 2030).
Emerging Opportunities in Grid Scale Battery Industry
This section highlights emerging trends and opportunities, focusing on untapped markets, innovative applications, and evolving consumer preferences.
- Untapped Markets: Expanding into developing economies with growing energy demands and limited grid infrastructure.
- Innovative Applications: Integration of grid-scale batteries with smart grid technologies and microgrids.
- Evolving Consumer Preferences: Shifting demand towards sustainable and environmentally friendly energy storage solutions.
Growth Accelerators in the Grid Scale Battery Industry
Technological breakthroughs, strategic partnerships, and market expansion strategies are identified as significant catalysts driving long-term growth. The focus will be on advancements in battery technology and their impact on cost reduction and performance improvement. Strategic collaborations between battery manufacturers, energy companies, and technology providers will further propel market growth.
Key Players Shaping the Grid Scale Battery Industry Market
- Samsung SDI Co Ltd
- LG Chem Ltd
- East Penn Manufacturing Company
- Tesla Inc
- BYD Co Ltd
- GS Yuasa Corporation
- Clarios
- Contemporary Amperex Technology Co Ltd
- Panasonic Corporation
Notable Milestones in Grid Scale Battery Industry Sector
- 2020: Significant increase in government funding for grid-scale battery projects.
- 2021: Launch of several large-scale battery energy storage systems (BESS) projects.
- 2022: Major advancements in solid-state battery technology.
- 2023: Several strategic partnerships formed between energy companies and battery manufacturers. (Specific examples will be provided in the full report).
In-Depth Grid Scale Battery Industry Market Outlook
The grid-scale battery market is poised for significant growth over the next decade, driven by the increasing adoption of renewable energy, grid modernization initiatives, and technological advancements. Strategic opportunities exist for companies to invest in research and development, expand their manufacturing capacity, and develop innovative business models. The continued decline in battery costs and improvements in energy density will further enhance market potential.
Grid Scale Battery Industry Segmentation
-
1. Battery Type
- 1.1. Lead-Acid Battery
- 1.2. Lithium-ion Battery
- 1.3. Others
-
2. Application
- 2.1. Frequency Regulation
- 2.2. Bill Management
- 2.3. Load Shifting
- 2.4. Others (
Grid Scale Battery Industry Segmentation By Geography
- 1. North America
- 2. Europe
- 3. Asia Pacific
- 4. South America
- 5. Middle East and Africa

Grid Scale Battery Industry REPORT HIGHLIGHTS
| Aspects | Details |
|---|---|
| Study Period | 2019-2033 |
| Base Year | 2024 |
| Estimated Year | 2025 |
| Forecast Period | 2025-2033 |
| Historical Period | 2019-2024 |
| Growth Rate | CAGR of > 15.00% from 2019-2033 |
| Segmentation |
|
Table of Contents
- 1. Introduction
- 1.1. Research Scope
- 1.2. Market Segmentation
- 1.3. Research Methodology
- 1.4. Definitions and Assumptions
- 2. Executive Summary
- 2.1. Introduction
- 3. Market Dynamics
- 3.1. Introduction
- 3.2. Market Drivers
- 3.2.1. 4.; The High Amount of Waste Generation in the Country4.; The growing Focus on Non-Fossil Fuel Sources
- 3.3. Market Restrains
- 3.3.1. 4.; The Recycling Rate of Waste in Germany
- 3.4. Market Trends
- 3.4.1. Increasing Demand for Lithium-ion Battery
- 4. Market Factor Analysis
- 4.1. Porters Five Forces
- 4.2. Supply/Value Chain
- 4.3. PESTEL analysis
- 4.4. Market Entropy
- 4.5. Patent/Trademark Analysis
- 5. Global Grid Scale Battery Industry Analysis, Insights and Forecast, 2019-2031
- 5.1. Market Analysis, Insights and Forecast - by Battery Type
- 5.1.1. Lead-Acid Battery
- 5.1.2. Lithium-ion Battery
- 5.1.3. Others
- 5.2. Market Analysis, Insights and Forecast - by Application
- 5.2.1. Frequency Regulation
- 5.2.2. Bill Management
- 5.2.3. Load Shifting
- 5.2.4. Others (
- 5.3. Market Analysis, Insights and Forecast - by Region
- 5.3.1. North America
- 5.3.2. Europe
- 5.3.3. Asia Pacific
- 5.3.4. South America
- 5.3.5. Middle East and Africa
- 5.1. Market Analysis, Insights and Forecast - by Battery Type
- 6. North America Grid Scale Battery Industry Analysis, Insights and Forecast, 2019-2031
- 6.1. Market Analysis, Insights and Forecast - by Battery Type
- 6.1.1. Lead-Acid Battery
- 6.1.2. Lithium-ion Battery
- 6.1.3. Others
- 6.2. Market Analysis, Insights and Forecast - by Application
- 6.2.1. Frequency Regulation
- 6.2.2. Bill Management
- 6.2.3. Load Shifting
- 6.2.4. Others (
- 6.1. Market Analysis, Insights and Forecast - by Battery Type
- 7. Europe Grid Scale Battery Industry Analysis, Insights and Forecast, 2019-2031
- 7.1. Market Analysis, Insights and Forecast - by Battery Type
- 7.1.1. Lead-Acid Battery
- 7.1.2. Lithium-ion Battery
- 7.1.3. Others
- 7.2. Market Analysis, Insights and Forecast - by Application
- 7.2.1. Frequency Regulation
- 7.2.2. Bill Management
- 7.2.3. Load Shifting
- 7.2.4. Others (
- 7.1. Market Analysis, Insights and Forecast - by Battery Type
- 8. Asia Pacific Grid Scale Battery Industry Analysis, Insights and Forecast, 2019-2031
- 8.1. Market Analysis, Insights and Forecast - by Battery Type
- 8.1.1. Lead-Acid Battery
- 8.1.2. Lithium-ion Battery
- 8.1.3. Others
- 8.2. Market Analysis, Insights and Forecast - by Application
- 8.2.1. Frequency Regulation
- 8.2.2. Bill Management
- 8.2.3. Load Shifting
- 8.2.4. Others (
- 8.1. Market Analysis, Insights and Forecast - by Battery Type
- 9. South America Grid Scale Battery Industry Analysis, Insights and Forecast, 2019-2031
- 9.1. Market Analysis, Insights and Forecast - by Battery Type
- 9.1.1. Lead-Acid Battery
- 9.1.2. Lithium-ion Battery
- 9.1.3. Others
- 9.2. Market Analysis, Insights and Forecast - by Application
- 9.2.1. Frequency Regulation
- 9.2.2. Bill Management
- 9.2.3. Load Shifting
- 9.2.4. Others (
- 9.1. Market Analysis, Insights and Forecast - by Battery Type
- 10. Middle East and Africa Grid Scale Battery Industry Analysis, Insights and Forecast, 2019-2031
- 10.1. Market Analysis, Insights and Forecast - by Battery Type
- 10.1.1. Lead-Acid Battery
- 10.1.2. Lithium-ion Battery
- 10.1.3. Others
- 10.2. Market Analysis, Insights and Forecast - by Application
- 10.2.1. Frequency Regulation
- 10.2.2. Bill Management
- 10.2.3. Load Shifting
- 10.2.4. Others (
- 10.1. Market Analysis, Insights and Forecast - by Battery Type
- 11. North America Grid Scale Battery Industry Analysis, Insights and Forecast, 2019-2031
- 11.1. Market Analysis, Insights and Forecast - By Country/Sub-region
- 11.1.1 United States
- 11.1.2 Canada
- 11.1.3 Mexico
- 12. Europe Grid Scale Battery Industry Analysis, Insights and Forecast, 2019-2031
- 12.1. Market Analysis, Insights and Forecast - By Country/Sub-region
- 12.1.1 Germany
- 12.1.2 United Kingdom
- 12.1.3 France
- 12.1.4 Spain
- 12.1.5 Italy
- 12.1.6 Spain
- 12.1.7 Belgium
- 12.1.8 Netherland
- 12.1.9 Nordics
- 12.1.10 Rest of Europe
- 13. Asia Pacific Grid Scale Battery Industry Analysis, Insights and Forecast, 2019-2031
- 13.1. Market Analysis, Insights and Forecast - By Country/Sub-region
- 13.1.1 China
- 13.1.2 Japan
- 13.1.3 India
- 13.1.4 South Korea
- 13.1.5 Southeast Asia
- 13.1.6 Australia
- 13.1.7 Indonesia
- 13.1.8 Phillipes
- 13.1.9 Singapore
- 13.1.10 Thailandc
- 13.1.11 Rest of Asia Pacific
- 14. South America Grid Scale Battery Industry Analysis, Insights and Forecast, 2019-2031
- 14.1. Market Analysis, Insights and Forecast - By Country/Sub-region
- 14.1.1 Brazil
- 14.1.2 Argentina
- 14.1.3 Peru
- 14.1.4 Chile
- 14.1.5 Colombia
- 14.1.6 Ecuador
- 14.1.7 Venezuela
- 14.1.8 Rest of South America
- 15. North America Grid Scale Battery Industry Analysis, Insights and Forecast, 2019-2031
- 15.1. Market Analysis, Insights and Forecast - By Country/Sub-region
- 15.1.1 United States
- 15.1.2 Canada
- 15.1.3 Mexico
- 16. MEA Grid Scale Battery Industry Analysis, Insights and Forecast, 2019-2031
- 16.1. Market Analysis, Insights and Forecast - By Country/Sub-region
- 16.1.1 United Arab Emirates
- 16.1.2 Saudi Arabia
- 16.1.3 South Africa
- 16.1.4 Rest of Middle East and Africa
- 17. Competitive Analysis
- 17.1. Global Market Share Analysis 2024
- 17.2. Company Profiles
- 17.2.1 Samsung SDI Co Ltd
- 17.2.1.1. Overview
- 17.2.1.2. Products
- 17.2.1.3. SWOT Analysis
- 17.2.1.4. Recent Developments
- 17.2.1.5. Financials (Based on Availability)
- 17.2.2 LG Chem Ltd
- 17.2.2.1. Overview
- 17.2.2.2. Products
- 17.2.2.3. SWOT Analysis
- 17.2.2.4. Recent Developments
- 17.2.2.5. Financials (Based on Availability)
- 17.2.3 East Penn Manufacturing Company
- 17.2.3.1. Overview
- 17.2.3.2. Products
- 17.2.3.3. SWOT Analysis
- 17.2.3.4. Recent Developments
- 17.2.3.5. Financials (Based on Availability)
- 17.2.4 Tesla Inc
- 17.2.4.1. Overview
- 17.2.4.2. Products
- 17.2.4.3. SWOT Analysis
- 17.2.4.4. Recent Developments
- 17.2.4.5. Financials (Based on Availability)
- 17.2.5 BYD Co Ltd
- 17.2.5.1. Overview
- 17.2.5.2. Products
- 17.2.5.3. SWOT Analysis
- 17.2.5.4. Recent Developments
- 17.2.5.5. Financials (Based on Availability)
- 17.2.6 GS Yuasa Corporation
- 17.2.6.1. Overview
- 17.2.6.2. Products
- 17.2.6.3. SWOT Analysis
- 17.2.6.4. Recent Developments
- 17.2.6.5. Financials (Based on Availability)
- 17.2.7 Clarios*List Not Exhaustive
- 17.2.7.1. Overview
- 17.2.7.2. Products
- 17.2.7.3. SWOT Analysis
- 17.2.7.4. Recent Developments
- 17.2.7.5. Financials (Based on Availability)
- 17.2.8 Contemporary Amperex Technology Co Ltd
- 17.2.8.1. Overview
- 17.2.8.2. Products
- 17.2.8.3. SWOT Analysis
- 17.2.8.4. Recent Developments
- 17.2.8.5. Financials (Based on Availability)
- 17.2.9 Panasonic Corporation
- 17.2.9.1. Overview
- 17.2.9.2. Products
- 17.2.9.3. SWOT Analysis
- 17.2.9.4. Recent Developments
- 17.2.9.5. Financials (Based on Availability)
- 17.2.1 Samsung SDI Co Ltd
List of Figures
- Figure 1: Global Grid Scale Battery Industry Revenue Breakdown (Million, %) by Region 2024 & 2032
- Figure 2: Global Grid Scale Battery Industry Volume Breakdown (K Units, %) by Region 2024 & 2032
- Figure 3: North America Grid Scale Battery Industry Revenue (Million), by Country 2024 & 2032
- Figure 4: North America Grid Scale Battery Industry Volume (K Units), by Country 2024 & 2032
- Figure 5: North America Grid Scale Battery Industry Revenue Share (%), by Country 2024 & 2032
- Figure 6: North America Grid Scale Battery Industry Volume Share (%), by Country 2024 & 2032
- Figure 7: Europe Grid Scale Battery Industry Revenue (Million), by Country 2024 & 2032
- Figure 8: Europe Grid Scale Battery Industry Volume (K Units), by Country 2024 & 2032
- Figure 9: Europe Grid Scale Battery Industry Revenue Share (%), by Country 2024 & 2032
- Figure 10: Europe Grid Scale Battery Industry Volume Share (%), by Country 2024 & 2032
- Figure 11: Asia Pacific Grid Scale Battery Industry Revenue (Million), by Country 2024 & 2032
- Figure 12: Asia Pacific Grid Scale Battery Industry Volume (K Units), by Country 2024 & 2032
- Figure 13: Asia Pacific Grid Scale Battery Industry Revenue Share (%), by Country 2024 & 2032
- Figure 14: Asia Pacific Grid Scale Battery Industry Volume Share (%), by Country 2024 & 2032
- Figure 15: South America Grid Scale Battery Industry Revenue (Million), by Country 2024 & 2032
- Figure 16: South America Grid Scale Battery Industry Volume (K Units), by Country 2024 & 2032
- Figure 17: South America Grid Scale Battery Industry Revenue Share (%), by Country 2024 & 2032
- Figure 18: South America Grid Scale Battery Industry Volume Share (%), by Country 2024 & 2032
- Figure 19: North America Grid Scale Battery Industry Revenue (Million), by Country 2024 & 2032
- Figure 20: North America Grid Scale Battery Industry Volume (K Units), by Country 2024 & 2032
- Figure 21: North America Grid Scale Battery Industry Revenue Share (%), by Country 2024 & 2032
- Figure 22: North America Grid Scale Battery Industry Volume Share (%), by Country 2024 & 2032
- Figure 23: MEA Grid Scale Battery Industry Revenue (Million), by Country 2024 & 2032
- Figure 24: MEA Grid Scale Battery Industry Volume (K Units), by Country 2024 & 2032
- Figure 25: MEA Grid Scale Battery Industry Revenue Share (%), by Country 2024 & 2032
- Figure 26: MEA Grid Scale Battery Industry Volume Share (%), by Country 2024 & 2032
- Figure 27: North America Grid Scale Battery Industry Revenue (Million), by Battery Type 2024 & 2032
- Figure 28: North America Grid Scale Battery Industry Volume (K Units), by Battery Type 2024 & 2032
- Figure 29: North America Grid Scale Battery Industry Revenue Share (%), by Battery Type 2024 & 2032
- Figure 30: North America Grid Scale Battery Industry Volume Share (%), by Battery Type 2024 & 2032
- Figure 31: North America Grid Scale Battery Industry Revenue (Million), by Application 2024 & 2032
- Figure 32: North America Grid Scale Battery Industry Volume (K Units), by Application 2024 & 2032
- Figure 33: North America Grid Scale Battery Industry Revenue Share (%), by Application 2024 & 2032
- Figure 34: North America Grid Scale Battery Industry Volume Share (%), by Application 2024 & 2032
- Figure 35: North America Grid Scale Battery Industry Revenue (Million), by Country 2024 & 2032
- Figure 36: North America Grid Scale Battery Industry Volume (K Units), by Country 2024 & 2032
- Figure 37: North America Grid Scale Battery Industry Revenue Share (%), by Country 2024 & 2032
- Figure 38: North America Grid Scale Battery Industry Volume Share (%), by Country 2024 & 2032
- Figure 39: Europe Grid Scale Battery Industry Revenue (Million), by Battery Type 2024 & 2032
- Figure 40: Europe Grid Scale Battery Industry Volume (K Units), by Battery Type 2024 & 2032
- Figure 41: Europe Grid Scale Battery Industry Revenue Share (%), by Battery Type 2024 & 2032
- Figure 42: Europe Grid Scale Battery Industry Volume Share (%), by Battery Type 2024 & 2032
- Figure 43: Europe Grid Scale Battery Industry Revenue (Million), by Application 2024 & 2032
- Figure 44: Europe Grid Scale Battery Industry Volume (K Units), by Application 2024 & 2032
- Figure 45: Europe Grid Scale Battery Industry Revenue Share (%), by Application 2024 & 2032
- Figure 46: Europe Grid Scale Battery Industry Volume Share (%), by Application 2024 & 2032
- Figure 47: Europe Grid Scale Battery Industry Revenue (Million), by Country 2024 & 2032
- Figure 48: Europe Grid Scale Battery Industry Volume (K Units), by Country 2024 & 2032
- Figure 49: Europe Grid Scale Battery Industry Revenue Share (%), by Country 2024 & 2032
- Figure 50: Europe Grid Scale Battery Industry Volume Share (%), by Country 2024 & 2032
- Figure 51: Asia Pacific Grid Scale Battery Industry Revenue (Million), by Battery Type 2024 & 2032
- Figure 52: Asia Pacific Grid Scale Battery Industry Volume (K Units), by Battery Type 2024 & 2032
- Figure 53: Asia Pacific Grid Scale Battery Industry Revenue Share (%), by Battery Type 2024 & 2032
- Figure 54: Asia Pacific Grid Scale Battery Industry Volume Share (%), by Battery Type 2024 & 2032
- Figure 55: Asia Pacific Grid Scale Battery Industry Revenue (Million), by Application 2024 & 2032
- Figure 56: Asia Pacific Grid Scale Battery Industry Volume (K Units), by Application 2024 & 2032
- Figure 57: Asia Pacific Grid Scale Battery Industry Revenue Share (%), by Application 2024 & 2032
- Figure 58: Asia Pacific Grid Scale Battery Industry Volume Share (%), by Application 2024 & 2032
- Figure 59: Asia Pacific Grid Scale Battery Industry Revenue (Million), by Country 2024 & 2032
- Figure 60: Asia Pacific Grid Scale Battery Industry Volume (K Units), by Country 2024 & 2032
- Figure 61: Asia Pacific Grid Scale Battery Industry Revenue Share (%), by Country 2024 & 2032
- Figure 62: Asia Pacific Grid Scale Battery Industry Volume Share (%), by Country 2024 & 2032
- Figure 63: South America Grid Scale Battery Industry Revenue (Million), by Battery Type 2024 & 2032
- Figure 64: South America Grid Scale Battery Industry Volume (K Units), by Battery Type 2024 & 2032
- Figure 65: South America Grid Scale Battery Industry Revenue Share (%), by Battery Type 2024 & 2032
- Figure 66: South America Grid Scale Battery Industry Volume Share (%), by Battery Type 2024 & 2032
- Figure 67: South America Grid Scale Battery Industry Revenue (Million), by Application 2024 & 2032
- Figure 68: South America Grid Scale Battery Industry Volume (K Units), by Application 2024 & 2032
- Figure 69: South America Grid Scale Battery Industry Revenue Share (%), by Application 2024 & 2032
- Figure 70: South America Grid Scale Battery Industry Volume Share (%), by Application 2024 & 2032
- Figure 71: South America Grid Scale Battery Industry Revenue (Million), by Country 2024 & 2032
- Figure 72: South America Grid Scale Battery Industry Volume (K Units), by Country 2024 & 2032
- Figure 73: South America Grid Scale Battery Industry Revenue Share (%), by Country 2024 & 2032
- Figure 74: South America Grid Scale Battery Industry Volume Share (%), by Country 2024 & 2032
- Figure 75: Middle East and Africa Grid Scale Battery Industry Revenue (Million), by Battery Type 2024 & 2032
- Figure 76: Middle East and Africa Grid Scale Battery Industry Volume (K Units), by Battery Type 2024 & 2032
- Figure 77: Middle East and Africa Grid Scale Battery Industry Revenue Share (%), by Battery Type 2024 & 2032
- Figure 78: Middle East and Africa Grid Scale Battery Industry Volume Share (%), by Battery Type 2024 & 2032
- Figure 79: Middle East and Africa Grid Scale Battery Industry Revenue (Million), by Application 2024 & 2032
- Figure 80: Middle East and Africa Grid Scale Battery Industry Volume (K Units), by Application 2024 & 2032
- Figure 81: Middle East and Africa Grid Scale Battery Industry Revenue Share (%), by Application 2024 & 2032
- Figure 82: Middle East and Africa Grid Scale Battery Industry Volume Share (%), by Application 2024 & 2032
- Figure 83: Middle East and Africa Grid Scale Battery Industry Revenue (Million), by Country 2024 & 2032
- Figure 84: Middle East and Africa Grid Scale Battery Industry Volume (K Units), by Country 2024 & 2032
- Figure 85: Middle East and Africa Grid Scale Battery Industry Revenue Share (%), by Country 2024 & 2032
- Figure 86: Middle East and Africa Grid Scale Battery Industry Volume Share (%), by Country 2024 & 2032
List of Tables
- Table 1: Global Grid Scale Battery Industry Revenue Million Forecast, by Region 2019 & 2032
- Table 2: Global Grid Scale Battery Industry Volume K Units Forecast, by Region 2019 & 2032
- Table 3: Global Grid Scale Battery Industry Revenue Million Forecast, by Battery Type 2019 & 2032
- Table 4: Global Grid Scale Battery Industry Volume K Units Forecast, by Battery Type 2019 & 2032
- Table 5: Global Grid Scale Battery Industry Revenue Million Forecast, by Application 2019 & 2032
- Table 6: Global Grid Scale Battery Industry Volume K Units Forecast, by Application 2019 & 2032
- Table 7: Global Grid Scale Battery Industry Revenue Million Forecast, by Region 2019 & 2032
- Table 8: Global Grid Scale Battery Industry Volume K Units Forecast, by Region 2019 & 2032
- Table 9: Global Grid Scale Battery Industry Revenue Million Forecast, by Country 2019 & 2032
- Table 10: Global Grid Scale Battery Industry Volume K Units Forecast, by Country 2019 & 2032
- Table 11: United States Grid Scale Battery Industry Revenue (Million) Forecast, by Application 2019 & 2032
- Table 12: United States Grid Scale Battery Industry Volume (K Units) Forecast, by Application 2019 & 2032
- Table 13: Canada Grid Scale Battery Industry Revenue (Million) Forecast, by Application 2019 & 2032
- Table 14: Canada Grid Scale Battery Industry Volume (K Units) Forecast, by Application 2019 & 2032
- Table 15: Mexico Grid Scale Battery Industry Revenue (Million) Forecast, by Application 2019 & 2032
- Table 16: Mexico Grid Scale Battery Industry Volume (K Units) Forecast, by Application 2019 & 2032
- Table 17: Global Grid Scale Battery Industry Revenue Million Forecast, by Country 2019 & 2032
- Table 18: Global Grid Scale Battery Industry Volume K Units Forecast, by Country 2019 & 2032
- Table 19: Germany Grid Scale Battery Industry Revenue (Million) Forecast, by Application 2019 & 2032
- Table 20: Germany Grid Scale Battery Industry Volume (K Units) Forecast, by Application 2019 & 2032
- Table 21: United Kingdom Grid Scale Battery Industry Revenue (Million) Forecast, by Application 2019 & 2032
- Table 22: United Kingdom Grid Scale Battery Industry Volume (K Units) Forecast, by Application 2019 & 2032
- Table 23: France Grid Scale Battery Industry Revenue (Million) Forecast, by Application 2019 & 2032
- Table 24: France Grid Scale Battery Industry Volume (K Units) Forecast, by Application 2019 & 2032
- Table 25: Spain Grid Scale Battery Industry Revenue (Million) Forecast, by Application 2019 & 2032
- Table 26: Spain Grid Scale Battery Industry Volume (K Units) Forecast, by Application 2019 & 2032
- Table 27: Italy Grid Scale Battery Industry Revenue (Million) Forecast, by Application 2019 & 2032
- Table 28: Italy Grid Scale Battery Industry Volume (K Units) Forecast, by Application 2019 & 2032
- Table 29: Spain Grid Scale Battery Industry Revenue (Million) Forecast, by Application 2019 & 2032
- Table 30: Spain Grid Scale Battery Industry Volume (K Units) Forecast, by Application 2019 & 2032
- Table 31: Belgium Grid Scale Battery Industry Revenue (Million) Forecast, by Application 2019 & 2032
- Table 32: Belgium Grid Scale Battery Industry Volume (K Units) Forecast, by Application 2019 & 2032
- Table 33: Netherland Grid Scale Battery Industry Revenue (Million) Forecast, by Application 2019 & 2032
- Table 34: Netherland Grid Scale Battery Industry Volume (K Units) Forecast, by Application 2019 & 2032
- Table 35: Nordics Grid Scale Battery Industry Revenue (Million) Forecast, by Application 2019 & 2032
- Table 36: Nordics Grid Scale Battery Industry Volume (K Units) Forecast, by Application 2019 & 2032
- Table 37: Rest of Europe Grid Scale Battery Industry Revenue (Million) Forecast, by Application 2019 & 2032
- Table 38: Rest of Europe Grid Scale Battery Industry Volume (K Units) Forecast, by Application 2019 & 2032
- Table 39: Global Grid Scale Battery Industry Revenue Million Forecast, by Country 2019 & 2032
- Table 40: Global Grid Scale Battery Industry Volume K Units Forecast, by Country 2019 & 2032
- Table 41: China Grid Scale Battery Industry Revenue (Million) Forecast, by Application 2019 & 2032
- Table 42: China Grid Scale Battery Industry Volume (K Units) Forecast, by Application 2019 & 2032
- Table 43: Japan Grid Scale Battery Industry Revenue (Million) Forecast, by Application 2019 & 2032
- Table 44: Japan Grid Scale Battery Industry Volume (K Units) Forecast, by Application 2019 & 2032
- Table 45: India Grid Scale Battery Industry Revenue (Million) Forecast, by Application 2019 & 2032
- Table 46: India Grid Scale Battery Industry Volume (K Units) Forecast, by Application 2019 & 2032
- Table 47: South Korea Grid Scale Battery Industry Revenue (Million) Forecast, by Application 2019 & 2032
- Table 48: South Korea Grid Scale Battery Industry Volume (K Units) Forecast, by Application 2019 & 2032
- Table 49: Southeast Asia Grid Scale Battery Industry Revenue (Million) Forecast, by Application 2019 & 2032
- Table 50: Southeast Asia Grid Scale Battery Industry Volume (K Units) Forecast, by Application 2019 & 2032
- Table 51: Australia Grid Scale Battery Industry Revenue (Million) Forecast, by Application 2019 & 2032
- Table 52: Australia Grid Scale Battery Industry Volume (K Units) Forecast, by Application 2019 & 2032
- Table 53: Indonesia Grid Scale Battery Industry Revenue (Million) Forecast, by Application 2019 & 2032
- Table 54: Indonesia Grid Scale Battery Industry Volume (K Units) Forecast, by Application 2019 & 2032
- Table 55: Phillipes Grid Scale Battery Industry Revenue (Million) Forecast, by Application 2019 & 2032
- Table 56: Phillipes Grid Scale Battery Industry Volume (K Units) Forecast, by Application 2019 & 2032
- Table 57: Singapore Grid Scale Battery Industry Revenue (Million) Forecast, by Application 2019 & 2032
- Table 58: Singapore Grid Scale Battery Industry Volume (K Units) Forecast, by Application 2019 & 2032
- Table 59: Thailandc Grid Scale Battery Industry Revenue (Million) Forecast, by Application 2019 & 2032
- Table 60: Thailandc Grid Scale Battery Industry Volume (K Units) Forecast, by Application 2019 & 2032
- Table 61: Rest of Asia Pacific Grid Scale Battery Industry Revenue (Million) Forecast, by Application 2019 & 2032
- Table 62: Rest of Asia Pacific Grid Scale Battery Industry Volume (K Units) Forecast, by Application 2019 & 2032
- Table 63: Global Grid Scale Battery Industry Revenue Million Forecast, by Country 2019 & 2032
- Table 64: Global Grid Scale Battery Industry Volume K Units Forecast, by Country 2019 & 2032
- Table 65: Brazil Grid Scale Battery Industry Revenue (Million) Forecast, by Application 2019 & 2032
- Table 66: Brazil Grid Scale Battery Industry Volume (K Units) Forecast, by Application 2019 & 2032
- Table 67: Argentina Grid Scale Battery Industry Revenue (Million) Forecast, by Application 2019 & 2032
- Table 68: Argentina Grid Scale Battery Industry Volume (K Units) Forecast, by Application 2019 & 2032
- Table 69: Peru Grid Scale Battery Industry Revenue (Million) Forecast, by Application 2019 & 2032
- Table 70: Peru Grid Scale Battery Industry Volume (K Units) Forecast, by Application 2019 & 2032
- Table 71: Chile Grid Scale Battery Industry Revenue (Million) Forecast, by Application 2019 & 2032
- Table 72: Chile Grid Scale Battery Industry Volume (K Units) Forecast, by Application 2019 & 2032
- Table 73: Colombia Grid Scale Battery Industry Revenue (Million) Forecast, by Application 2019 & 2032
- Table 74: Colombia Grid Scale Battery Industry Volume (K Units) Forecast, by Application 2019 & 2032
- Table 75: Ecuador Grid Scale Battery Industry Revenue (Million) Forecast, by Application 2019 & 2032
- Table 76: Ecuador Grid Scale Battery Industry Volume (K Units) Forecast, by Application 2019 & 2032
- Table 77: Venezuela Grid Scale Battery Industry Revenue (Million) Forecast, by Application 2019 & 2032
- Table 78: Venezuela Grid Scale Battery Industry Volume (K Units) Forecast, by Application 2019 & 2032
- Table 79: Rest of South America Grid Scale Battery Industry Revenue (Million) Forecast, by Application 2019 & 2032
- Table 80: Rest of South America Grid Scale Battery Industry Volume (K Units) Forecast, by Application 2019 & 2032
- Table 81: Global Grid Scale Battery Industry Revenue Million Forecast, by Country 2019 & 2032
- Table 82: Global Grid Scale Battery Industry Volume K Units Forecast, by Country 2019 & 2032
- Table 83: United States Grid Scale Battery Industry Revenue (Million) Forecast, by Application 2019 & 2032
- Table 84: United States Grid Scale Battery Industry Volume (K Units) Forecast, by Application 2019 & 2032
- Table 85: Canada Grid Scale Battery Industry Revenue (Million) Forecast, by Application 2019 & 2032
- Table 86: Canada Grid Scale Battery Industry Volume (K Units) Forecast, by Application 2019 & 2032
- Table 87: Mexico Grid Scale Battery Industry Revenue (Million) Forecast, by Application 2019 & 2032
- Table 88: Mexico Grid Scale Battery Industry Volume (K Units) Forecast, by Application 2019 & 2032
- Table 89: Global Grid Scale Battery Industry Revenue Million Forecast, by Country 2019 & 2032
- Table 90: Global Grid Scale Battery Industry Volume K Units Forecast, by Country 2019 & 2032
- Table 91: United Arab Emirates Grid Scale Battery Industry Revenue (Million) Forecast, by Application 2019 & 2032
- Table 92: United Arab Emirates Grid Scale Battery Industry Volume (K Units) Forecast, by Application 2019 & 2032
- Table 93: Saudi Arabia Grid Scale Battery Industry Revenue (Million) Forecast, by Application 2019 & 2032
- Table 94: Saudi Arabia Grid Scale Battery Industry Volume (K Units) Forecast, by Application 2019 & 2032
- Table 95: South Africa Grid Scale Battery Industry Revenue (Million) Forecast, by Application 2019 & 2032
- Table 96: South Africa Grid Scale Battery Industry Volume (K Units) Forecast, by Application 2019 & 2032
- Table 97: Rest of Middle East and Africa Grid Scale Battery Industry Revenue (Million) Forecast, by Application 2019 & 2032
- Table 98: Rest of Middle East and Africa Grid Scale Battery Industry Volume (K Units) Forecast, by Application 2019 & 2032
- Table 99: Global Grid Scale Battery Industry Revenue Million Forecast, by Battery Type 2019 & 2032
- Table 100: Global Grid Scale Battery Industry Volume K Units Forecast, by Battery Type 2019 & 2032
- Table 101: Global Grid Scale Battery Industry Revenue Million Forecast, by Application 2019 & 2032
- Table 102: Global Grid Scale Battery Industry Volume K Units Forecast, by Application 2019 & 2032
- Table 103: Global Grid Scale Battery Industry Revenue Million Forecast, by Country 2019 & 2032
- Table 104: Global Grid Scale Battery Industry Volume K Units Forecast, by Country 2019 & 2032
- Table 105: Global Grid Scale Battery Industry Revenue Million Forecast, by Battery Type 2019 & 2032
- Table 106: Global Grid Scale Battery Industry Volume K Units Forecast, by Battery Type 2019 & 2032
- Table 107: Global Grid Scale Battery Industry Revenue Million Forecast, by Application 2019 & 2032
- Table 108: Global Grid Scale Battery Industry Volume K Units Forecast, by Application 2019 & 2032
- Table 109: Global Grid Scale Battery Industry Revenue Million Forecast, by Country 2019 & 2032
- Table 110: Global Grid Scale Battery Industry Volume K Units Forecast, by Country 2019 & 2032
- Table 111: Global Grid Scale Battery Industry Revenue Million Forecast, by Battery Type 2019 & 2032
- Table 112: Global Grid Scale Battery Industry Volume K Units Forecast, by Battery Type 2019 & 2032
- Table 113: Global Grid Scale Battery Industry Revenue Million Forecast, by Application 2019 & 2032
- Table 114: Global Grid Scale Battery Industry Volume K Units Forecast, by Application 2019 & 2032
- Table 115: Global Grid Scale Battery Industry Revenue Million Forecast, by Country 2019 & 2032
- Table 116: Global Grid Scale Battery Industry Volume K Units Forecast, by Country 2019 & 2032
- Table 117: Global Grid Scale Battery Industry Revenue Million Forecast, by Battery Type 2019 & 2032
- Table 118: Global Grid Scale Battery Industry Volume K Units Forecast, by Battery Type 2019 & 2032
- Table 119: Global Grid Scale Battery Industry Revenue Million Forecast, by Application 2019 & 2032
- Table 120: Global Grid Scale Battery Industry Volume K Units Forecast, by Application 2019 & 2032
- Table 121: Global Grid Scale Battery Industry Revenue Million Forecast, by Country 2019 & 2032
- Table 122: Global Grid Scale Battery Industry Volume K Units Forecast, by Country 2019 & 2032
- Table 123: Global Grid Scale Battery Industry Revenue Million Forecast, by Battery Type 2019 & 2032
- Table 124: Global Grid Scale Battery Industry Volume K Units Forecast, by Battery Type 2019 & 2032
- Table 125: Global Grid Scale Battery Industry Revenue Million Forecast, by Application 2019 & 2032
- Table 126: Global Grid Scale Battery Industry Volume K Units Forecast, by Application 2019 & 2032
- Table 127: Global Grid Scale Battery Industry Revenue Million Forecast, by Country 2019 & 2032
- Table 128: Global Grid Scale Battery Industry Volume K Units Forecast, by Country 2019 & 2032
Frequently Asked Questions
1. What is the projected Compound Annual Growth Rate (CAGR) of the Grid Scale Battery Industry?
The projected CAGR is approximately > 15.00%.
2. Which companies are prominent players in the Grid Scale Battery Industry?
Key companies in the market include Samsung SDI Co Ltd, LG Chem Ltd, East Penn Manufacturing Company, Tesla Inc, BYD Co Ltd, GS Yuasa Corporation, Clarios*List Not Exhaustive, Contemporary Amperex Technology Co Ltd, Panasonic Corporation.
3. What are the main segments of the Grid Scale Battery Industry?
The market segments include Battery Type, Application.
4. Can you provide details about the market size?
The market size is estimated to be USD XX Million as of 2022.
5. What are some drivers contributing to market growth?
4.; The High Amount of Waste Generation in the Country4.; The growing Focus on Non-Fossil Fuel Sources.
6. What are the notable trends driving market growth?
Increasing Demand for Lithium-ion Battery.
7. Are there any restraints impacting market growth?
4.; The Recycling Rate of Waste in Germany.
8. Can you provide examples of recent developments in the market?
N/A
9. What pricing options are available for accessing the report?
Pricing options include single-user, multi-user, and enterprise licenses priced at USD 4750, USD 5250, and USD 8750 respectively.
10. Is the market size provided in terms of value or volume?
The market size is provided in terms of value, measured in Million and volume, measured in K Units.
11. Are there any specific market keywords associated with the report?
Yes, the market keyword associated with the report is "Grid Scale Battery Industry," which aids in identifying and referencing the specific market segment covered.
12. How do I determine which pricing option suits my needs best?
The pricing options vary based on user requirements and access needs. Individual users may opt for single-user licenses, while businesses requiring broader access may choose multi-user or enterprise licenses for cost-effective access to the report.
13. Are there any additional resources or data provided in the Grid Scale Battery Industry report?
While the report offers comprehensive insights, it's advisable to review the specific contents or supplementary materials provided to ascertain if additional resources or data are available.
14. How can I stay updated on further developments or reports in the Grid Scale Battery Industry?
To stay informed about further developments, trends, and reports in the Grid Scale Battery Industry, consider subscribing to industry newsletters, following relevant companies and organizations, or regularly checking reputable industry news sources and publications.
Methodology
Step 1 - Identification of Relevant Samples Size from Population Database


Step 2 - Approaches for Defining Global Market Size (Value, Volume* & Price*)

Note*: In applicable scenarios
Step 3 - Data Sources
Primary Research
- Web Analytics
- Survey Reports
- Research Institute
- Latest Research Reports
- Opinion Leaders
Secondary Research
- Annual Reports
- White Paper
- Latest Press Release
- Industry Association
- Paid Database
- Investor Presentations

Step 4 - Data Triangulation
Involves using different sources of information in order to increase the validity of a study
These sources are likely to be stakeholders in a program - participants, other researchers, program staff, other community members, and so on.
Then we put all data in single framework & apply various statistical tools to find out the dynamic on the market.
During the analysis stage, feedback from the stakeholder groups would be compared to determine areas of agreement as well as areas of divergence
