

Key Insights
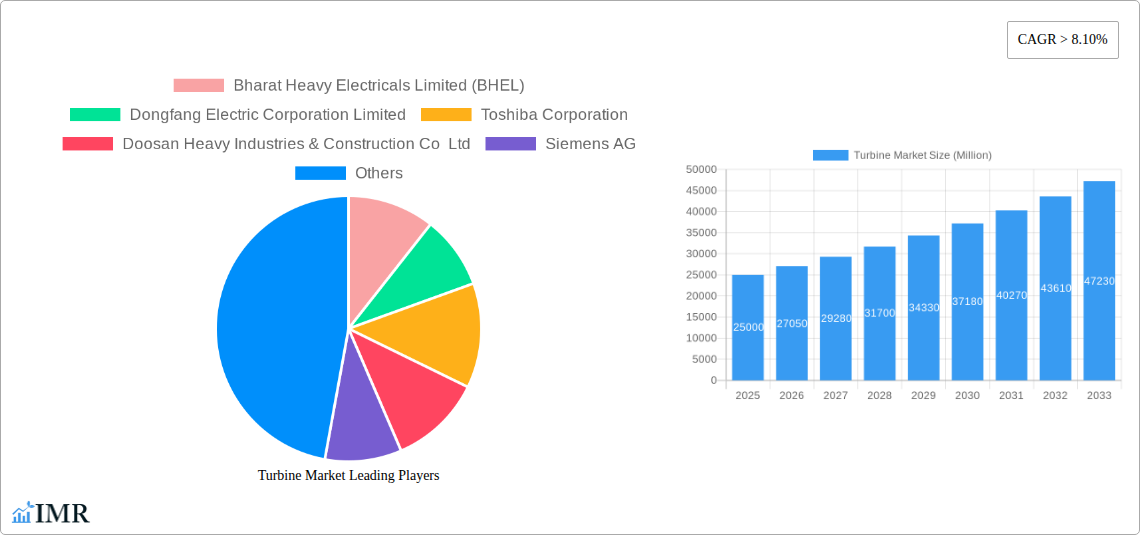
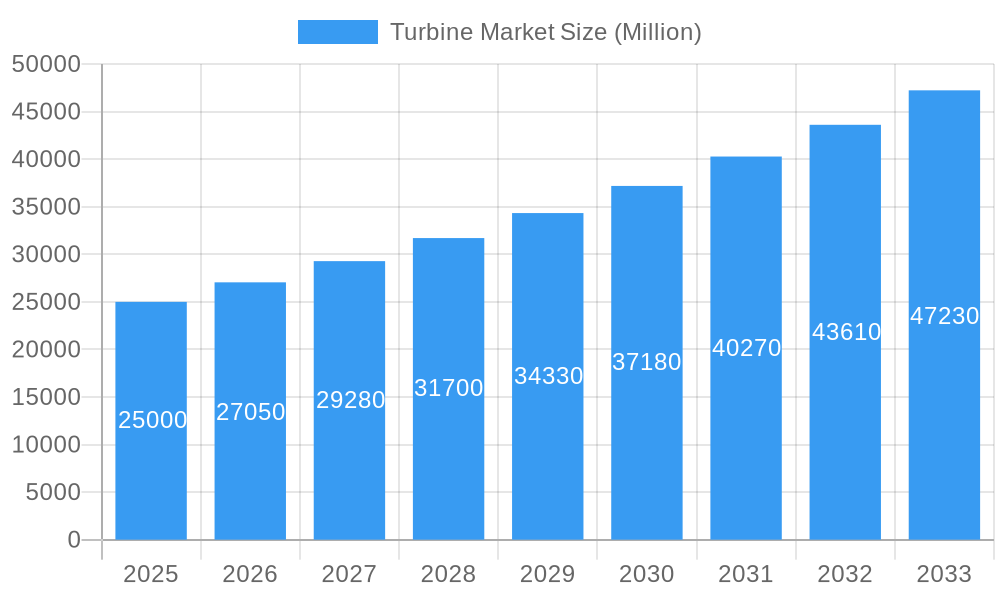
The global turbine market is experiencing robust growth, projected to maintain a Compound Annual Growth Rate (CAGR) exceeding 8.10% from 2025 to 2033. This expansion is driven by several key factors. Firstly, the increasing global demand for renewable energy sources, particularly wind and hydro power, fuels significant investments in wind turbines and hydro turbines. Government initiatives promoting clean energy transition and stringent emission reduction targets further bolster this trend. Secondly, advancements in turbine technology, leading to higher efficiency, improved reliability, and reduced operational costs, are making turbines a more attractive option for power generation. The shift towards offshore wind farms, offering higher wind speeds and larger capacity turbines, contributes significantly to market expansion. Finally, growing industrialization and urbanization in developing economies, particularly in Asia-Pacific, create a substantial demand for reliable and efficient power generation solutions, further driving market growth.
Turbine Market Market Size (In Billion)
However, the market faces certain restraints. The high initial investment cost associated with turbine installations, particularly for large-scale projects, can be a barrier to entry for smaller players. Furthermore, the dependence on raw material prices and fluctuating energy policies can create market uncertainties. Technological complexities and the need for skilled labor for installation and maintenance also pose challenges. Despite these challenges, the long-term outlook for the turbine market remains positive, driven by sustained government support for renewable energy and the increasing need for a reliable and sustainable energy infrastructure globally. The segmentation reveals a strong presence of wind turbines, which are expected to dominate the market, followed by significant growth in steam and gas turbines, largely driven by the power generation sector. Geographic distribution shows strong growth potential in the Asia-Pacific region, fueled by rapid industrialization and economic development.
Turbine Market Company Market Share
Turbine Market: A Comprehensive Analysis (2019-2033)
This in-depth report provides a comprehensive analysis of the global Turbine Market, encompassing its current dynamics, future growth trajectory, and key players. The study period covers 2019-2033, with a base year of 2025 and a forecast period of 2025-2033. The report segments the market by type (Wind Turbines, Steam Turbines, Gas Turbines, Hydro Turbines) and application (Offshore, Steam Cycle, Open Cycle), offering granular insights into various market segments and their growth prospects.
Turbine Market Dynamics & Structure
The global turbine market is characterized by moderate concentration, with several major players holding significant market share. Technological innovation, particularly in materials science and digitalization, is a key driver, while stringent environmental regulations are shaping market trends. The market witnesses continuous M&A activity, with larger players consolidating their positions through strategic acquisitions. Substitute technologies, such as solar and geothermal, present competitive pressure. End-user demographics, primarily driven by energy needs of various industries and nations, dictate market demand.
- Market Concentration: The top 5 players hold approximately xx% of the market share in 2025.
- Technological Innovation: Focus on increasing efficiency, reducing emissions, and enhancing durability.
- Regulatory Framework: Stringent emission standards and renewable energy mandates are boosting demand for certain turbine types.
- M&A Activity: An average of xx M&A deals per year were observed during the historical period (2019-2024).
- Innovation Barriers: High R&D costs and lengthy regulatory approval processes pose significant challenges.
- Competitive Substitutes: Solar and Geothermal energy sources are emerging as significant competitive substitutes.
Turbine Market Growth Trends & Insights
The global turbine market is projected to experience significant growth during the forecast period (2025-2033), driven by increasing global energy demand, the growing adoption of renewable energy sources, and ongoing technological advancements. The market size is estimated at XXX million units in 2025 and is expected to reach XXX million units by 2033, exhibiting a CAGR of xx%. This growth is primarily fueled by the increasing demand for electricity in developing economies, coupled with government initiatives promoting renewable energy. Technological disruptions, such as the development of more efficient and cost-effective turbines, are further accelerating market growth. Changes in consumer behavior, particularly towards environmentally friendly energy sources, are also contributing to the market's expansion.
Dominant Regions, Countries, or Segments in Turbine Market
The Asia-Pacific region is expected to dominate the turbine market throughout the forecast period, driven by rapid economic growth, substantial investments in infrastructure development, and supportive government policies. Within this region, China and India are projected to be the largest markets. The wind turbine segment is expected to experience the highest growth rate, followed by steam turbines and gas turbines. Hydro turbines are expected to demonstrate steady growth driven by the need for reliable hydroelectric power sources in certain regions.
- Key Drivers in Asia-Pacific: High energy demand, robust infrastructure investments, and government incentives for renewable energy.
- Market Share: The Asia-Pacific region holds an estimated xx% market share in 2025.
- Growth Potential: High growth potential attributed to the increasing adoption of renewable energy sources and industrialization.
Turbine Market Product Landscape
The turbine market offers a diverse range of products, including wind turbines with varying capacities and designs, steam turbines optimized for different applications, gas turbines incorporating advanced combustion technologies, and hydro turbines designed for specific river systems. Innovation focuses on enhancing efficiency, reducing noise pollution, and improving lifespan. Unique selling propositions often revolve around cost-effectiveness, environmental impact, and superior performance metrics such as power output and reliability. Technological advancements include the use of advanced materials, improved control systems, and data analytics for predictive maintenance.
Key Drivers, Barriers & Challenges in Turbine Market
Key Drivers: Increasing global energy demand, growing adoption of renewable energy, government support for clean energy technologies, and technological advancements leading to improved efficiency and cost reductions.
Challenges: High initial investment costs for turbine installations, dependence on volatile raw material prices, competition from substitute energy sources, and the complexity of grid integration for renewable energy sources. Supply chain disruptions, particularly in sourcing critical components, can cause significant delays and cost overruns.
Emerging Opportunities in Turbine Market
Emerging opportunities exist in offshore wind energy, particularly in deepwater installations, and in hybrid energy systems that integrate turbines with other renewable energy sources. Further opportunities lie in smart grid integration, predictive maintenance using IoT sensors, and the development of more sustainable turbine materials. Expanding into untapped markets in developing economies also presents substantial potential.
Growth Accelerators in the Turbine Market Industry
Long-term growth in the turbine market will be driven by technological breakthroughs in turbine design and materials, strategic partnerships between turbine manufacturers and energy companies, expansion into new geographical markets, particularly in emerging economies, and the increasing integration of smart grids to enhance the efficiency and reliability of renewable energy systems.
Key Players Shaping the Turbine Market Market
- Bharat Heavy Electricals Limited (BHEL)
- Dongfang Electric Corporation Limited
- Toshiba Corporation
- Doosan Heavy Industries & Construction Co Ltd
- Siemens AG
- Vestas Wind System A/S
- Mitsubishi Hitachi Power Systems Ltd (MHPS)
- General Electric Company
- Enercon GmbH
- Harbin Electric Company Limited
Notable Milestones in Turbine Market Sector
- 2022-Q3: Siemens AG launched a new series of high-efficiency wind turbines.
- 2021-Q4: Vestas Wind System A/S acquired a smaller turbine manufacturer, expanding its market reach.
- 2020-Q1: Government incentives for renewable energy projects increased significantly. (Specific country/region needed for accuracy)
In-Depth Turbine Market Market Outlook
The turbine market is poised for significant growth in the coming years, driven by favorable government policies, technological advancements, and the global push towards cleaner energy sources. Strategic opportunities exist for companies focused on innovation, cost-efficiency, and sustainable practices. The development of next-generation turbines with even greater efficiency and lower environmental impact will be crucial for sustaining long-term market growth.
Turbine Market Segmentation
-
1. Type
-
1.1. Wind Turbines
- 1.1.1. Onshore
- 1.1.2. Offshore
-
1.2. Steam Turbines
- 1.2.1. Combined Cycle
- 1.2.2. Steam Cycle
-
1.3. Gas Turbines
- 1.3.1. Open Cycle
-
1.4. Hydro Turbines
- 1.4.1. Reaction
- 1.4.2. Impulse
-
1.1. Wind Turbines
Turbine Market Segmentation By Geography
- 1. North America
- 2. Europe
- 3. Asia Pacific
- 4. South America
- 5. Middle East and Africa
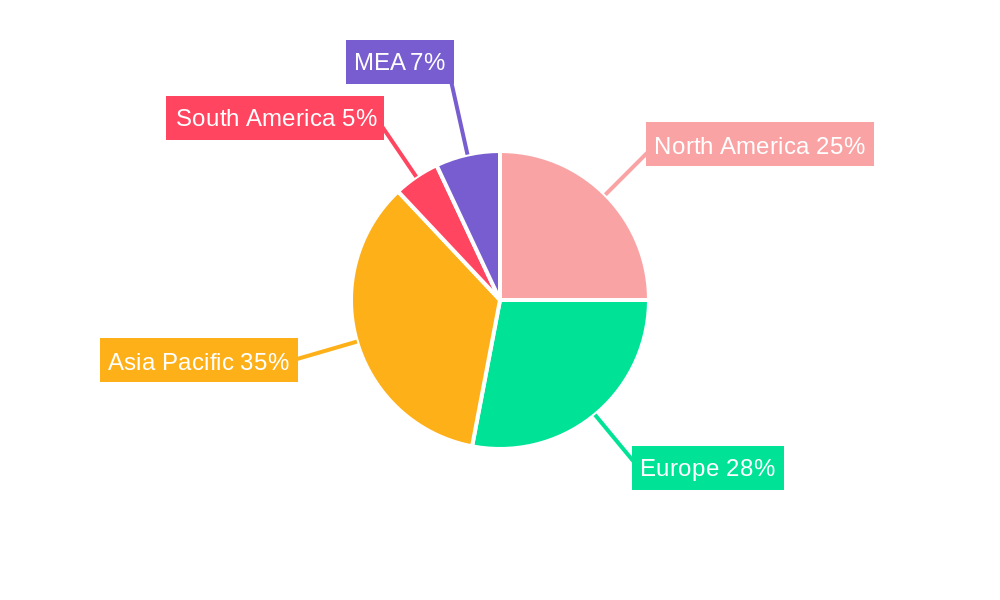
Turbine Market Regional Market Share
Geographic Coverage of Turbine Market
Turbine Market REPORT HIGHLIGHTS
| Aspects | Details |
|---|---|
| Study Period | 2020-2034 |
| Base Year | 2025 |
| Estimated Year | 2026 |
| Forecast Period | 2026-2034 |
| Historical Period | 2020-2025 |
| Growth Rate | CAGR of 6.7% from 2020-2034 |
| Segmentation |
|
Table of Contents
- 1. Introduction
- 1.1. Research Scope
- 1.2. Market Segmentation
- 1.3. Research Objective
- 1.4. Definitions and Assumptions
- 2. Executive Summary
- 2.1. Market Snapshot
- 3. Market Dynamics
- 3.1. Market Drivers
- 3.2. Market Restrains
- 3.3. Market Trends
- 3.4. Market Opportunities
- 4. Market Factor Analysis
- 4.1. Porters Five Forces
- 4.1.1. Bargaining Power of Suppliers
- 4.1.2. Bargaining Power of Buyers
- 4.1.3. Threat of New Entrants
- 4.1.4. Threat of Substitutes
- 4.1.5. Competitive Rivalry
- 4.2. PESTEL analysis
- 4.3. BCG Analysis
- 4.3.1. Stars (High Growth, High Market Share)
- 4.3.2. Cash Cows (Low Growth, High Market Share)
- 4.3.3. Question Mark (High Growth, Low Market Share)
- 4.3.4. Dogs (Low Growth, Low Market Share)
- 4.4. Ansoff Matrix Analysis
- 4.5. Supply Chain Analysis
- 4.6. Regulatory Landscape
- 4.7. Current Market Potential and Opportunity Assessment (TAM–SAM–SOM Framework)
- 4.8. IMR Analyst Note
- 4.1. Porters Five Forces
- 5. Market Analysis, Insights and Forecast 2021-2033
- 5.1. Market Analysis, Insights and Forecast - by Type
- 5.1.1. Wind Turbines
- 5.1.1.1. Onshore
- 5.1.1.2. Offshore
- 5.1.2. Steam Turbines
- 5.1.2.1. Combined Cycle
- 5.1.2.2. Steam Cycle
- 5.1.3. Gas Turbines
- 5.1.3.1. Open Cycle
- 5.1.4. Hydro Turbines
- 5.1.4.1. Reaction
- 5.1.4.2. Impulse
- 5.1.1. Wind Turbines
- 5.2. Market Analysis, Insights and Forecast - by Region
- 5.2.1. North America
- 5.2.2. Europe
- 5.2.3. Asia Pacific
- 5.2.4. South America
- 5.2.5. Middle East and Africa
- 5.1. Market Analysis, Insights and Forecast - by Type
- 6. Global Turbine Market Analysis, Insights and Forecast, 2021-2033
- 6.1. Market Analysis, Insights and Forecast - by Type
- 6.1.1. Wind Turbines
- 6.1.1.1. Onshore
- 6.1.1.2. Offshore
- 6.1.2. Steam Turbines
- 6.1.2.1. Combined Cycle
- 6.1.2.2. Steam Cycle
- 6.1.3. Gas Turbines
- 6.1.3.1. Open Cycle
- 6.1.4. Hydro Turbines
- 6.1.4.1. Reaction
- 6.1.4.2. Impulse
- 6.1.1. Wind Turbines
- 6.1. Market Analysis, Insights and Forecast - by Type
- 7. North America Turbine Market Analysis, Insights and Forecast, 2020-2032
- 7.1. Market Analysis, Insights and Forecast - by Type
- 7.1.1. Wind Turbines
- 7.1.1.1. Onshore
- 7.1.1.2. Offshore
- 7.1.2. Steam Turbines
- 7.1.2.1. Combined Cycle
- 7.1.2.2. Steam Cycle
- 7.1.3. Gas Turbines
- 7.1.3.1. Open Cycle
- 7.1.4. Hydro Turbines
- 7.1.4.1. Reaction
- 7.1.4.2. Impulse
- 7.1.1. Wind Turbines
- 7.1. Market Analysis, Insights and Forecast - by Type
- 8. Europe Turbine Market Analysis, Insights and Forecast, 2020-2032
- 8.1. Market Analysis, Insights and Forecast - by Type
- 8.1.1. Wind Turbines
- 8.1.1.1. Onshore
- 8.1.1.2. Offshore
- 8.1.2. Steam Turbines
- 8.1.2.1. Combined Cycle
- 8.1.2.2. Steam Cycle
- 8.1.3. Gas Turbines
- 8.1.3.1. Open Cycle
- 8.1.4. Hydro Turbines
- 8.1.4.1. Reaction
- 8.1.4.2. Impulse
- 8.1.1. Wind Turbines
- 8.1. Market Analysis, Insights and Forecast - by Type
- 9. Asia Pacific Turbine Market Analysis, Insights and Forecast, 2020-2032
- 9.1. Market Analysis, Insights and Forecast - by Type
- 9.1.1. Wind Turbines
- 9.1.1.1. Onshore
- 9.1.1.2. Offshore
- 9.1.2. Steam Turbines
- 9.1.2.1. Combined Cycle
- 9.1.2.2. Steam Cycle
- 9.1.3. Gas Turbines
- 9.1.3.1. Open Cycle
- 9.1.4. Hydro Turbines
- 9.1.4.1. Reaction
- 9.1.4.2. Impulse
- 9.1.1. Wind Turbines
- 9.1. Market Analysis, Insights and Forecast - by Type
- 10. South America Turbine Market Analysis, Insights and Forecast, 2020-2032
- 10.1. Market Analysis, Insights and Forecast - by Type
- 10.1.1. Wind Turbines
- 10.1.1.1. Onshore
- 10.1.1.2. Offshore
- 10.1.2. Steam Turbines
- 10.1.2.1. Combined Cycle
- 10.1.2.2. Steam Cycle
- 10.1.3. Gas Turbines
- 10.1.3.1. Open Cycle
- 10.1.4. Hydro Turbines
- 10.1.4.1. Reaction
- 10.1.4.2. Impulse
- 10.1.1. Wind Turbines
- 10.1. Market Analysis, Insights and Forecast - by Type
- 11. Middle East and Africa Turbine Market Analysis, Insights and Forecast, 2020-2032
- 11.1. Market Analysis, Insights and Forecast - by Type
- 11.1.1. Wind Turbines
- 11.1.1.1. Onshore
- 11.1.1.2. Offshore
- 11.1.2. Steam Turbines
- 11.1.2.1. Combined Cycle
- 11.1.2.2. Steam Cycle
- 11.1.3. Gas Turbines
- 11.1.3.1. Open Cycle
- 11.1.4. Hydro Turbines
- 11.1.4.1. Reaction
- 11.1.4.2. Impulse
- 11.1.1. Wind Turbines
- 11.1. Market Analysis, Insights and Forecast - by Type
- 12. Competitive Analysis
- 12.1. Company Profiles
- 12.1.1 Bharat Heavy Electricals Limited (BHEL)
- 12.1.1.1. Company Overview
- 12.1.1.2. Products
- 12.1.1.3. Company Financials
- 12.1.1.4. SWOT Analysis
- 12.1.2 Dongfang Electric Corporation Limited
- 12.1.2.1. Company Overview
- 12.1.2.2. Products
- 12.1.2.3. Company Financials
- 12.1.2.4. SWOT Analysis
- 12.1.3 Toshiba Corporation
- 12.1.3.1. Company Overview
- 12.1.3.2. Products
- 12.1.3.3. Company Financials
- 12.1.3.4. SWOT Analysis
- 12.1.4 Doosan Heavy Industries & Construction Co Ltd
- 12.1.4.1. Company Overview
- 12.1.4.2. Products
- 12.1.4.3. Company Financials
- 12.1.4.4. SWOT Analysis
- 12.1.5 Siemens AG
- 12.1.5.1. Company Overview
- 12.1.5.2. Products
- 12.1.5.3. Company Financials
- 12.1.5.4. SWOT Analysis
- 12.1.6 Vestas Wind System A/S*List Not Exhaustive
- 12.1.6.1. Company Overview
- 12.1.6.2. Products
- 12.1.6.3. Company Financials
- 12.1.6.4. SWOT Analysis
- 12.1.7 Mitsubishi Hitachi Power Systems Ltd (MHPS)
- 12.1.7.1. Company Overview
- 12.1.7.2. Products
- 12.1.7.3. Company Financials
- 12.1.7.4. SWOT Analysis
- 12.1.8 General Electric Company
- 12.1.8.1. Company Overview
- 12.1.8.2. Products
- 12.1.8.3. Company Financials
- 12.1.8.4. SWOT Analysis
- 12.1.9 Enercon GmbH
- 12.1.9.1. Company Overview
- 12.1.9.2. Products
- 12.1.9.3. Company Financials
- 12.1.9.4. SWOT Analysis
- 12.1.10 Harbin Electric Company Limited
- 12.1.10.1. Company Overview
- 12.1.10.2. Products
- 12.1.10.3. Company Financials
- 12.1.10.4. SWOT Analysis
- 12.1.1 Bharat Heavy Electricals Limited (BHEL)
- 12.2. Market Entropy
- 12.2.1 Company's Key Areas Served
- 12.2.2 Recent Developments
- 12.3. Company Market Share Analysis 2025
- 12.3.1 Top 5 Companies Market Share Analysis
- 12.3.2 Top 3 Companies Market Share Analysis
- 12.4. List of Potential Customers
- 13. Research Methodology
List of Figures
- Figure 1: Global Turbine Market Revenue Breakdown (billion, %) by Region 2025 & 2033
- Figure 2: Global Turbine Market Volume Breakdown (Megawatt, %) by Region 2025 & 2033
- Figure 3: North America Turbine Market Revenue (billion), by Type 2025 & 2033
- Figure 4: North America Turbine Market Volume (Megawatt), by Type 2025 & 2033
- Figure 5: North America Turbine Market Revenue Share (%), by Type 2025 & 2033
- Figure 6: North America Turbine Market Volume Share (%), by Type 2025 & 2033
- Figure 7: North America Turbine Market Revenue (billion), by Country 2025 & 2033
- Figure 8: North America Turbine Market Volume (Megawatt), by Country 2025 & 2033
- Figure 9: North America Turbine Market Revenue Share (%), by Country 2025 & 2033
- Figure 10: North America Turbine Market Volume Share (%), by Country 2025 & 2033
- Figure 11: Europe Turbine Market Revenue (billion), by Type 2025 & 2033
- Figure 12: Europe Turbine Market Volume (Megawatt), by Type 2025 & 2033
- Figure 13: Europe Turbine Market Revenue Share (%), by Type 2025 & 2033
- Figure 14: Europe Turbine Market Volume Share (%), by Type 2025 & 2033
- Figure 15: Europe Turbine Market Revenue (billion), by Country 2025 & 2033
- Figure 16: Europe Turbine Market Volume (Megawatt), by Country 2025 & 2033
- Figure 17: Europe Turbine Market Revenue Share (%), by Country 2025 & 2033
- Figure 18: Europe Turbine Market Volume Share (%), by Country 2025 & 2033
- Figure 19: Asia Pacific Turbine Market Revenue (billion), by Type 2025 & 2033
- Figure 20: Asia Pacific Turbine Market Volume (Megawatt), by Type 2025 & 2033
- Figure 21: Asia Pacific Turbine Market Revenue Share (%), by Type 2025 & 2033
- Figure 22: Asia Pacific Turbine Market Volume Share (%), by Type 2025 & 2033
- Figure 23: Asia Pacific Turbine Market Revenue (billion), by Country 2025 & 2033
- Figure 24: Asia Pacific Turbine Market Volume (Megawatt), by Country 2025 & 2033
- Figure 25: Asia Pacific Turbine Market Revenue Share (%), by Country 2025 & 2033
- Figure 26: Asia Pacific Turbine Market Volume Share (%), by Country 2025 & 2033
- Figure 27: South America Turbine Market Revenue (billion), by Type 2025 & 2033
- Figure 28: South America Turbine Market Volume (Megawatt), by Type 2025 & 2033
- Figure 29: South America Turbine Market Revenue Share (%), by Type 2025 & 2033
- Figure 30: South America Turbine Market Volume Share (%), by Type 2025 & 2033
- Figure 31: South America Turbine Market Revenue (billion), by Country 2025 & 2033
- Figure 32: South America Turbine Market Volume (Megawatt), by Country 2025 & 2033
- Figure 33: South America Turbine Market Revenue Share (%), by Country 2025 & 2033
- Figure 34: South America Turbine Market Volume Share (%), by Country 2025 & 2033
- Figure 35: Middle East and Africa Turbine Market Revenue (billion), by Type 2025 & 2033
- Figure 36: Middle East and Africa Turbine Market Volume (Megawatt), by Type 2025 & 2033
- Figure 37: Middle East and Africa Turbine Market Revenue Share (%), by Type 2025 & 2033
- Figure 38: Middle East and Africa Turbine Market Volume Share (%), by Type 2025 & 2033
- Figure 39: Middle East and Africa Turbine Market Revenue (billion), by Country 2025 & 2033
- Figure 40: Middle East and Africa Turbine Market Volume (Megawatt), by Country 2025 & 2033
- Figure 41: Middle East and Africa Turbine Market Revenue Share (%), by Country 2025 & 2033
- Figure 42: Middle East and Africa Turbine Market Volume Share (%), by Country 2025 & 2033
List of Tables
- Table 1: Global Turbine Market Revenue billion Forecast, by Type 2020 & 2033
- Table 2: Global Turbine Market Volume Megawatt Forecast, by Type 2020 & 2033
- Table 3: Global Turbine Market Revenue billion Forecast, by Region 2020 & 2033
- Table 4: Global Turbine Market Volume Megawatt Forecast, by Region 2020 & 2033
- Table 5: Global Turbine Market Revenue billion Forecast, by Type 2020 & 2033
- Table 6: Global Turbine Market Volume Megawatt Forecast, by Type 2020 & 2033
- Table 7: Global Turbine Market Revenue billion Forecast, by Country 2020 & 2033
- Table 8: Global Turbine Market Volume Megawatt Forecast, by Country 2020 & 2033
- Table 9: Global Turbine Market Revenue billion Forecast, by Type 2020 & 2033
- Table 10: Global Turbine Market Volume Megawatt Forecast, by Type 2020 & 2033
- Table 11: Global Turbine Market Revenue billion Forecast, by Country 2020 & 2033
- Table 12: Global Turbine Market Volume Megawatt Forecast, by Country 2020 & 2033
- Table 13: Global Turbine Market Revenue billion Forecast, by Type 2020 & 2033
- Table 14: Global Turbine Market Volume Megawatt Forecast, by Type 2020 & 2033
- Table 15: Global Turbine Market Revenue billion Forecast, by Country 2020 & 2033
- Table 16: Global Turbine Market Volume Megawatt Forecast, by Country 2020 & 2033
- Table 17: Global Turbine Market Revenue billion Forecast, by Type 2020 & 2033
- Table 18: Global Turbine Market Volume Megawatt Forecast, by Type 2020 & 2033
- Table 19: Global Turbine Market Revenue billion Forecast, by Country 2020 & 2033
- Table 20: Global Turbine Market Volume Megawatt Forecast, by Country 2020 & 2033
- Table 21: Global Turbine Market Revenue billion Forecast, by Type 2020 & 2033
- Table 22: Global Turbine Market Volume Megawatt Forecast, by Type 2020 & 2033
- Table 23: Global Turbine Market Revenue billion Forecast, by Country 2020 & 2033
- Table 24: Global Turbine Market Volume Megawatt Forecast, by Country 2020 & 2033
Frequently Asked Questions
1. What is the projected Compound Annual Growth Rate (CAGR) of the Turbine Market?
The projected CAGR is approximately 6.7%.
2. Which companies are prominent players in the Turbine Market?
Key companies in the market include Bharat Heavy Electricals Limited (BHEL), Dongfang Electric Corporation Limited, Toshiba Corporation, Doosan Heavy Industries & Construction Co Ltd, Siemens AG, Vestas Wind System A/S*List Not Exhaustive, Mitsubishi Hitachi Power Systems Ltd (MHPS), General Electric Company, Enercon GmbH, Harbin Electric Company Limited.
3. What are the main segments of the Turbine Market?
The market segments include Type.
4. Can you provide details about the market size?
The market size is estimated to be USD 185 billion as of 2022.
5. What are some drivers contributing to market growth?
Declining Costs of Solar Technologies4.; Demand for Decentralized Solar Energy Systems.
6. What are the notable trends driving market growth?
Wind Turbine Segment to Grow at the Fastest Rate.
7. Are there any restraints impacting market growth?
Absence of Any New Initiatives in the Country.
8. Can you provide examples of recent developments in the market?
N/A
9. What pricing options are available for accessing the report?
Pricing options include single-user, multi-user, and enterprise licenses priced at USD 4750, USD 5250, and USD 8750 respectively.
10. Is the market size provided in terms of value or volume?
The market size is provided in terms of value, measured in billion and volume, measured in Megawatt.
11. Are there any specific market keywords associated with the report?
Yes, the market keyword associated with the report is "Turbine Market," which aids in identifying and referencing the specific market segment covered.
12. How do I determine which pricing option suits my needs best?
The pricing options vary based on user requirements and access needs. Individual users may opt for single-user licenses, while businesses requiring broader access may choose multi-user or enterprise licenses for cost-effective access to the report.
13. Are there any additional resources or data provided in the Turbine Market report?
While the report offers comprehensive insights, it's advisable to review the specific contents or supplementary materials provided to ascertain if additional resources or data are available.
14. How can I stay updated on further developments or reports in the Turbine Market?
To stay informed about further developments, trends, and reports in the Turbine Market, consider subscribing to industry newsletters, following relevant companies and organizations, or regularly checking reputable industry news sources and publications.
Methodology
Step 1 - Identification of Relevant Samples Size from Population Database


Step 2 - Approaches for Defining Global Market Size (Value, Volume* & Price*)

Note*: In applicable scenarios
Step 3 - Data Sources
Primary Research
- Web Analytics
- Survey Reports
- Research Institute
- Latest Research Reports
- Opinion Leaders
Secondary Research
- Annual Reports
- White Paper
- Latest Press Release
- Industry Association
- Paid Database
- Investor Presentations

Step 4 - Data Triangulation
Involves using different sources of information in order to increase the validity of a study
These sources are likely to be stakeholders in a program - participants, other researchers, program staff, other community members, and so on.
Then we put all data in single framework & apply various statistical tools to find out the dynamic on the market.
During the analysis stage, feedback from the stakeholder groups would be compared to determine areas of agreement as well as areas of divergence