

Key Insights
The global nematicides market, valued at approximately 289.36 million in 2025, is projected to experience robust growth at a Compound Annual Growth Rate (CAGR) of 4.2% from 2025 to 2033. This expansion is driven by increasing nematode infestations in key agricultural regions and the growing adoption of sustainable practices like Integrated Pest Management (IPM). Rising global food demand necessitates higher crop yields, promoting nematicide application. Significant growth is observed in intensive agricultural areas with prevalent nematode-susceptible crops such as fruits, vegetables, and grains. Challenges include stringent regulations and environmental concerns, mitigated by the development of bio-nematicides and eco-friendly alternatives. The market is segmented by application mode (chemigation, foliar, fumigation, seed treatment, soil treatment) and crop type (commercial crops, fruits & vegetables, grains & cereals, pulses & oilseeds, turf & ornamental).
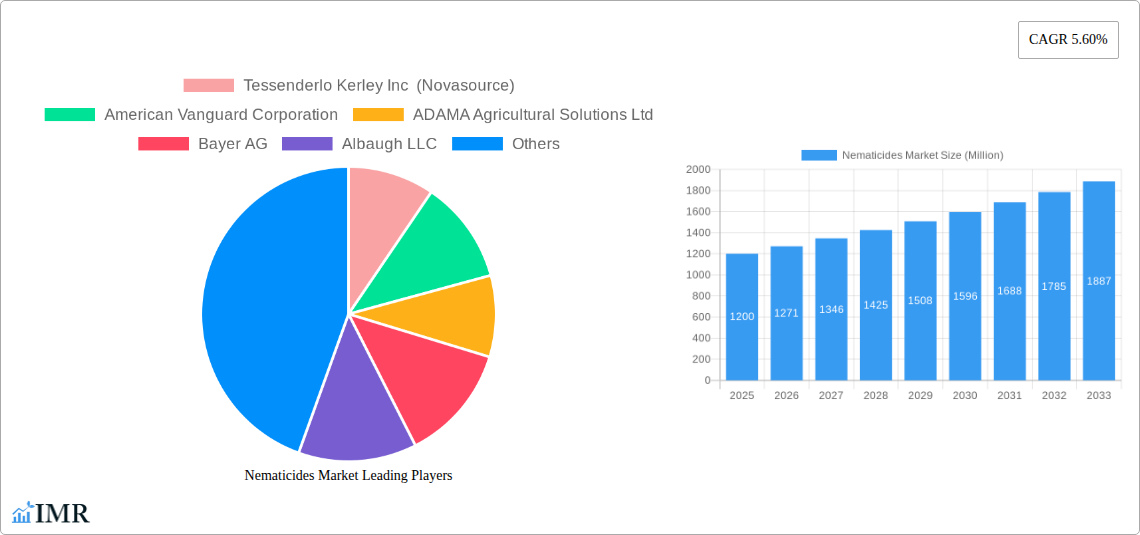
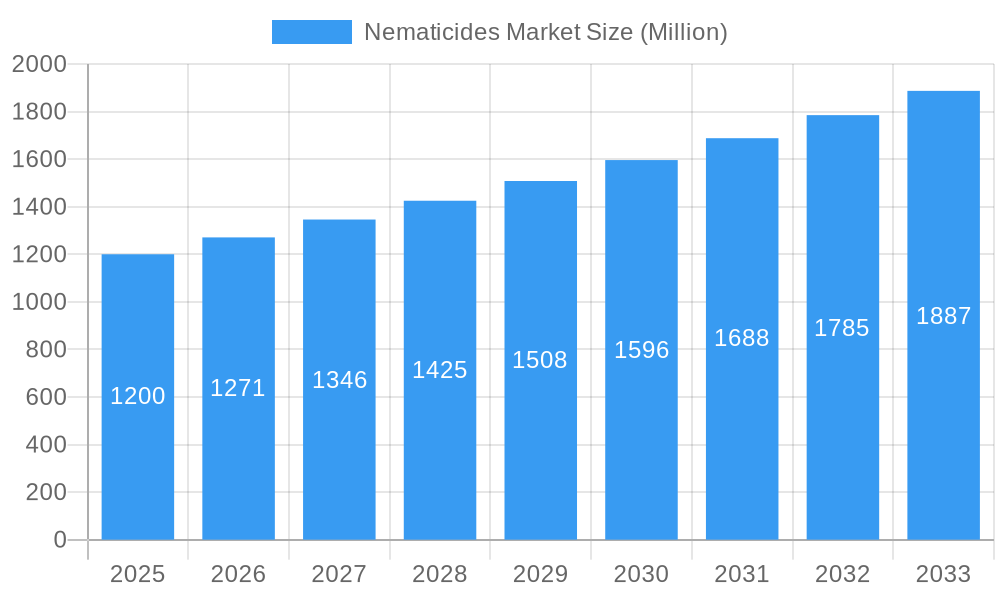
Nematicides Market Market Size (In Million)
Key industry players, including Tessenderlo Kerley Inc (Novasource), American Vanguard Corporation, ADAMA Agricultural Solutions Ltd, Bayer AG, Albaugh LLC, Syngenta Group, UPL Limited, Corteva Agriscience, and Vive Crop Protection, are actively engaged in R&D to introduce innovative and sustainable nematicide solutions. Intense competition focuses on product differentiation, cost-effectiveness, and market reach. The market's future depends on developing effective, environmentally responsible nematicides and supportive regulatory frameworks. The forecast period of 2025-2033 anticipates substantial growth due to increasing demand for food security and effective nematode control.
Nematicides Market Company Market Share
Nematicides Market Analysis: 2019-2033
This comprehensive analysis covers nematicides market dynamics, growth trends, regional insights, product offerings, challenges, opportunities, and key players. The study period is 2019-2033, with 2025 as the base year and a forecast period of 2025-2033. Market size is reported in million units.
Nematicides Market Dynamics & Structure
The nematicides market is characterized by moderate concentration, with several key players dominating the landscape. Technological innovation, particularly in the development of eco-friendly nematicides, is a major driver. Stringent regulatory frameworks concerning pesticide use significantly impact market growth and necessitate continuous innovation to meet environmental standards. The market faces competition from alternative pest control methods, such as biological control agents. End-user demographics, primarily driven by agricultural practices and consumer demand for higher-quality produce, significantly shape market trends. Mergers and acquisitions (M&A) activity has been moderately active in recent years, with key players expanding their portfolios through strategic acquisitions.
- Market Concentration: Moderately concentrated, with top 5 players holding xx% market share (2024).
- Technological Innovation: Focus on bio-pesticides and reduced-risk nematicides to address environmental concerns.
- Regulatory Frameworks: Stringent regulations drive innovation towards eco-friendly solutions and impact product approvals.
- Competitive Substitutes: Biological control agents and integrated pest management (IPM) strategies offer alternative solutions.
- M&A Activity: Moderate activity, with xx deals recorded between 2019 and 2024, primarily focused on expanding product portfolios and geographical reach.
Nematicides Market Growth Trends & Insights
The nematicides market experienced a compound annual growth rate (CAGR) of xx% during the historical period (2019-2024), reaching a market size of xx million units in 2024. This growth is projected to continue at a CAGR of xx% during the forecast period (2025-2033), driven by factors such as increasing crop production, rising demand for high-quality produce, and the adoption of advanced agricultural practices. Technological disruptions, such as the introduction of novel nematicide formulations and application methods, are further accelerating market expansion. Consumer behavior shifts towards environmentally friendly agricultural practices are also impacting the demand for eco-friendly nematicides. Market penetration is expected to reach xx% by 2033.
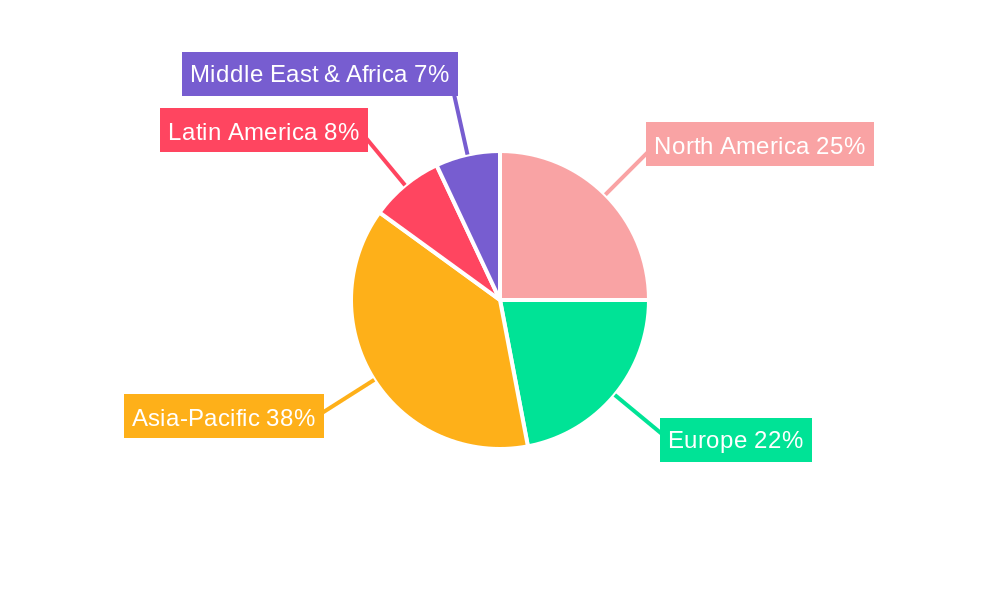
Dominant Regions, Countries, or Segments in Nematicides Market
The North American region dominated the nematicides market in 2024, accounting for xx% of the global market share, followed by Europe and Asia-Pacific. Within application modes, Soil Treatment holds the largest market share (xx%), owing to its effectiveness and widespread adoption. In terms of crop types, Fruits & Vegetables represents a significant market segment (xx%), driven by the high value and susceptibility of these crops to nematode infestations.
- Key Drivers (North America): Intensive agriculture, high adoption of advanced farming techniques, and strong regulatory support for crop protection.
- Key Drivers (Soil Treatment): Effectiveness in controlling nematodes in various soil types, ease of application, and compatibility with other soil amendments.
- Key Drivers (Fruits & Vegetables): High value crops and susceptibility to nematodes, leading to high demand for effective nematicide solutions.
Nematicides Market Product Landscape
The nematicides market offers a diverse range of products, including chemical nematicides, bio-pesticides, and integrated pest management (IPM) strategies. Recent innovations focus on developing more effective and environmentally friendly nematicide formulations with improved efficacy and reduced environmental impact. These innovations often leverage advancements in nanotechnology, biostimulants and biological control agents. Key selling propositions revolve around enhanced efficacy, targeted application, and reduced environmental risks.
Key Drivers, Barriers & Challenges in Nematicides Market
Key Drivers: Increasing crop production, rising demand for high-quality produce, adoption of advanced agricultural techniques, stringent regulations promoting eco-friendly alternatives.
Key Challenges: Stringent regulations and environmental concerns hinder the adoption of certain chemical nematicides; fluctuating raw material prices impacting manufacturing costs; competition from alternative pest control methods; potential for nematode resistance development.
Emerging Opportunities in Nematicides Market
Emerging opportunities lie in the development of bio-based nematicides and bio-pesticides, tailored solutions for specific nematode species and crop types, and integration of precision agriculture technologies for targeted application. Untapped markets in developing countries with high agricultural potential present significant growth prospects.
Growth Accelerators in the Nematicides Market Industry
Technological advancements, such as the development of novel nematicide formulations and application methods, strategic partnerships between chemical and biological control companies, and market expansion into emerging economies, are key catalysts for long-term growth. Increased investments in research and development for eco-friendly nematicides are also accelerating market growth.
Key Players Shaping the Nematicides Market Market
- Tessenderlo Kerley Inc (Novasource)
- American Vanguard Corporation
- ADAMA Agricultural Solutions Ltd
- Bayer AG
- Albaugh LLC
- Syngenta Group
- Upl Limited
- Corteva Agriscience
- Vive Crop Protection
Notable Milestones in Nematicides Market Sector
- May 2022: Corteva Agriscience expands its seed treatment portfolio in Brazil.
- June 2022: ADAMA Ltd. acquires AgriNova New Zealand Ltd., expanding its product line.
- January 2023: Bayer partners with Oerth Bio to develop eco-friendly crop protection solutions.
In-Depth Nematicides Market Market Outlook
The nematicides market is poised for significant growth, driven by the increasing demand for food security and sustainable agricultural practices. Strategic partnerships, technological innovations, and expansion into emerging markets will play crucial roles in shaping the future landscape. The focus on environmentally friendly nematicides will continue to drive product development and market expansion in the coming years.
Nematicides Market Segmentation
-
1. Application Mode
- 1.1. Chemigation
- 1.2. Foliar
- 1.3. Fumigation
- 1.4. Seed Treatment
- 1.5. Soil Treatment
-
2. Crop Type
- 2.1. Commercial Crops
- 2.2. Fruits & Vegetables
- 2.3. Grains & Cereals
- 2.4. Pulses & Oilseeds
- 2.5. Turf & Ornamental
-
3. Application Mode
- 3.1. Chemigation
- 3.2. Foliar
- 3.3. Fumigation
- 3.4. Seed Treatment
- 3.5. Soil Treatment
-
4. Crop Type
- 4.1. Commercial Crops
- 4.2. Fruits & Vegetables
- 4.3. Grains & Cereals
- 4.4. Pulses & Oilseeds
- 4.5. Turf & Ornamental
Nematicides Market Segmentation By Geography
-
1. North America
- 1.1. United States
- 1.2. Canada
- 1.3. Mexico
-
2. South America
- 2.1. Brazil
- 2.2. Argentina
- 2.3. Rest of South America
-
3. Europe
- 3.1. United Kingdom
- 3.2. Germany
- 3.3. France
- 3.4. Italy
- 3.5. Spain
- 3.6. Russia
- 3.7. Benelux
- 3.8. Nordics
- 3.9. Rest of Europe
-
4. Middle East & Africa
- 4.1. Turkey
- 4.2. Israel
- 4.3. GCC
- 4.4. North Africa
- 4.5. South Africa
- 4.6. Rest of Middle East & Africa
-
5. Asia Pacific
- 5.1. China
- 5.2. India
- 5.3. Japan
- 5.4. South Korea
- 5.5. ASEAN
- 5.6. Oceania
- 5.7. Rest of Asia Pacific
Nematicides Market Regional Market Share
Geographic Coverage of Nematicides Market
Nematicides Market REPORT HIGHLIGHTS
| Aspects | Details |
|---|---|
| Study Period | 2020-2034 |
| Base Year | 2025 |
| Estimated Year | 2026 |
| Forecast Period | 2026-2034 |
| Historical Period | 2020-2025 |
| Growth Rate | CAGR of 4.2% from 2020-2034 |
| Segmentation |
|
Table of Contents
- 1. Introduction
- 1.1. Research Scope
- 1.2. Market Segmentation
- 1.3. Research Objective
- 1.4. Definitions and Assumptions
- 2. Executive Summary
- 2.1. Market Snapshot
- 3. Market Dynamics
- 3.1. Market Drivers
- 3.2. Market Restrains
- 3.3. Market Trends
- 3.4. Market Opportunities
- 4. Market Factor Analysis
- 4.1. Porters Five Forces
- 4.1.1. Bargaining Power of Suppliers
- 4.1.2. Bargaining Power of Buyers
- 4.1.3. Threat of New Entrants
- 4.1.4. Threat of Substitutes
- 4.1.5. Competitive Rivalry
- 4.2. PESTEL analysis
- 4.3. BCG Analysis
- 4.3.1. Stars (High Growth, High Market Share)
- 4.3.2. Cash Cows (Low Growth, High Market Share)
- 4.3.3. Question Mark (High Growth, Low Market Share)
- 4.3.4. Dogs (Low Growth, Low Market Share)
- 4.4. Ansoff Matrix Analysis
- 4.5. Supply Chain Analysis
- 4.6. Regulatory Landscape
- 4.7. Current Market Potential and Opportunity Assessment (TAM–SAM–SOM Framework)
- 4.8. IMR Analyst Note
- 4.1. Porters Five Forces
- 5. Market Analysis, Insights and Forecast 2021-2033
- 5.1. Market Analysis, Insights and Forecast - by Application Mode
- 5.1.1. Chemigation
- 5.1.2. Foliar
- 5.1.3. Fumigation
- 5.1.4. Seed Treatment
- 5.1.5. Soil Treatment
- 5.2. Market Analysis, Insights and Forecast - by Crop Type
- 5.2.1. Commercial Crops
- 5.2.2. Fruits & Vegetables
- 5.2.3. Grains & Cereals
- 5.2.4. Pulses & Oilseeds
- 5.2.5. Turf & Ornamental
- 5.3. Market Analysis, Insights and Forecast - by Application Mode
- 5.3.1. Chemigation
- 5.3.2. Foliar
- 5.3.3. Fumigation
- 5.3.4. Seed Treatment
- 5.3.5. Soil Treatment
- 5.4. Market Analysis, Insights and Forecast - by Crop Type
- 5.4.1. Commercial Crops
- 5.4.2. Fruits & Vegetables
- 5.4.3. Grains & Cereals
- 5.4.4. Pulses & Oilseeds
- 5.4.5. Turf & Ornamental
- 5.5. Market Analysis, Insights and Forecast - by Region
- 5.5.1. North America
- 5.5.2. South America
- 5.5.3. Europe
- 5.5.4. Middle East & Africa
- 5.5.5. Asia Pacific
- 5.1. Market Analysis, Insights and Forecast - by Application Mode
- 6. Global Nematicides Market Analysis, Insights and Forecast, 2021-2033
- 6.1. Market Analysis, Insights and Forecast - by Application Mode
- 6.1.1. Chemigation
- 6.1.2. Foliar
- 6.1.3. Fumigation
- 6.1.4. Seed Treatment
- 6.1.5. Soil Treatment
- 6.2. Market Analysis, Insights and Forecast - by Crop Type
- 6.2.1. Commercial Crops
- 6.2.2. Fruits & Vegetables
- 6.2.3. Grains & Cereals
- 6.2.4. Pulses & Oilseeds
- 6.2.5. Turf & Ornamental
- 6.3. Market Analysis, Insights and Forecast - by Application Mode
- 6.3.1. Chemigation
- 6.3.2. Foliar
- 6.3.3. Fumigation
- 6.3.4. Seed Treatment
- 6.3.5. Soil Treatment
- 6.4. Market Analysis, Insights and Forecast - by Crop Type
- 6.4.1. Commercial Crops
- 6.4.2. Fruits & Vegetables
- 6.4.3. Grains & Cereals
- 6.4.4. Pulses & Oilseeds
- 6.4.5. Turf & Ornamental
- 6.1. Market Analysis, Insights and Forecast - by Application Mode
- 7. North America Nematicides Market Analysis, Insights and Forecast, 2020-2032
- 7.1. Market Analysis, Insights and Forecast - by Application Mode
- 7.1.1. Chemigation
- 7.1.2. Foliar
- 7.1.3. Fumigation
- 7.1.4. Seed Treatment
- 7.1.5. Soil Treatment
- 7.2. Market Analysis, Insights and Forecast - by Crop Type
- 7.2.1. Commercial Crops
- 7.2.2. Fruits & Vegetables
- 7.2.3. Grains & Cereals
- 7.2.4. Pulses & Oilseeds
- 7.2.5. Turf & Ornamental
- 7.3. Market Analysis, Insights and Forecast - by Application Mode
- 7.3.1. Chemigation
- 7.3.2. Foliar
- 7.3.3. Fumigation
- 7.3.4. Seed Treatment
- 7.3.5. Soil Treatment
- 7.4. Market Analysis, Insights and Forecast - by Crop Type
- 7.4.1. Commercial Crops
- 7.4.2. Fruits & Vegetables
- 7.4.3. Grains & Cereals
- 7.4.4. Pulses & Oilseeds
- 7.4.5. Turf & Ornamental
- 7.1. Market Analysis, Insights and Forecast - by Application Mode
- 8. South America Nematicides Market Analysis, Insights and Forecast, 2020-2032
- 8.1. Market Analysis, Insights and Forecast - by Application Mode
- 8.1.1. Chemigation
- 8.1.2. Foliar
- 8.1.3. Fumigation
- 8.1.4. Seed Treatment
- 8.1.5. Soil Treatment
- 8.2. Market Analysis, Insights and Forecast - by Crop Type
- 8.2.1. Commercial Crops
- 8.2.2. Fruits & Vegetables
- 8.2.3. Grains & Cereals
- 8.2.4. Pulses & Oilseeds
- 8.2.5. Turf & Ornamental
- 8.3. Market Analysis, Insights and Forecast - by Application Mode
- 8.3.1. Chemigation
- 8.3.2. Foliar
- 8.3.3. Fumigation
- 8.3.4. Seed Treatment
- 8.3.5. Soil Treatment
- 8.4. Market Analysis, Insights and Forecast - by Crop Type
- 8.4.1. Commercial Crops
- 8.4.2. Fruits & Vegetables
- 8.4.3. Grains & Cereals
- 8.4.4. Pulses & Oilseeds
- 8.4.5. Turf & Ornamental
- 8.1. Market Analysis, Insights and Forecast - by Application Mode
- 9. Europe Nematicides Market Analysis, Insights and Forecast, 2020-2032
- 9.1. Market Analysis, Insights and Forecast - by Application Mode
- 9.1.1. Chemigation
- 9.1.2. Foliar
- 9.1.3. Fumigation
- 9.1.4. Seed Treatment
- 9.1.5. Soil Treatment
- 9.2. Market Analysis, Insights and Forecast - by Crop Type
- 9.2.1. Commercial Crops
- 9.2.2. Fruits & Vegetables
- 9.2.3. Grains & Cereals
- 9.2.4. Pulses & Oilseeds
- 9.2.5. Turf & Ornamental
- 9.3. Market Analysis, Insights and Forecast - by Application Mode
- 9.3.1. Chemigation
- 9.3.2. Foliar
- 9.3.3. Fumigation
- 9.3.4. Seed Treatment
- 9.3.5. Soil Treatment
- 9.4. Market Analysis, Insights and Forecast - by Crop Type
- 9.4.1. Commercial Crops
- 9.4.2. Fruits & Vegetables
- 9.4.3. Grains & Cereals
- 9.4.4. Pulses & Oilseeds
- 9.4.5. Turf & Ornamental
- 9.1. Market Analysis, Insights and Forecast - by Application Mode
- 10. Middle East & Africa Nematicides Market Analysis, Insights and Forecast, 2020-2032
- 10.1. Market Analysis, Insights and Forecast - by Application Mode
- 10.1.1. Chemigation
- 10.1.2. Foliar
- 10.1.3. Fumigation
- 10.1.4. Seed Treatment
- 10.1.5. Soil Treatment
- 10.2. Market Analysis, Insights and Forecast - by Crop Type
- 10.2.1. Commercial Crops
- 10.2.2. Fruits & Vegetables
- 10.2.3. Grains & Cereals
- 10.2.4. Pulses & Oilseeds
- 10.2.5. Turf & Ornamental
- 10.3. Market Analysis, Insights and Forecast - by Application Mode
- 10.3.1. Chemigation
- 10.3.2. Foliar
- 10.3.3. Fumigation
- 10.3.4. Seed Treatment
- 10.3.5. Soil Treatment
- 10.4. Market Analysis, Insights and Forecast - by Crop Type
- 10.4.1. Commercial Crops
- 10.4.2. Fruits & Vegetables
- 10.4.3. Grains & Cereals
- 10.4.4. Pulses & Oilseeds
- 10.4.5. Turf & Ornamental
- 10.1. Market Analysis, Insights and Forecast - by Application Mode
- 11. Asia Pacific Nematicides Market Analysis, Insights and Forecast, 2020-2032
- 11.1. Market Analysis, Insights and Forecast - by Application Mode
- 11.1.1. Chemigation
- 11.1.2. Foliar
- 11.1.3. Fumigation
- 11.1.4. Seed Treatment
- 11.1.5. Soil Treatment
- 11.2. Market Analysis, Insights and Forecast - by Crop Type
- 11.2.1. Commercial Crops
- 11.2.2. Fruits & Vegetables
- 11.2.3. Grains & Cereals
- 11.2.4. Pulses & Oilseeds
- 11.2.5. Turf & Ornamental
- 11.3. Market Analysis, Insights and Forecast - by Application Mode
- 11.3.1. Chemigation
- 11.3.2. Foliar
- 11.3.3. Fumigation
- 11.3.4. Seed Treatment
- 11.3.5. Soil Treatment
- 11.4. Market Analysis, Insights and Forecast - by Crop Type
- 11.4.1. Commercial Crops
- 11.4.2. Fruits & Vegetables
- 11.4.3. Grains & Cereals
- 11.4.4. Pulses & Oilseeds
- 11.4.5. Turf & Ornamental
- 11.1. Market Analysis, Insights and Forecast - by Application Mode
- 12. Competitive Analysis
- 12.1. Company Profiles
- 12.1.1 Tessenderlo Kerley Inc (Novasource)
- 12.1.1.1. Company Overview
- 12.1.1.2. Products
- 12.1.1.3. Company Financials
- 12.1.1.4. SWOT Analysis
- 12.1.2 American Vanguard Corporation
- 12.1.2.1. Company Overview
- 12.1.2.2. Products
- 12.1.2.3. Company Financials
- 12.1.2.4. SWOT Analysis
- 12.1.3 ADAMA Agricultural Solutions Ltd
- 12.1.3.1. Company Overview
- 12.1.3.2. Products
- 12.1.3.3. Company Financials
- 12.1.3.4. SWOT Analysis
- 12.1.4 Bayer AG
- 12.1.4.1. Company Overview
- 12.1.4.2. Products
- 12.1.4.3. Company Financials
- 12.1.4.4. SWOT Analysis
- 12.1.5 Albaugh LLC
- 12.1.5.1. Company Overview
- 12.1.5.2. Products
- 12.1.5.3. Company Financials
- 12.1.5.4. SWOT Analysis
- 12.1.6 Syngenta Group
- 12.1.6.1. Company Overview
- 12.1.6.2. Products
- 12.1.6.3. Company Financials
- 12.1.6.4. SWOT Analysis
- 12.1.7 Upl Limited
- 12.1.7.1. Company Overview
- 12.1.7.2. Products
- 12.1.7.3. Company Financials
- 12.1.7.4. SWOT Analysis
- 12.1.8 Corteva Agriscience
- 12.1.8.1. Company Overview
- 12.1.8.2. Products
- 12.1.8.3. Company Financials
- 12.1.8.4. SWOT Analysis
- 12.1.9 Vive Crop Protectio
- 12.1.9.1. Company Overview
- 12.1.9.2. Products
- 12.1.9.3. Company Financials
- 12.1.9.4. SWOT Analysis
- 12.1.1 Tessenderlo Kerley Inc (Novasource)
- 12.2. Market Entropy
- 12.2.1 Company's Key Areas Served
- 12.2.2 Recent Developments
- 12.3. Company Market Share Analysis 2025
- 12.3.1 Top 5 Companies Market Share Analysis
- 12.3.2 Top 3 Companies Market Share Analysis
- 12.4. List of Potential Customers
- 13. Research Methodology
List of Figures
- Figure 1: Global Nematicides Market Revenue Breakdown (million, %) by Region 2025 & 2033
- Figure 2: North America Nematicides Market Revenue (million), by Application Mode 2025 & 2033
- Figure 3: North America Nematicides Market Revenue Share (%), by Application Mode 2025 & 2033
- Figure 4: North America Nematicides Market Revenue (million), by Crop Type 2025 & 2033
- Figure 5: North America Nematicides Market Revenue Share (%), by Crop Type 2025 & 2033
- Figure 6: North America Nematicides Market Revenue (million), by Application Mode 2025 & 2033
- Figure 7: North America Nematicides Market Revenue Share (%), by Application Mode 2025 & 2033
- Figure 8: North America Nematicides Market Revenue (million), by Crop Type 2025 & 2033
- Figure 9: North America Nematicides Market Revenue Share (%), by Crop Type 2025 & 2033
- Figure 10: North America Nematicides Market Revenue (million), by Country 2025 & 2033
- Figure 11: North America Nematicides Market Revenue Share (%), by Country 2025 & 2033
- Figure 12: South America Nematicides Market Revenue (million), by Application Mode 2025 & 2033
- Figure 13: South America Nematicides Market Revenue Share (%), by Application Mode 2025 & 2033
- Figure 14: South America Nematicides Market Revenue (million), by Crop Type 2025 & 2033
- Figure 15: South America Nematicides Market Revenue Share (%), by Crop Type 2025 & 2033
- Figure 16: South America Nematicides Market Revenue (million), by Application Mode 2025 & 2033
- Figure 17: South America Nematicides Market Revenue Share (%), by Application Mode 2025 & 2033
- Figure 18: South America Nematicides Market Revenue (million), by Crop Type 2025 & 2033
- Figure 19: South America Nematicides Market Revenue Share (%), by Crop Type 2025 & 2033
- Figure 20: South America Nematicides Market Revenue (million), by Country 2025 & 2033
- Figure 21: South America Nematicides Market Revenue Share (%), by Country 2025 & 2033
- Figure 22: Europe Nematicides Market Revenue (million), by Application Mode 2025 & 2033
- Figure 23: Europe Nematicides Market Revenue Share (%), by Application Mode 2025 & 2033
- Figure 24: Europe Nematicides Market Revenue (million), by Crop Type 2025 & 2033
- Figure 25: Europe Nematicides Market Revenue Share (%), by Crop Type 2025 & 2033
- Figure 26: Europe Nematicides Market Revenue (million), by Application Mode 2025 & 2033
- Figure 27: Europe Nematicides Market Revenue Share (%), by Application Mode 2025 & 2033
- Figure 28: Europe Nematicides Market Revenue (million), by Crop Type 2025 & 2033
- Figure 29: Europe Nematicides Market Revenue Share (%), by Crop Type 2025 & 2033
- Figure 30: Europe Nematicides Market Revenue (million), by Country 2025 & 2033
- Figure 31: Europe Nematicides Market Revenue Share (%), by Country 2025 & 2033
- Figure 32: Middle East & Africa Nematicides Market Revenue (million), by Application Mode 2025 & 2033
- Figure 33: Middle East & Africa Nematicides Market Revenue Share (%), by Application Mode 2025 & 2033
- Figure 34: Middle East & Africa Nematicides Market Revenue (million), by Crop Type 2025 & 2033
- Figure 35: Middle East & Africa Nematicides Market Revenue Share (%), by Crop Type 2025 & 2033
- Figure 36: Middle East & Africa Nematicides Market Revenue (million), by Application Mode 2025 & 2033
- Figure 37: Middle East & Africa Nematicides Market Revenue Share (%), by Application Mode 2025 & 2033
- Figure 38: Middle East & Africa Nematicides Market Revenue (million), by Crop Type 2025 & 2033
- Figure 39: Middle East & Africa Nematicides Market Revenue Share (%), by Crop Type 2025 & 2033
- Figure 40: Middle East & Africa Nematicides Market Revenue (million), by Country 2025 & 2033
- Figure 41: Middle East & Africa Nematicides Market Revenue Share (%), by Country 2025 & 2033
- Figure 42: Asia Pacific Nematicides Market Revenue (million), by Application Mode 2025 & 2033
- Figure 43: Asia Pacific Nematicides Market Revenue Share (%), by Application Mode 2025 & 2033
- Figure 44: Asia Pacific Nematicides Market Revenue (million), by Crop Type 2025 & 2033
- Figure 45: Asia Pacific Nematicides Market Revenue Share (%), by Crop Type 2025 & 2033
- Figure 46: Asia Pacific Nematicides Market Revenue (million), by Application Mode 2025 & 2033
- Figure 47: Asia Pacific Nematicides Market Revenue Share (%), by Application Mode 2025 & 2033
- Figure 48: Asia Pacific Nematicides Market Revenue (million), by Crop Type 2025 & 2033
- Figure 49: Asia Pacific Nematicides Market Revenue Share (%), by Crop Type 2025 & 2033
- Figure 50: Asia Pacific Nematicides Market Revenue (million), by Country 2025 & 2033
- Figure 51: Asia Pacific Nematicides Market Revenue Share (%), by Country 2025 & 2033
List of Tables
- Table 1: Global Nematicides Market Revenue million Forecast, by Application Mode 2020 & 2033
- Table 2: Global Nematicides Market Revenue million Forecast, by Crop Type 2020 & 2033
- Table 3: Global Nematicides Market Revenue million Forecast, by Application Mode 2020 & 2033
- Table 4: Global Nematicides Market Revenue million Forecast, by Crop Type 2020 & 2033
- Table 5: Global Nematicides Market Revenue million Forecast, by Region 2020 & 2033
- Table 6: Global Nematicides Market Revenue million Forecast, by Application Mode 2020 & 2033
- Table 7: Global Nematicides Market Revenue million Forecast, by Crop Type 2020 & 2033
- Table 8: Global Nematicides Market Revenue million Forecast, by Application Mode 2020 & 2033
- Table 9: Global Nematicides Market Revenue million Forecast, by Crop Type 2020 & 2033
- Table 10: Global Nematicides Market Revenue million Forecast, by Country 2020 & 2033
- Table 11: United States Nematicides Market Revenue (million) Forecast, by Application 2020 & 2033
- Table 12: Canada Nematicides Market Revenue (million) Forecast, by Application 2020 & 2033
- Table 13: Mexico Nematicides Market Revenue (million) Forecast, by Application 2020 & 2033
- Table 14: Global Nematicides Market Revenue million Forecast, by Application Mode 2020 & 2033
- Table 15: Global Nematicides Market Revenue million Forecast, by Crop Type 2020 & 2033
- Table 16: Global Nematicides Market Revenue million Forecast, by Application Mode 2020 & 2033
- Table 17: Global Nematicides Market Revenue million Forecast, by Crop Type 2020 & 2033
- Table 18: Global Nematicides Market Revenue million Forecast, by Country 2020 & 2033
- Table 19: Brazil Nematicides Market Revenue (million) Forecast, by Application 2020 & 2033
- Table 20: Argentina Nematicides Market Revenue (million) Forecast, by Application 2020 & 2033
- Table 21: Rest of South America Nematicides Market Revenue (million) Forecast, by Application 2020 & 2033
- Table 22: Global Nematicides Market Revenue million Forecast, by Application Mode 2020 & 2033
- Table 23: Global Nematicides Market Revenue million Forecast, by Crop Type 2020 & 2033
- Table 24: Global Nematicides Market Revenue million Forecast, by Application Mode 2020 & 2033
- Table 25: Global Nematicides Market Revenue million Forecast, by Crop Type 2020 & 2033
- Table 26: Global Nematicides Market Revenue million Forecast, by Country 2020 & 2033
- Table 27: United Kingdom Nematicides Market Revenue (million) Forecast, by Application 2020 & 2033
- Table 28: Germany Nematicides Market Revenue (million) Forecast, by Application 2020 & 2033
- Table 29: France Nematicides Market Revenue (million) Forecast, by Application 2020 & 2033
- Table 30: Italy Nematicides Market Revenue (million) Forecast, by Application 2020 & 2033
- Table 31: Spain Nematicides Market Revenue (million) Forecast, by Application 2020 & 2033
- Table 32: Russia Nematicides Market Revenue (million) Forecast, by Application 2020 & 2033
- Table 33: Benelux Nematicides Market Revenue (million) Forecast, by Application 2020 & 2033
- Table 34: Nordics Nematicides Market Revenue (million) Forecast, by Application 2020 & 2033
- Table 35: Rest of Europe Nematicides Market Revenue (million) Forecast, by Application 2020 & 2033
- Table 36: Global Nematicides Market Revenue million Forecast, by Application Mode 2020 & 2033
- Table 37: Global Nematicides Market Revenue million Forecast, by Crop Type 2020 & 2033
- Table 38: Global Nematicides Market Revenue million Forecast, by Application Mode 2020 & 2033
- Table 39: Global Nematicides Market Revenue million Forecast, by Crop Type 2020 & 2033
- Table 40: Global Nematicides Market Revenue million Forecast, by Country 2020 & 2033
- Table 41: Turkey Nematicides Market Revenue (million) Forecast, by Application 2020 & 2033
- Table 42: Israel Nematicides Market Revenue (million) Forecast, by Application 2020 & 2033
- Table 43: GCC Nematicides Market Revenue (million) Forecast, by Application 2020 & 2033
- Table 44: North Africa Nematicides Market Revenue (million) Forecast, by Application 2020 & 2033
- Table 45: South Africa Nematicides Market Revenue (million) Forecast, by Application 2020 & 2033
- Table 46: Rest of Middle East & Africa Nematicides Market Revenue (million) Forecast, by Application 2020 & 2033
- Table 47: Global Nematicides Market Revenue million Forecast, by Application Mode 2020 & 2033
- Table 48: Global Nematicides Market Revenue million Forecast, by Crop Type 2020 & 2033
- Table 49: Global Nematicides Market Revenue million Forecast, by Application Mode 2020 & 2033
- Table 50: Global Nematicides Market Revenue million Forecast, by Crop Type 2020 & 2033
- Table 51: Global Nematicides Market Revenue million Forecast, by Country 2020 & 2033
- Table 52: China Nematicides Market Revenue (million) Forecast, by Application 2020 & 2033
- Table 53: India Nematicides Market Revenue (million) Forecast, by Application 2020 & 2033
- Table 54: Japan Nematicides Market Revenue (million) Forecast, by Application 2020 & 2033
- Table 55: South Korea Nematicides Market Revenue (million) Forecast, by Application 2020 & 2033
- Table 56: ASEAN Nematicides Market Revenue (million) Forecast, by Application 2020 & 2033
- Table 57: Oceania Nematicides Market Revenue (million) Forecast, by Application 2020 & 2033
- Table 58: Rest of Asia Pacific Nematicides Market Revenue (million) Forecast, by Application 2020 & 2033
Frequently Asked Questions
1. What is the projected Compound Annual Growth Rate (CAGR) of the Nematicides Market?
The projected CAGR is approximately 4.2%.
2. Which companies are prominent players in the Nematicides Market?
Key companies in the market include Tessenderlo Kerley Inc (Novasource), American Vanguard Corporation, ADAMA Agricultural Solutions Ltd, Bayer AG, Albaugh LLC, Syngenta Group, Upl Limited, Corteva Agriscience, Vive Crop Protectio.
3. What are the main segments of the Nematicides Market?
The market segments include Application Mode, Crop Type, Application Mode, Crop Type.
4. Can you provide details about the market size?
The market size is estimated to be USD 289.36 million as of 2022.
5. What are some drivers contributing to market growth?
Seed Treatment As A Solution To Enhance Yield; Growing Awareness For Seed Treatment Among The Farmers; Rising Trend Of Organic Farming.
6. What are the notable trends driving market growth?
Increased nematode infestations and the growing adoption of nematicides stood South America in prominent position.
7. Are there any restraints impacting market growth?
Limitations Across Farm-Level Seed Treatment; Rising Environmental Concerns.
8. Can you provide examples of recent developments in the market?
January 2023: Bayer formed a new partnership with Oerth Bio to enhance crop protection technology and create more eco-friendly crop protection solutions.June 2022: AgriNova New Zealand Ltd was acquired by ADAMA Ltd. With this acquisition, ADAMA expanded its product line in the New Zealand market.May 2022: Corteva Agriscience in Brazil expanded its portfolio, services, and industrial infrastructure to commercial partners to strengthen its activities in the seed treatment industry. For instance, the company strengthened its operations in the area of seed treatment with the new global brands LumiGEN and Ampl.
9. What pricing options are available for accessing the report?
Pricing options include single-user, multi-user, and enterprise licenses priced at USD 3800, USD 4500, and USD 5800 respectively.
10. Is the market size provided in terms of value or volume?
The market size is provided in terms of value, measured in million.
11. Are there any specific market keywords associated with the report?
Yes, the market keyword associated with the report is "Nematicides Market," which aids in identifying and referencing the specific market segment covered.
12. How do I determine which pricing option suits my needs best?
The pricing options vary based on user requirements and access needs. Individual users may opt for single-user licenses, while businesses requiring broader access may choose multi-user or enterprise licenses for cost-effective access to the report.
13. Are there any additional resources or data provided in the Nematicides Market report?
While the report offers comprehensive insights, it's advisable to review the specific contents or supplementary materials provided to ascertain if additional resources or data are available.
14. How can I stay updated on further developments or reports in the Nematicides Market?
To stay informed about further developments, trends, and reports in the Nematicides Market, consider subscribing to industry newsletters, following relevant companies and organizations, or regularly checking reputable industry news sources and publications.
Methodology
Step 1 - Identification of Relevant Samples Size from Population Database


Step 2 - Approaches for Defining Global Market Size (Value, Volume* & Price*)

Note*: In applicable scenarios
Step 3 - Data Sources
Primary Research
- Web Analytics
- Survey Reports
- Research Institute
- Latest Research Reports
- Opinion Leaders
Secondary Research
- Annual Reports
- White Paper
- Latest Press Release
- Industry Association
- Paid Database
- Investor Presentations

Step 4 - Data Triangulation
Involves using different sources of information in order to increase the validity of a study
These sources are likely to be stakeholders in a program - participants, other researchers, program staff, other community members, and so on.
Then we put all data in single framework & apply various statistical tools to find out the dynamic on the market.
During the analysis stage, feedback from the stakeholder groups would be compared to determine areas of agreement as well as areas of divergence