

Key Insights
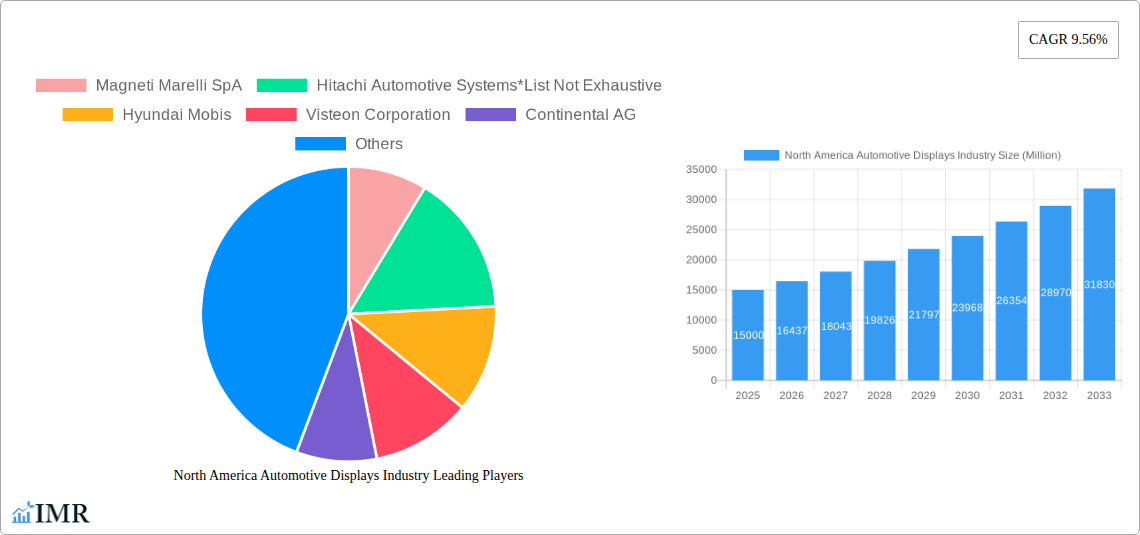
The North American automotive displays market is experiencing robust growth, driven by the increasing demand for advanced driver-assistance systems (ADAS) and in-vehicle infotainment (IVI) systems. The market, valued at approximately $15 billion in 2025, is projected to exhibit a Compound Annual Growth Rate (CAGR) of 9.56% from 2025 to 2033, reaching an estimated $30 billion by 2033. This expansion is fueled by several key factors. The rising adoption of larger, higher-resolution displays, particularly OLED and TFT-LCD technologies, enhances the driver and passenger experience. Furthermore, the integration of sophisticated features like heads-up displays (HUDs) and rear-seat entertainment systems is significantly boosting market demand. The increasing prevalence of electric and autonomous vehicles is also a contributing factor, as these vehicles typically incorporate more advanced and larger display systems. The OEM segment dominates the market, reflecting the trend of incorporating advanced display technology directly into new vehicle production. However, the aftermarket segment is poised for growth, driven by consumer demand for upgrades and retrofits. North America, particularly the United States and Canada, is a significant market driver due to high vehicle ownership rates and a strong automotive manufacturing base. Competition within the market is intense, with major players like Magneti Marelli, Hitachi Automotive Systems, Hyundai Mobis, and others vying for market share through technological innovation and strategic partnerships.
While the market presents significant opportunities, certain challenges persist. Supply chain disruptions, particularly in the procurement of key components like semiconductors, pose a risk to consistent growth. Furthermore, increasing regulatory compliance requirements related to safety and cybersecurity add to the operational costs for manufacturers. Despite these challenges, the long-term outlook for the North American automotive displays market remains positive, fueled by the continuous advancements in display technology and the growing demand for enhanced in-vehicle experiences. The market segmentation by technology type (LCD, TFT-LCD, OLED), product type (center stack, instrument cluster, HUD, rear-seat entertainment), sales type (OEM, aftermarket), country (US, Canada, Mexico), and vehicle type (passenger cars, commercial vehicles) provides a detailed understanding of market dynamics and opportunities within specific niches.
This comprehensive report provides an in-depth analysis of the North America automotive displays market, encompassing historical data (2019-2024), current estimates (2025), and future forecasts (2025-2033). We examine market dynamics, growth trends, dominant segments, and key players, offering invaluable insights for industry professionals, investors, and strategic decision-makers. The report segments the market by technology type (LCD, TFT-LCD, OLED), product type (center stack display, instrument cluster display, heads-up display, rear seat entertainment system), sales type (OEM, aftermarket), country (United States, Canada, Rest of North America), and vehicle type (passenger cars, commercial vehicles). The total market size is projected to reach xx million units by 2033.
North America Automotive Displays Industry Market Dynamics & Structure
The North American automotive displays market is characterized by a moderately consolidated structure with several major players vying for market share. Technological innovation, particularly in areas like OLED and augmented reality displays, is a key driver. Stringent regulatory frameworks concerning safety and emissions influence display design and functionality. The market witnesses continuous competition from alternative infotainment solutions. Consumer preferences, particularly among younger demographics, heavily influence display features and integration. The historical period (2019-2024) saw several mergers and acquisitions (M&A) activities, with a total volume of xx deals, aiming to consolidate market power and expand product portfolios. The market share of the top 5 players is estimated to be around xx% in 2025.
- Market Concentration: Moderately consolidated, with top 5 players holding xx% market share (2025).
- Technological Innovation: OLED, augmented reality, and high-resolution displays are key drivers.
- Regulatory Framework: Safety and emission standards impact design and functionality.
- Competitive Substitutes: Alternative infotainment systems pose a competitive threat.
- End-User Demographics: Younger demographics drive demand for advanced features.
- M&A Activity: xx deals (2019-2024), aimed at market consolidation and expansion.
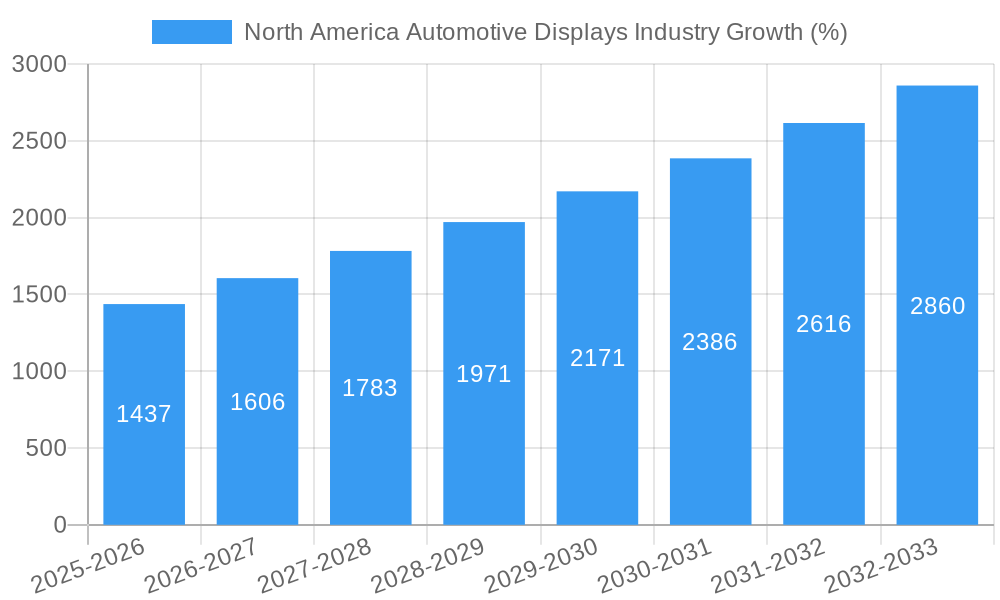
North America Automotive Displays Industry Growth Trends & Insights
The North American automotive displays market has witnessed robust growth over the past years, driven by rising vehicle production, increasing demand for advanced driver-assistance systems (ADAS), and growing consumer preference for enhanced in-vehicle infotainment. The market size expanded from xx million units in 2019 to xx million units in 2024, exhibiting a CAGR of xx%. The adoption rate of advanced displays, such as HUDs and OLEDs, is increasing steadily, driven by technological advancements and falling prices. Consumer preference shifts towards larger, higher-resolution displays with improved features are further contributing to market growth. The forecast period (2025-2033) predicts continued growth, with a projected CAGR of xx%, reaching xx million units by 2033. Technological disruptions, such as the introduction of mini-LED and micro-LED displays, are anticipated to further fuel this expansion.
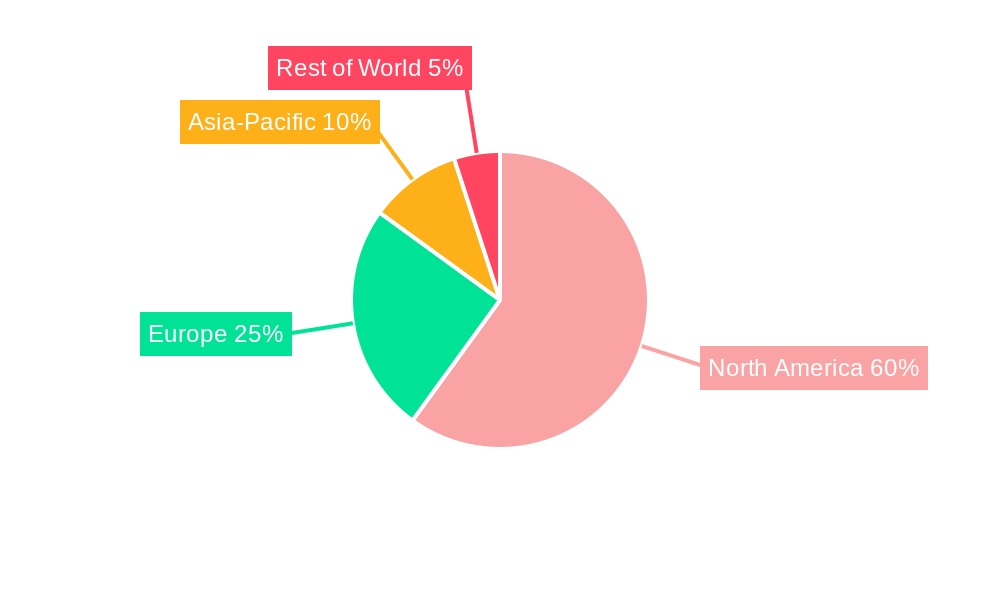
Dominant Regions, Countries, or Segments in North America Automotive Displays Industry
The United States remains the dominant market for automotive displays in North America, accounting for the largest share of the overall market due to high vehicle production volumes and strong consumer demand for advanced features. The OEM segment continues to be the largest sales channel. Within product types, the center stack display and instrument cluster display segments exhibit high growth potential, propelled by rising demand for infotainment systems and driver-assistance features. The adoption of OLED technology is gaining momentum, driven by its superior image quality.
- Dominant Region: United States (xx% market share in 2025).
- Dominant Segment (Product Type): Center Stack Display and Instrument Cluster Display
- Dominant Segment (Technology): TFT-LCD (currently dominant, transitioning to OLED).
- Dominant Sales Channel: OEM.
- Key Drivers: High vehicle production, consumer preference for advanced features, technological advancements.
North America Automotive Displays Industry Product Landscape
The automotive display market offers a wide array of products, ranging from basic LCD displays to advanced OLED and HUD systems. Innovation focuses on improved resolution, enhanced brightness, wider viewing angles, and integration with ADAS features. Unique selling propositions include improved image quality, reduced power consumption, and enhanced durability. Technological advancements involve the adoption of new display technologies, such as mini-LED and micro-LED, along with the development of advanced driver-assistance features that rely on high-quality displays for optimal performance.
Key Drivers, Barriers & Challenges in North America Automotive Displays Industry
Key Drivers:
- Rising demand for enhanced in-vehicle infotainment systems.
- Increasing adoption of ADAS and autonomous driving technologies.
- Technological advancements in display technologies (OLED, HUDs).
- Growth in the electric vehicle (EV) market.
Key Challenges:
- Intense competition from established and emerging players.
- Supply chain disruptions impacting raw material availability and production costs. Quantifiable impact: xx% increase in production costs in 2022.
- Regulatory compliance requirements for safety and emission standards.
- High research and development costs associated with developing new technologies.
Emerging Opportunities in North America Automotive Displays Industry
- Increasing demand for larger and higher-resolution displays in luxury vehicles.
- Growing popularity of augmented reality (AR) HUDs and advanced driver-assistance systems.
- Development of flexible and transparent displays for innovative automotive designs.
- Expansion into new markets, such as commercial vehicles and autonomous vehicles.
Growth Accelerators in the North America Automotive Displays Industry
Long-term growth is fueled by technological breakthroughs like mini-LED and micro-LED, strategic partnerships between display manufacturers and automotive OEMs, and expanding market penetration into commercial and autonomous vehicles. The development of more energy-efficient displays is also a significant driver of growth.
Key Players Shaping the North America Automotive Displays Industry Market
- Magneti Marelli SpA
- Hitachi Automotive Systems
- Hyundai Mobis
- Visteon Corporation
- Continental AG
- Robert Bosch GmbH
- Delphi Technologies
- DENSO Corporation
- LG Electronics
- MTA S p A
Notable Milestones in North America Automotive Displays Industry Sector
- May 2022: Panasonic Automotive Systems' 11.5-inch WS HUD adopted by Nissan Ariya and Rogue.
- June 2022: Visteon Corporation introduces TrueColor Image Enhancement technology.
- January 2022: Continental AG supplies OpenR Link displays for Renault Megane E-Tech.
In-Depth North America Automotive Displays Industry Market Outlook
The future of the North American automotive displays market looks promising, driven by continuous technological innovation, rising demand for advanced features, and increasing vehicle production. Strategic partnerships and investments in R&D are set to further accelerate growth. The market is poised for significant expansion, presenting substantial opportunities for both established and emerging players. The focus on enhancing safety and driver experience will drive demand for more advanced and sophisticated displays.
North America Automotive Displays Industry Segmentation
-
1. Vehicle Type
- 1.1. Passenger Cars
- 1.2. Commercial Vehicles
-
2. Technology Type
- 2.1. LCD
- 2.2. TFT-LCD
- 2.3. OLED
-
3. Product Type
- 3.1. Center Stack Display
- 3.2. Instrument Cluster Display
- 3.3. Heads-up Display
- 3.4. Rear Seat Entertainment System
-
4. Sales Type
- 4.1. OEM
- 4.2. Aftermarket
North America Automotive Displays Industry Segmentation By Geography
-
1. North America
- 1.1. United States
- 1.2. Canada
- 1.3. Mexico
North America Automotive Displays Industry REPORT HIGHLIGHTS
| Aspects | Details |
|---|---|
| Study Period | 2019-2033 |
| Base Year | 2024 |
| Estimated Year | 2025 |
| Forecast Period | 2025-2033 |
| Historical Period | 2019-2024 |
| Growth Rate | CAGR of 9.56% from 2019-2033 |
| Segmentation |
|
Table of Contents
- 1. Introduction
- 1.1. Research Scope
- 1.2. Market Segmentation
- 1.3. Research Methodology
- 1.4. Definitions and Assumptions
- 2. Executive Summary
- 2.1. Introduction
- 3. Market Dynamics
- 3.1. Introduction
- 3.2. Market Drivers
- 3.2.1. Increase in Sales of Passenger Cars
- 3.3. Market Restrains
- 3.3.1. Failure in Garage Equipment may Result in Downtime of the Repair Work
- 3.4. Market Trends
- 3.4.1. Head-Up Display Segment of Market to Play Key role During the Forecast Period
- 4. Market Factor Analysis
- 4.1. Porters Five Forces
- 4.2. Supply/Value Chain
- 4.3. PESTEL analysis
- 4.4. Market Entropy
- 4.5. Patent/Trademark Analysis
- 5. North America Automotive Displays Industry Analysis, Insights and Forecast, 2019-2031
- 5.1. Market Analysis, Insights and Forecast - by Vehicle Type
- 5.1.1. Passenger Cars
- 5.1.2. Commercial Vehicles
- 5.2. Market Analysis, Insights and Forecast - by Technology Type
- 5.2.1. LCD
- 5.2.2. TFT-LCD
- 5.2.3. OLED
- 5.3. Market Analysis, Insights and Forecast - by Product Type
- 5.3.1. Center Stack Display
- 5.3.2. Instrument Cluster Display
- 5.3.3. Heads-up Display
- 5.3.4. Rear Seat Entertainment System
- 5.4. Market Analysis, Insights and Forecast - by Sales Type
- 5.4.1. OEM
- 5.4.2. Aftermarket
- 5.5. Market Analysis, Insights and Forecast - by Region
- 5.5.1. North America
- 5.1. Market Analysis, Insights and Forecast - by Vehicle Type
- 6. United States North America Automotive Displays Industry Analysis, Insights and Forecast, 2019-2031
- 7. Canada North America Automotive Displays Industry Analysis, Insights and Forecast, 2019-2031
- 8. Mexico North America Automotive Displays Industry Analysis, Insights and Forecast, 2019-2031
- 9. Rest of North America North America Automotive Displays Industry Analysis, Insights and Forecast, 2019-2031
- 10. Competitive Analysis
- 10.1. Market Share Analysis 2024
- 10.2. Company Profiles
- 10.2.1 Magneti Marelli SpA
- 10.2.1.1. Overview
- 10.2.1.2. Products
- 10.2.1.3. SWOT Analysis
- 10.2.1.4. Recent Developments
- 10.2.1.5. Financials (Based on Availability)
- 10.2.2 Hitachi Automotive Systems*List Not Exhaustive
- 10.2.2.1. Overview
- 10.2.2.2. Products
- 10.2.2.3. SWOT Analysis
- 10.2.2.4. Recent Developments
- 10.2.2.5. Financials (Based on Availability)
- 10.2.3 Hyundai Mobis
- 10.2.3.1. Overview
- 10.2.3.2. Products
- 10.2.3.3. SWOT Analysis
- 10.2.3.4. Recent Developments
- 10.2.3.5. Financials (Based on Availability)
- 10.2.4 Visteon Corporation
- 10.2.4.1. Overview
- 10.2.4.2. Products
- 10.2.4.3. SWOT Analysis
- 10.2.4.4. Recent Developments
- 10.2.4.5. Financials (Based on Availability)
- 10.2.5 Continental AG
- 10.2.5.1. Overview
- 10.2.5.2. Products
- 10.2.5.3. SWOT Analysis
- 10.2.5.4. Recent Developments
- 10.2.5.5. Financials (Based on Availability)
- 10.2.6 Robert Bosch GmbH
- 10.2.6.1. Overview
- 10.2.6.2. Products
- 10.2.6.3. SWOT Analysis
- 10.2.6.4. Recent Developments
- 10.2.6.5. Financials (Based on Availability)
- 10.2.7 Delphi Technologies
- 10.2.7.1. Overview
- 10.2.7.2. Products
- 10.2.7.3. SWOT Analysis
- 10.2.7.4. Recent Developments
- 10.2.7.5. Financials (Based on Availability)
- 10.2.8 DENSO Corporation
- 10.2.8.1. Overview
- 10.2.8.2. Products
- 10.2.8.3. SWOT Analysis
- 10.2.8.4. Recent Developments
- 10.2.8.5. Financials (Based on Availability)
- 10.2.9 LG Electronics
- 10.2.9.1. Overview
- 10.2.9.2. Products
- 10.2.9.3. SWOT Analysis
- 10.2.9.4. Recent Developments
- 10.2.9.5. Financials (Based on Availability)
- 10.2.10 MTA S p A
- 10.2.10.1. Overview
- 10.2.10.2. Products
- 10.2.10.3. SWOT Analysis
- 10.2.10.4. Recent Developments
- 10.2.10.5. Financials (Based on Availability)
- 10.2.1 Magneti Marelli SpA
List of Figures
- Figure 1: North America Automotive Displays Industry Revenue Breakdown (Million, %) by Product 2024 & 2032
- Figure 2: North America Automotive Displays Industry Share (%) by Company 2024
List of Tables
- Table 1: North America Automotive Displays Industry Revenue Million Forecast, by Region 2019 & 2032
- Table 2: North America Automotive Displays Industry Revenue Million Forecast, by Vehicle Type 2019 & 2032
- Table 3: North America Automotive Displays Industry Revenue Million Forecast, by Technology Type 2019 & 2032
- Table 4: North America Automotive Displays Industry Revenue Million Forecast, by Product Type 2019 & 2032
- Table 5: North America Automotive Displays Industry Revenue Million Forecast, by Sales Type 2019 & 2032
- Table 6: North America Automotive Displays Industry Revenue Million Forecast, by Region 2019 & 2032
- Table 7: North America Automotive Displays Industry Revenue Million Forecast, by Country 2019 & 2032
- Table 8: United States North America Automotive Displays Industry Revenue (Million) Forecast, by Application 2019 & 2032
- Table 9: Canada North America Automotive Displays Industry Revenue (Million) Forecast, by Application 2019 & 2032
- Table 10: Mexico North America Automotive Displays Industry Revenue (Million) Forecast, by Application 2019 & 2032
- Table 11: Rest of North America North America Automotive Displays Industry Revenue (Million) Forecast, by Application 2019 & 2032
- Table 12: North America Automotive Displays Industry Revenue Million Forecast, by Vehicle Type 2019 & 2032
- Table 13: North America Automotive Displays Industry Revenue Million Forecast, by Technology Type 2019 & 2032
- Table 14: North America Automotive Displays Industry Revenue Million Forecast, by Product Type 2019 & 2032
- Table 15: North America Automotive Displays Industry Revenue Million Forecast, by Sales Type 2019 & 2032
- Table 16: North America Automotive Displays Industry Revenue Million Forecast, by Country 2019 & 2032
- Table 17: United States North America Automotive Displays Industry Revenue (Million) Forecast, by Application 2019 & 2032
- Table 18: Canada North America Automotive Displays Industry Revenue (Million) Forecast, by Application 2019 & 2032
- Table 19: Mexico North America Automotive Displays Industry Revenue (Million) Forecast, by Application 2019 & 2032
Frequently Asked Questions
1. What is the projected Compound Annual Growth Rate (CAGR) of the North America Automotive Displays Industry?
The projected CAGR is approximately 9.56%.
2. Which companies are prominent players in the North America Automotive Displays Industry?
Key companies in the market include Magneti Marelli SpA, Hitachi Automotive Systems*List Not Exhaustive, Hyundai Mobis, Visteon Corporation, Continental AG, Robert Bosch GmbH, Delphi Technologies, DENSO Corporation, LG Electronics, MTA S p A.
3. What are the main segments of the North America Automotive Displays Industry?
The market segments include Vehicle Type, Technology Type, Product Type, Sales Type.
4. Can you provide details about the market size?
The market size is estimated to be USD XX Million as of 2022.
5. What are some drivers contributing to market growth?
Increase in Sales of Passenger Cars.
6. What are the notable trends driving market growth?
Head-Up Display Segment of Market to Play Key role During the Forecast Period.
7. Are there any restraints impacting market growth?
Failure in Garage Equipment may Result in Downtime of the Repair Work.
8. Can you provide examples of recent developments in the market?
In May 2022, Panasonic Automotive Systems Co., Ltd. (Panasonic Automotive Systems) announced that its 11.5-inch windshield head-up display (WS HUD) has been adopted for Nissan Motor Co., Ltd.'s new Ariya crossover electric vehicle (EV). Earlier in 2022, the same head-up display was supplied for Nissan Rogue as well.
9. What pricing options are available for accessing the report?
Pricing options include single-user, multi-user, and enterprise licenses priced at USD 4750, USD 4950, and USD 6800 respectively.
10. Is the market size provided in terms of value or volume?
The market size is provided in terms of value, measured in Million.
11. Are there any specific market keywords associated with the report?
Yes, the market keyword associated with the report is "North America Automotive Displays Industry," which aids in identifying and referencing the specific market segment covered.
12. How do I determine which pricing option suits my needs best?
The pricing options vary based on user requirements and access needs. Individual users may opt for single-user licenses, while businesses requiring broader access may choose multi-user or enterprise licenses for cost-effective access to the report.
13. Are there any additional resources or data provided in the North America Automotive Displays Industry report?
While the report offers comprehensive insights, it's advisable to review the specific contents or supplementary materials provided to ascertain if additional resources or data are available.
14. How can I stay updated on further developments or reports in the North America Automotive Displays Industry?
To stay informed about further developments, trends, and reports in the North America Automotive Displays Industry, consider subscribing to industry newsletters, following relevant companies and organizations, or regularly checking reputable industry news sources and publications.
Methodology
Step 1 - Identification of Relevant Samples Size from Population Database


Step 2 - Approaches for Defining Global Market Size (Value, Volume* & Price*)

Note*: In applicable scenarios
Step 3 - Data Sources
Primary Research
- Web Analytics
- Survey Reports
- Research Institute
- Latest Research Reports
- Opinion Leaders
Secondary Research
- Annual Reports
- White Paper
- Latest Press Release
- Industry Association
- Paid Database
- Investor Presentations

Step 4 - Data Triangulation
Involves using different sources of information in order to increase the validity of a study
These sources are likely to be stakeholders in a program - participants, other researchers, program staff, other community members, and so on.
Then we put all data in single framework & apply various statistical tools to find out the dynamic on the market.
During the analysis stage, feedback from the stakeholder groups would be compared to determine areas of agreement as well as areas of divergence
