

Key Insights
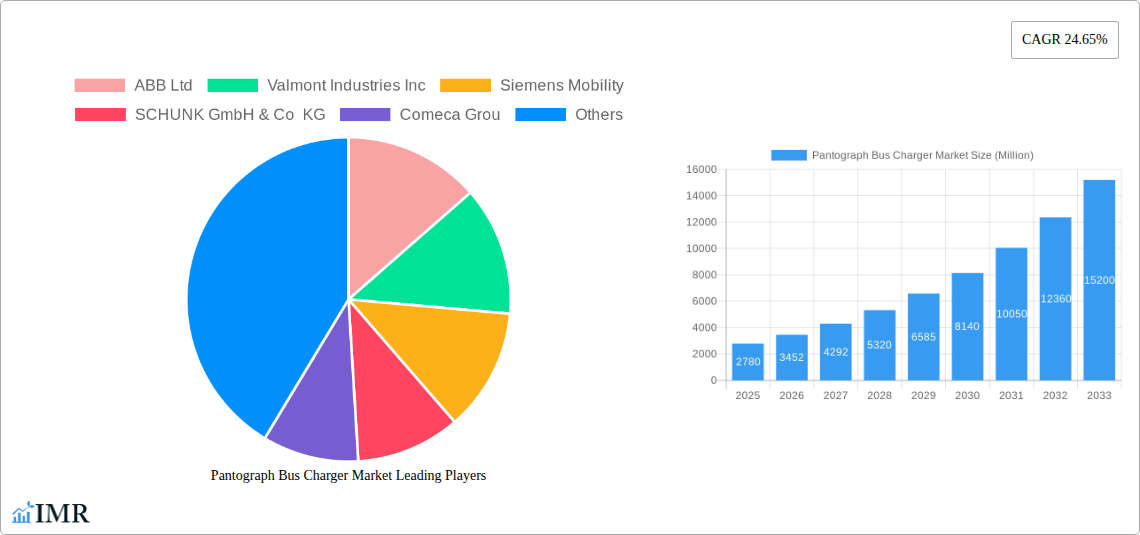
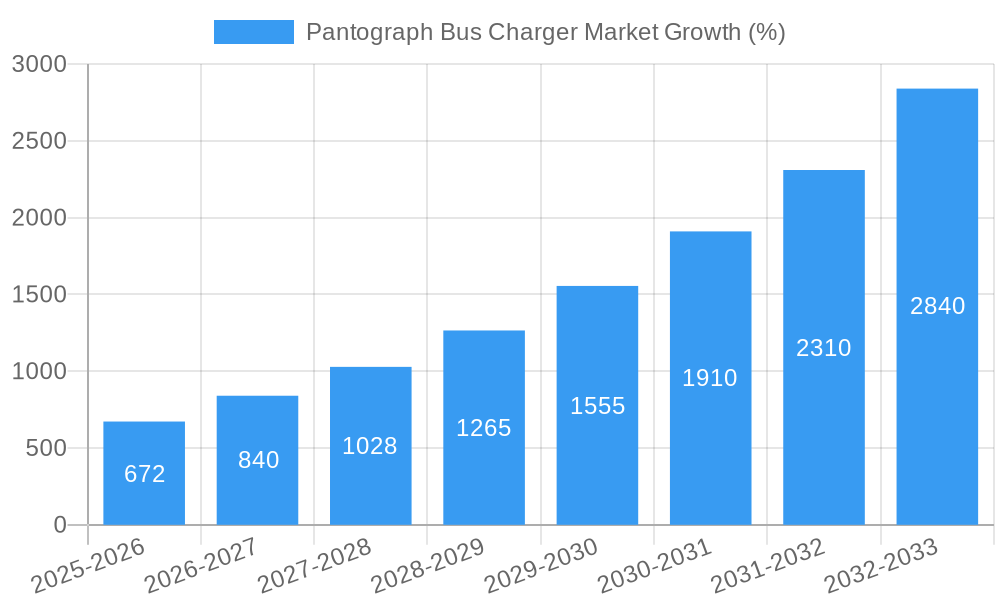
The global Pantograph Bus Charger market is experiencing robust growth, projected to reach \$2.78 billion in 2025 and exhibiting a remarkable Compound Annual Growth Rate (CAGR) of 24.65% from 2025 to 2033. This expansion is primarily driven by the increasing adoption of electric buses globally to combat air pollution and meet sustainability goals. Governments worldwide are actively promoting electric public transport through subsidies, tax incentives, and the development of charging infrastructure, significantly fueling market demand. Furthermore, technological advancements in pantograph systems, leading to enhanced efficiency, reliability, and faster charging speeds, are contributing to market growth. The market segmentation reveals a significant share for off-board top-down pantograph charging infrastructure, reflecting its wider adoption due to established infrastructure and compatibility with existing bus systems. However, ongoing research and development into on-board bottom-up systems, offering improved flexibility and potentially lower infrastructure costs, present a promising avenue for future market expansion. Key players like ABB, Siemens Mobility, and others are actively investing in research and development, as well as strategic partnerships to consolidate their market positions and cater to evolving customer needs.
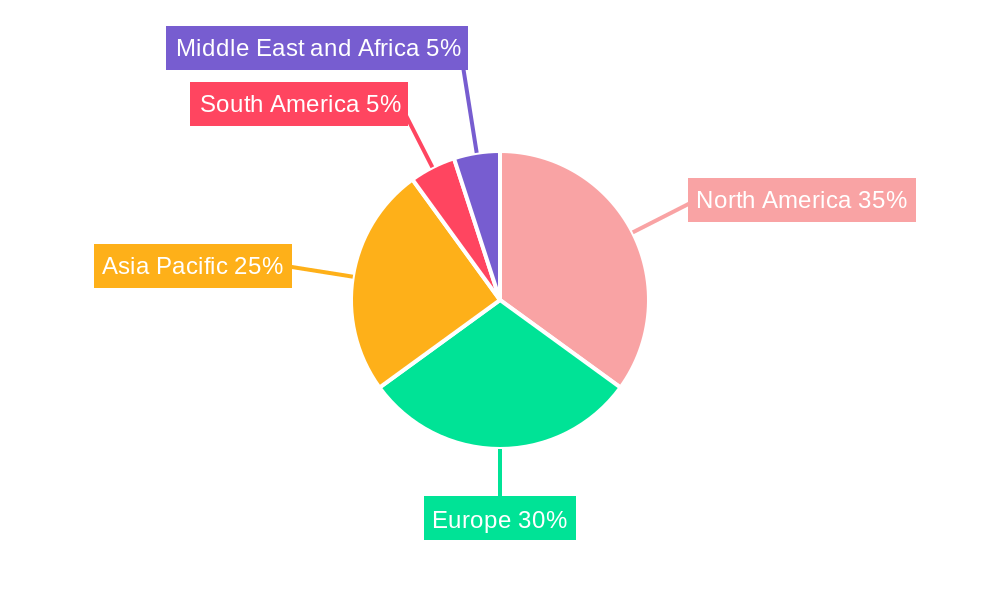
The market's growth trajectory is further influenced by several trends. The increasing focus on smart city initiatives and the integration of intelligent transportation systems are driving the demand for sophisticated charging solutions. The development of interoperable charging standards will further facilitate market expansion. Restraints to growth include high initial investment costs associated with infrastructure deployment and the limited availability of skilled workforce for installation and maintenance. However, these challenges are being addressed through innovative financing models and targeted training programs. The regional breakdown indicates strong growth across North America and Europe, driven by supportive government policies and high adoption rates of electric buses. The Asia Pacific region is also expected to witness substantial growth, fueled by rapid urbanization and increasing investment in public transport infrastructure. The South American and Middle Eastern & African markets, while currently smaller, present significant long-term growth potential as electric bus adoption gains momentum.
Pantograph Bus Charger Market: A Comprehensive Report (2019-2033)
This comprehensive report provides a detailed analysis of the Pantograph Bus Charger Market, encompassing market dynamics, growth trends, regional insights, product landscape, key players, and future outlook. The study period spans from 2019 to 2033, with 2025 serving as the base and estimated year. The report caters to industry professionals, investors, and researchers seeking a thorough understanding of this rapidly evolving sector. The parent market is the Electric Bus Charging Infrastructure market, and the child market is specifically Pantograph Bus Chargers.
Pantograph Bus Charger Market Market Dynamics & Structure
The Pantograph Bus Charger market is experiencing significant growth driven by the global push towards electric public transportation and the need for efficient charging solutions. Market concentration is moderate, with key players like ABB Ltd, Valmont Industries Inc, Siemens Mobility, and SCHUNK GmbH & Co KG holding significant market share, estimated at xx% collectively in 2025. Technological innovation, particularly in faster charging capabilities and enhanced safety features, is a primary growth driver. Stringent emission regulations and government incentives are also pushing the adoption of electric buses and consequently, pantograph chargers.
- Market Concentration: Moderate (xx% held by top 4 players in 2025)
- Technological Innovation: Focus on faster charging (e.g., 450kW options), improved safety, and automation.
- Regulatory Frameworks: Stringent emission norms and government subsidies driving adoption.
- Competitive Substitutes: Alternative charging technologies (e.g., plug-in chargers) pose competition but pantographs offer advantages in speed and efficiency for depot charging.
- End-User Demographics: Primarily public transportation agencies and bus operators in urban areas.
- M&A Trends: A moderate level of M&A activity is expected, driven by companies seeking to expand their product portfolios and geographical reach. An estimated xx M&A deals are predicted between 2025 and 2033.
Pantograph Bus Charger Market Growth Trends & Insights
The global Pantograph Bus Charger market is projected to experience robust growth, with a Compound Annual Growth Rate (CAGR) of xx% during the forecast period (2025-2033). The market size is estimated at xx million units in 2025 and is expected to reach xx million units by 2033. This growth is fueled by increasing electrification of bus fleets globally, expanding urban transportation networks, and the continuous improvement in pantograph charger technology. Market penetration is expected to increase significantly, driven by government initiatives promoting sustainable transportation and the declining cost of electric buses. Technological disruptions, such as advancements in power electronics and battery technologies, are further accelerating market expansion. Consumer behavior is shifting towards eco-friendly transportation options, pushing the demand for efficient and reliable charging infrastructure. The adoption rate of pantograph chargers is expected to grow at a CAGR of xx% over the forecast period, driven by the inherent advantages of this technology in terms of speed, safety, and efficiency compared to alternative charging methods.
Dominant Regions, Countries, or Segments in Pantograph Bus Charger Market
Europe and North America are currently the dominant regions for pantograph bus chargers, driven by early adoption of electric buses and supportive government policies. Within these regions, major cities with extensive public transportation systems show higher market penetration.
By Pcomponent Type: The Hardware segment currently dominates, comprising xx% of the market in 2025, due to the significant cost of physical components. However, the Software segment is expected to witness faster growth, driven by increasing demand for intelligent charging management systems.
By Charging Infrastructure Type: Off-board top-down pantographs hold a larger market share (xx%) than On-Board Bottom-Up Pantographs in 2025, primarily due to established infrastructure and higher charging power capabilities.
By Charging Type: Direct Current Fast Charging is the fastest-growing segment, with a projected CAGR of xx% over the forecast period due to its efficiency advantages.
- Key Drivers (Europe & North America):
- Strong government support and funding for electric bus initiatives.
- Established public transportation networks requiring efficient charging solutions.
- Higher awareness of environmental concerns among consumers.
- Dominance Factors:
- Early adoption of electric bus technologies.
- Robust investment in public transportation infrastructure.
- Favorable regulatory environment.
- Growth Potential: Significant growth is expected in Asia-Pacific, driven by rapid urbanization and increasing government investments in sustainable transportation.
Pantograph Bus Charger Market Product Landscape
Pantograph bus chargers are evolving from simple power transfer devices to sophisticated systems integrating smart charging capabilities, improved safety features, and remote monitoring functionalities. Products now incorporate advanced power electronics, automated charging mechanisms, and data analytics for optimal performance and reduced downtime. Key selling points include fast charging speeds, ease of use, enhanced safety mechanisms, and remote diagnostics. These technological advancements enhance charging efficiency, reduce operational costs, and improve the overall reliability of electric bus fleets.
Key Drivers, Barriers & Challenges in Pantograph Bus Charger Market
Key Drivers:
- Growing adoption of electric buses worldwide due to environmental concerns and government regulations.
- Increasing demand for efficient and fast charging solutions to minimize downtime.
- Technological advancements leading to faster charging speeds and improved safety features.
Challenges & Restraints:
- High initial investment costs associated with installing pantograph charging infrastructure.
- Limited availability of skilled labor for installation and maintenance.
- Potential supply chain disruptions affecting the availability of key components. This has impacted the market by an estimated xx% in 2022.
- Competition from alternative charging technologies.
Emerging Opportunities in Pantograph Bus Charger Market
- Expansion into developing countries with growing public transportation needs.
- Development of wireless charging technologies for greater convenience and flexibility.
- Integration of renewable energy sources for sustainable charging operations.
- Development of smart charging management systems for optimized grid integration and energy efficiency.
Growth Accelerators in the Pantograph Bus Charger Market Industry
The long-term growth of the Pantograph Bus Charger market is strongly linked to continued technological advancements, strategic collaborations between charging infrastructure providers and bus manufacturers, and expansion into new geographical markets. Furthermore, government policies promoting electric mobility and investments in smart city initiatives will significantly accelerate market growth in the coming years. The development of interoperable charging standards and the integration of advanced data analytics for predictive maintenance will also play crucial roles in boosting market expansion.
Key Players Shaping the Pantograph Bus Charger Market Market
- ABB Ltd
- Valmont Industries Inc
- Siemens Mobility
- SCHUNK GmbH & Co KG
- Comeca Grou
- Schunk Transit Systems GmBH
- Wabtech Corporation
- Vector Informatik GmbH
- SETEC Power
Notable Milestones in Pantograph Bus Charger Market Sector
- November 2021: Pilot project launched in Moscow testing bus-down pantograph technology.
- April 2022: TMB (Barcelona) tenders for up to 83 electric buses with pantograph charging.
- April 2022: Grudziądz, Poland orders 17 electric buses with pantograph chargers.
- May 2022: San Diego installs a Schunk SLS 301 series depot charging pantograph system.
- August 2022: First Bus orders 193 electric buses with 150kW/450kW pantograph charging options.
In-Depth Pantograph Bus Charger Market Market Outlook
The future of the Pantograph Bus Charger market is exceptionally promising, driven by the global shift towards sustainable transportation and the inherent advantages of pantograph technology in fast and efficient charging. Strategic partnerships between manufacturers, technology providers, and public transportation authorities will play a key role in shaping the market landscape. Continued innovation in charging technologies, such as wireless charging and improved energy efficiency, will further drive market growth and create new opportunities for players in the sector. The expansion into emerging markets, particularly in Asia and Latin America, presents significant untapped potential for market expansion.
Pantograph Bus Charger Market Segmentation
-
1. Charging Type
- 1.1. Level 1
- 1.2. Level 2
- 1.3. Direct Current Fast Charging
-
2. Pcomponent Type
- 2.1. Hardware
- 2.2. Software
-
3. Charging Infrastructure Type
- 3.1. Off-board top-down pantograph
- 3.2. On-Board Bottom-Up Pantograph
Pantograph Bus Charger Market Segmentation By Geography
-
1. North America
- 1.1. United States
- 1.2. Canada
- 1.3. Rest of North America
-
2. Europe
- 2.1. Germany
- 2.2. United Kingdom
- 2.3. France
- 2.4. Italy
- 2.5. Spain
- 2.6. Rest of Europe
-
3. Asia Pacific
- 3.1. India
- 3.2. China
- 3.3. South Korea
- 3.4. Japan
- 3.5. Rest of Asia Pacific
-
4. South America
- 4.1. Brazil
- 4.2. Aegentina
- 4.3. Rest of the South America
-
5. Middle East and Africa
- 5.1. Saudi Arabia
- 5.2. South Africa
- 5.3. Rest of the Middle East and Africa
Pantograph Bus Charger Market REPORT HIGHLIGHTS
| Aspects | Details |
|---|---|
| Study Period | 2019-2033 |
| Base Year | 2024 |
| Estimated Year | 2025 |
| Forecast Period | 2025-2033 |
| Historical Period | 2019-2024 |
| Growth Rate | CAGR of 24.65% from 2019-2033 |
| Segmentation |
|
Table of Contents
- 1. Introduction
- 1.1. Research Scope
- 1.2. Market Segmentation
- 1.3. Research Methodology
- 1.4. Definitions and Assumptions
- 2. Executive Summary
- 2.1. Introduction
- 3. Market Dynamics
- 3.1. Introduction
- 3.2. Market Drivers
- 3.2.1. Rise in Vehicle Sale
- 3.3. Market Restrains
- 3.3.1. Increase in demand for Electric Vehicles
- 3.4. Market Trends
- 3.4.1. Rising Emphasis of Government on Eco-Friendly Buses
- 4. Market Factor Analysis
- 4.1. Porters Five Forces
- 4.2. Supply/Value Chain
- 4.3. PESTEL analysis
- 4.4. Market Entropy
- 4.5. Patent/Trademark Analysis
- 5. Global Pantograph Bus Charger Market Analysis, Insights and Forecast, 2019-2031
- 5.1. Market Analysis, Insights and Forecast - by Charging Type
- 5.1.1. Level 1
- 5.1.2. Level 2
- 5.1.3. Direct Current Fast Charging
- 5.2. Market Analysis, Insights and Forecast - by Pcomponent Type
- 5.2.1. Hardware
- 5.2.2. Software
- 5.3. Market Analysis, Insights and Forecast - by Charging Infrastructure Type
- 5.3.1. Off-board top-down pantograph
- 5.3.2. On-Board Bottom-Up Pantograph
- 5.4. Market Analysis, Insights and Forecast - by Region
- 5.4.1. North America
- 5.4.2. Europe
- 5.4.3. Asia Pacific
- 5.4.4. South America
- 5.4.5. Middle East and Africa
- 5.1. Market Analysis, Insights and Forecast - by Charging Type
- 6. North America Pantograph Bus Charger Market Analysis, Insights and Forecast, 2019-2031
- 6.1. Market Analysis, Insights and Forecast - by Charging Type
- 6.1.1. Level 1
- 6.1.2. Level 2
- 6.1.3. Direct Current Fast Charging
- 6.2. Market Analysis, Insights and Forecast - by Pcomponent Type
- 6.2.1. Hardware
- 6.2.2. Software
- 6.3. Market Analysis, Insights and Forecast - by Charging Infrastructure Type
- 6.3.1. Off-board top-down pantograph
- 6.3.2. On-Board Bottom-Up Pantograph
- 6.1. Market Analysis, Insights and Forecast - by Charging Type
- 7. Europe Pantograph Bus Charger Market Analysis, Insights and Forecast, 2019-2031
- 7.1. Market Analysis, Insights and Forecast - by Charging Type
- 7.1.1. Level 1
- 7.1.2. Level 2
- 7.1.3. Direct Current Fast Charging
- 7.2. Market Analysis, Insights and Forecast - by Pcomponent Type
- 7.2.1. Hardware
- 7.2.2. Software
- 7.3. Market Analysis, Insights and Forecast - by Charging Infrastructure Type
- 7.3.1. Off-board top-down pantograph
- 7.3.2. On-Board Bottom-Up Pantograph
- 7.1. Market Analysis, Insights and Forecast - by Charging Type
- 8. Asia Pacific Pantograph Bus Charger Market Analysis, Insights and Forecast, 2019-2031
- 8.1. Market Analysis, Insights and Forecast - by Charging Type
- 8.1.1. Level 1
- 8.1.2. Level 2
- 8.1.3. Direct Current Fast Charging
- 8.2. Market Analysis, Insights and Forecast - by Pcomponent Type
- 8.2.1. Hardware
- 8.2.2. Software
- 8.3. Market Analysis, Insights and Forecast - by Charging Infrastructure Type
- 8.3.1. Off-board top-down pantograph
- 8.3.2. On-Board Bottom-Up Pantograph
- 8.1. Market Analysis, Insights and Forecast - by Charging Type
- 9. South America Pantograph Bus Charger Market Analysis, Insights and Forecast, 2019-2031
- 9.1. Market Analysis, Insights and Forecast - by Charging Type
- 9.1.1. Level 1
- 9.1.2. Level 2
- 9.1.3. Direct Current Fast Charging
- 9.2. Market Analysis, Insights and Forecast - by Pcomponent Type
- 9.2.1. Hardware
- 9.2.2. Software
- 9.3. Market Analysis, Insights and Forecast - by Charging Infrastructure Type
- 9.3.1. Off-board top-down pantograph
- 9.3.2. On-Board Bottom-Up Pantograph
- 9.1. Market Analysis, Insights and Forecast - by Charging Type
- 10. Middle East and Africa Pantograph Bus Charger Market Analysis, Insights and Forecast, 2019-2031
- 10.1. Market Analysis, Insights and Forecast - by Charging Type
- 10.1.1. Level 1
- 10.1.2. Level 2
- 10.1.3. Direct Current Fast Charging
- 10.2. Market Analysis, Insights and Forecast - by Pcomponent Type
- 10.2.1. Hardware
- 10.2.2. Software
- 10.3. Market Analysis, Insights and Forecast - by Charging Infrastructure Type
- 10.3.1. Off-board top-down pantograph
- 10.3.2. On-Board Bottom-Up Pantograph
- 10.1. Market Analysis, Insights and Forecast - by Charging Type
- 11. North America Pantograph Bus Charger Market Analysis, Insights and Forecast, 2019-2031
- 11.1. Market Analysis, Insights and Forecast - By Country/Sub-region
- 11.1.1 United States
- 11.1.2 Canada
- 11.1.3 Rest of North America
- 12. Europe Pantograph Bus Charger Market Analysis, Insights and Forecast, 2019-2031
- 12.1. Market Analysis, Insights and Forecast - By Country/Sub-region
- 12.1.1 Germany
- 12.1.2 United Kingdom
- 12.1.3 France
- 12.1.4 Italy
- 12.1.5 Spain
- 12.1.6 Rest of Europe
- 13. Asia Pacific Pantograph Bus Charger Market Analysis, Insights and Forecast, 2019-2031
- 13.1. Market Analysis, Insights and Forecast - By Country/Sub-region
- 13.1.1 India
- 13.1.2 China
- 13.1.3 South Korea
- 13.1.4 Japan
- 13.1.5 Rest of Asia Pacific
- 14. South America Pantograph Bus Charger Market Analysis, Insights and Forecast, 2019-2031
- 14.1. Market Analysis, Insights and Forecast - By Country/Sub-region
- 14.1.1 Brazil
- 14.1.2 Aegentina
- 14.1.3 Rest of the South America
- 15. Middle East and Africa Pantograph Bus Charger Market Analysis, Insights and Forecast, 2019-2031
- 15.1. Market Analysis, Insights and Forecast - By Country/Sub-region
- 15.1.1 Saudi Arabia
- 15.1.2 South Africa
- 15.1.3 Rest of the Middle East and Africa
- 16. Competitive Analysis
- 16.1. Global Market Share Analysis 2024
- 16.2. Company Profiles
- 16.2.1 ABB Ltd
- 16.2.1.1. Overview
- 16.2.1.2. Products
- 16.2.1.3. SWOT Analysis
- 16.2.1.4. Recent Developments
- 16.2.1.5. Financials (Based on Availability)
- 16.2.2 Valmont Industries Inc
- 16.2.2.1. Overview
- 16.2.2.2. Products
- 16.2.2.3. SWOT Analysis
- 16.2.2.4. Recent Developments
- 16.2.2.5. Financials (Based on Availability)
- 16.2.3 Siemens Mobility
- 16.2.3.1. Overview
- 16.2.3.2. Products
- 16.2.3.3. SWOT Analysis
- 16.2.3.4. Recent Developments
- 16.2.3.5. Financials (Based on Availability)
- 16.2.4 SCHUNK GmbH & Co KG
- 16.2.4.1. Overview
- 16.2.4.2. Products
- 16.2.4.3. SWOT Analysis
- 16.2.4.4. Recent Developments
- 16.2.4.5. Financials (Based on Availability)
- 16.2.5 Comeca Grou
- 16.2.5.1. Overview
- 16.2.5.2. Products
- 16.2.5.3. SWOT Analysis
- 16.2.5.4. Recent Developments
- 16.2.5.5. Financials (Based on Availability)
- 16.2.6 Schunk Transit Systems GmBH
- 16.2.6.1. Overview
- 16.2.6.2. Products
- 16.2.6.3. SWOT Analysis
- 16.2.6.4. Recent Developments
- 16.2.6.5. Financials (Based on Availability)
- 16.2.7 Wabtech Corporation
- 16.2.7.1. Overview
- 16.2.7.2. Products
- 16.2.7.3. SWOT Analysis
- 16.2.7.4. Recent Developments
- 16.2.7.5. Financials (Based on Availability)
- 16.2.8 Vector Informatik GmbH
- 16.2.8.1. Overview
- 16.2.8.2. Products
- 16.2.8.3. SWOT Analysis
- 16.2.8.4. Recent Developments
- 16.2.8.5. Financials (Based on Availability)
- 16.2.9 SETEC Power
- 16.2.9.1. Overview
- 16.2.9.2. Products
- 16.2.9.3. SWOT Analysis
- 16.2.9.4. Recent Developments
- 16.2.9.5. Financials (Based on Availability)
- 16.2.1 ABB Ltd
List of Figures
- Figure 1: Global Pantograph Bus Charger Market Revenue Breakdown (Million, %) by Region 2024 & 2032
- Figure 2: North America Pantograph Bus Charger Market Revenue (Million), by Country 2024 & 2032
- Figure 3: North America Pantograph Bus Charger Market Revenue Share (%), by Country 2024 & 2032
- Figure 4: Europe Pantograph Bus Charger Market Revenue (Million), by Country 2024 & 2032
- Figure 5: Europe Pantograph Bus Charger Market Revenue Share (%), by Country 2024 & 2032
- Figure 6: Asia Pacific Pantograph Bus Charger Market Revenue (Million), by Country 2024 & 2032
- Figure 7: Asia Pacific Pantograph Bus Charger Market Revenue Share (%), by Country 2024 & 2032
- Figure 8: South America Pantograph Bus Charger Market Revenue (Million), by Country 2024 & 2032
- Figure 9: South America Pantograph Bus Charger Market Revenue Share (%), by Country 2024 & 2032
- Figure 10: Middle East and Africa Pantograph Bus Charger Market Revenue (Million), by Country 2024 & 2032
- Figure 11: Middle East and Africa Pantograph Bus Charger Market Revenue Share (%), by Country 2024 & 2032
- Figure 12: North America Pantograph Bus Charger Market Revenue (Million), by Charging Type 2024 & 2032
- Figure 13: North America Pantograph Bus Charger Market Revenue Share (%), by Charging Type 2024 & 2032
- Figure 14: North America Pantograph Bus Charger Market Revenue (Million), by Pcomponent Type 2024 & 2032
- Figure 15: North America Pantograph Bus Charger Market Revenue Share (%), by Pcomponent Type 2024 & 2032
- Figure 16: North America Pantograph Bus Charger Market Revenue (Million), by Charging Infrastructure Type 2024 & 2032
- Figure 17: North America Pantograph Bus Charger Market Revenue Share (%), by Charging Infrastructure Type 2024 & 2032
- Figure 18: North America Pantograph Bus Charger Market Revenue (Million), by Country 2024 & 2032
- Figure 19: North America Pantograph Bus Charger Market Revenue Share (%), by Country 2024 & 2032
- Figure 20: Europe Pantograph Bus Charger Market Revenue (Million), by Charging Type 2024 & 2032
- Figure 21: Europe Pantograph Bus Charger Market Revenue Share (%), by Charging Type 2024 & 2032
- Figure 22: Europe Pantograph Bus Charger Market Revenue (Million), by Pcomponent Type 2024 & 2032
- Figure 23: Europe Pantograph Bus Charger Market Revenue Share (%), by Pcomponent Type 2024 & 2032
- Figure 24: Europe Pantograph Bus Charger Market Revenue (Million), by Charging Infrastructure Type 2024 & 2032
- Figure 25: Europe Pantograph Bus Charger Market Revenue Share (%), by Charging Infrastructure Type 2024 & 2032
- Figure 26: Europe Pantograph Bus Charger Market Revenue (Million), by Country 2024 & 2032
- Figure 27: Europe Pantograph Bus Charger Market Revenue Share (%), by Country 2024 & 2032
- Figure 28: Asia Pacific Pantograph Bus Charger Market Revenue (Million), by Charging Type 2024 & 2032
- Figure 29: Asia Pacific Pantograph Bus Charger Market Revenue Share (%), by Charging Type 2024 & 2032
- Figure 30: Asia Pacific Pantograph Bus Charger Market Revenue (Million), by Pcomponent Type 2024 & 2032
- Figure 31: Asia Pacific Pantograph Bus Charger Market Revenue Share (%), by Pcomponent Type 2024 & 2032
- Figure 32: Asia Pacific Pantograph Bus Charger Market Revenue (Million), by Charging Infrastructure Type 2024 & 2032
- Figure 33: Asia Pacific Pantograph Bus Charger Market Revenue Share (%), by Charging Infrastructure Type 2024 & 2032
- Figure 34: Asia Pacific Pantograph Bus Charger Market Revenue (Million), by Country 2024 & 2032
- Figure 35: Asia Pacific Pantograph Bus Charger Market Revenue Share (%), by Country 2024 & 2032
- Figure 36: South America Pantograph Bus Charger Market Revenue (Million), by Charging Type 2024 & 2032
- Figure 37: South America Pantograph Bus Charger Market Revenue Share (%), by Charging Type 2024 & 2032
- Figure 38: South America Pantograph Bus Charger Market Revenue (Million), by Pcomponent Type 2024 & 2032
- Figure 39: South America Pantograph Bus Charger Market Revenue Share (%), by Pcomponent Type 2024 & 2032
- Figure 40: South America Pantograph Bus Charger Market Revenue (Million), by Charging Infrastructure Type 2024 & 2032
- Figure 41: South America Pantograph Bus Charger Market Revenue Share (%), by Charging Infrastructure Type 2024 & 2032
- Figure 42: South America Pantograph Bus Charger Market Revenue (Million), by Country 2024 & 2032
- Figure 43: South America Pantograph Bus Charger Market Revenue Share (%), by Country 2024 & 2032
- Figure 44: Middle East and Africa Pantograph Bus Charger Market Revenue (Million), by Charging Type 2024 & 2032
- Figure 45: Middle East and Africa Pantograph Bus Charger Market Revenue Share (%), by Charging Type 2024 & 2032
- Figure 46: Middle East and Africa Pantograph Bus Charger Market Revenue (Million), by Pcomponent Type 2024 & 2032
- Figure 47: Middle East and Africa Pantograph Bus Charger Market Revenue Share (%), by Pcomponent Type 2024 & 2032
- Figure 48: Middle East and Africa Pantograph Bus Charger Market Revenue (Million), by Charging Infrastructure Type 2024 & 2032
- Figure 49: Middle East and Africa Pantograph Bus Charger Market Revenue Share (%), by Charging Infrastructure Type 2024 & 2032
- Figure 50: Middle East and Africa Pantograph Bus Charger Market Revenue (Million), by Country 2024 & 2032
- Figure 51: Middle East and Africa Pantograph Bus Charger Market Revenue Share (%), by Country 2024 & 2032
List of Tables
- Table 1: Global Pantograph Bus Charger Market Revenue Million Forecast, by Region 2019 & 2032
- Table 2: Global Pantograph Bus Charger Market Revenue Million Forecast, by Charging Type 2019 & 2032
- Table 3: Global Pantograph Bus Charger Market Revenue Million Forecast, by Pcomponent Type 2019 & 2032
- Table 4: Global Pantograph Bus Charger Market Revenue Million Forecast, by Charging Infrastructure Type 2019 & 2032
- Table 5: Global Pantograph Bus Charger Market Revenue Million Forecast, by Region 2019 & 2032
- Table 6: Global Pantograph Bus Charger Market Revenue Million Forecast, by Country 2019 & 2032
- Table 7: United States Pantograph Bus Charger Market Revenue (Million) Forecast, by Application 2019 & 2032
- Table 8: Canada Pantograph Bus Charger Market Revenue (Million) Forecast, by Application 2019 & 2032
- Table 9: Rest of North America Pantograph Bus Charger Market Revenue (Million) Forecast, by Application 2019 & 2032
- Table 10: Global Pantograph Bus Charger Market Revenue Million Forecast, by Country 2019 & 2032
- Table 11: Germany Pantograph Bus Charger Market Revenue (Million) Forecast, by Application 2019 & 2032
- Table 12: United Kingdom Pantograph Bus Charger Market Revenue (Million) Forecast, by Application 2019 & 2032
- Table 13: France Pantograph Bus Charger Market Revenue (Million) Forecast, by Application 2019 & 2032
- Table 14: Italy Pantograph Bus Charger Market Revenue (Million) Forecast, by Application 2019 & 2032
- Table 15: Spain Pantograph Bus Charger Market Revenue (Million) Forecast, by Application 2019 & 2032
- Table 16: Rest of Europe Pantograph Bus Charger Market Revenue (Million) Forecast, by Application 2019 & 2032
- Table 17: Global Pantograph Bus Charger Market Revenue Million Forecast, by Country 2019 & 2032
- Table 18: India Pantograph Bus Charger Market Revenue (Million) Forecast, by Application 2019 & 2032
- Table 19: China Pantograph Bus Charger Market Revenue (Million) Forecast, by Application 2019 & 2032
- Table 20: South Korea Pantograph Bus Charger Market Revenue (Million) Forecast, by Application 2019 & 2032
- Table 21: Japan Pantograph Bus Charger Market Revenue (Million) Forecast, by Application 2019 & 2032
- Table 22: Rest of Asia Pacific Pantograph Bus Charger Market Revenue (Million) Forecast, by Application 2019 & 2032
- Table 23: Global Pantograph Bus Charger Market Revenue Million Forecast, by Country 2019 & 2032
- Table 24: Brazil Pantograph Bus Charger Market Revenue (Million) Forecast, by Application 2019 & 2032
- Table 25: Aegentina Pantograph Bus Charger Market Revenue (Million) Forecast, by Application 2019 & 2032
- Table 26: Rest of the South America Pantograph Bus Charger Market Revenue (Million) Forecast, by Application 2019 & 2032
- Table 27: Global Pantograph Bus Charger Market Revenue Million Forecast, by Country 2019 & 2032
- Table 28: Saudi Arabia Pantograph Bus Charger Market Revenue (Million) Forecast, by Application 2019 & 2032
- Table 29: South Africa Pantograph Bus Charger Market Revenue (Million) Forecast, by Application 2019 & 2032
- Table 30: Rest of the Middle East and Africa Pantograph Bus Charger Market Revenue (Million) Forecast, by Application 2019 & 2032
- Table 31: Global Pantograph Bus Charger Market Revenue Million Forecast, by Charging Type 2019 & 2032
- Table 32: Global Pantograph Bus Charger Market Revenue Million Forecast, by Pcomponent Type 2019 & 2032
- Table 33: Global Pantograph Bus Charger Market Revenue Million Forecast, by Charging Infrastructure Type 2019 & 2032
- Table 34: Global Pantograph Bus Charger Market Revenue Million Forecast, by Country 2019 & 2032
- Table 35: United States Pantograph Bus Charger Market Revenue (Million) Forecast, by Application 2019 & 2032
- Table 36: Canada Pantograph Bus Charger Market Revenue (Million) Forecast, by Application 2019 & 2032
- Table 37: Rest of North America Pantograph Bus Charger Market Revenue (Million) Forecast, by Application 2019 & 2032
- Table 38: Global Pantograph Bus Charger Market Revenue Million Forecast, by Charging Type 2019 & 2032
- Table 39: Global Pantograph Bus Charger Market Revenue Million Forecast, by Pcomponent Type 2019 & 2032
- Table 40: Global Pantograph Bus Charger Market Revenue Million Forecast, by Charging Infrastructure Type 2019 & 2032
- Table 41: Global Pantograph Bus Charger Market Revenue Million Forecast, by Country 2019 & 2032
- Table 42: Germany Pantograph Bus Charger Market Revenue (Million) Forecast, by Application 2019 & 2032
- Table 43: United Kingdom Pantograph Bus Charger Market Revenue (Million) Forecast, by Application 2019 & 2032
- Table 44: France Pantograph Bus Charger Market Revenue (Million) Forecast, by Application 2019 & 2032
- Table 45: Italy Pantograph Bus Charger Market Revenue (Million) Forecast, by Application 2019 & 2032
- Table 46: Spain Pantograph Bus Charger Market Revenue (Million) Forecast, by Application 2019 & 2032
- Table 47: Rest of Europe Pantograph Bus Charger Market Revenue (Million) Forecast, by Application 2019 & 2032
- Table 48: Global Pantograph Bus Charger Market Revenue Million Forecast, by Charging Type 2019 & 2032
- Table 49: Global Pantograph Bus Charger Market Revenue Million Forecast, by Pcomponent Type 2019 & 2032
- Table 50: Global Pantograph Bus Charger Market Revenue Million Forecast, by Charging Infrastructure Type 2019 & 2032
- Table 51: Global Pantograph Bus Charger Market Revenue Million Forecast, by Country 2019 & 2032
- Table 52: India Pantograph Bus Charger Market Revenue (Million) Forecast, by Application 2019 & 2032
- Table 53: China Pantograph Bus Charger Market Revenue (Million) Forecast, by Application 2019 & 2032
- Table 54: South Korea Pantograph Bus Charger Market Revenue (Million) Forecast, by Application 2019 & 2032
- Table 55: Japan Pantograph Bus Charger Market Revenue (Million) Forecast, by Application 2019 & 2032
- Table 56: Rest of Asia Pacific Pantograph Bus Charger Market Revenue (Million) Forecast, by Application 2019 & 2032
- Table 57: Global Pantograph Bus Charger Market Revenue Million Forecast, by Charging Type 2019 & 2032
- Table 58: Global Pantograph Bus Charger Market Revenue Million Forecast, by Pcomponent Type 2019 & 2032
- Table 59: Global Pantograph Bus Charger Market Revenue Million Forecast, by Charging Infrastructure Type 2019 & 2032
- Table 60: Global Pantograph Bus Charger Market Revenue Million Forecast, by Country 2019 & 2032
- Table 61: Brazil Pantograph Bus Charger Market Revenue (Million) Forecast, by Application 2019 & 2032
- Table 62: Aegentina Pantograph Bus Charger Market Revenue (Million) Forecast, by Application 2019 & 2032
- Table 63: Rest of the South America Pantograph Bus Charger Market Revenue (Million) Forecast, by Application 2019 & 2032
- Table 64: Global Pantograph Bus Charger Market Revenue Million Forecast, by Charging Type 2019 & 2032
- Table 65: Global Pantograph Bus Charger Market Revenue Million Forecast, by Pcomponent Type 2019 & 2032
- Table 66: Global Pantograph Bus Charger Market Revenue Million Forecast, by Charging Infrastructure Type 2019 & 2032
- Table 67: Global Pantograph Bus Charger Market Revenue Million Forecast, by Country 2019 & 2032
- Table 68: Saudi Arabia Pantograph Bus Charger Market Revenue (Million) Forecast, by Application 2019 & 2032
- Table 69: South Africa Pantograph Bus Charger Market Revenue (Million) Forecast, by Application 2019 & 2032
- Table 70: Rest of the Middle East and Africa Pantograph Bus Charger Market Revenue (Million) Forecast, by Application 2019 & 2032
Frequently Asked Questions
1. What is the projected Compound Annual Growth Rate (CAGR) of the Pantograph Bus Charger Market?
The projected CAGR is approximately 24.65%.
2. Which companies are prominent players in the Pantograph Bus Charger Market?
Key companies in the market include ABB Ltd, Valmont Industries Inc, Siemens Mobility, SCHUNK GmbH & Co KG, Comeca Grou, Schunk Transit Systems GmBH, Wabtech Corporation, Vector Informatik GmbH, SETEC Power.
3. What are the main segments of the Pantograph Bus Charger Market?
The market segments include Charging Type, Pcomponent Type, Charging Infrastructure Type.
4. Can you provide details about the market size?
The market size is estimated to be USD 2.78 Million as of 2022.
5. What are some drivers contributing to market growth?
Rise in Vehicle Sale.
6. What are the notable trends driving market growth?
Rising Emphasis of Government on Eco-Friendly Buses.
7. Are there any restraints impacting market growth?
Increase in demand for Electric Vehicles.
8. Can you provide examples of recent developments in the market?
August 2022: British bus company First Bus ordered 193 electric buses worth GBP 81 million (~USD 96.4 million) from Northern Irish bus manufacturer Wrightbus. Furthermore, the company initially specifies the DC charging power at 150 kW and optional opportunity charging at 450 kW through pantograph options.
9. What pricing options are available for accessing the report?
Pricing options include single-user, multi-user, and enterprise licenses priced at USD 4750, USD 5250, and USD 8750 respectively.
10. Is the market size provided in terms of value or volume?
The market size is provided in terms of value, measured in Million.
11. Are there any specific market keywords associated with the report?
Yes, the market keyword associated with the report is "Pantograph Bus Charger Market," which aids in identifying and referencing the specific market segment covered.
12. How do I determine which pricing option suits my needs best?
The pricing options vary based on user requirements and access needs. Individual users may opt for single-user licenses, while businesses requiring broader access may choose multi-user or enterprise licenses for cost-effective access to the report.
13. Are there any additional resources or data provided in the Pantograph Bus Charger Market report?
While the report offers comprehensive insights, it's advisable to review the specific contents or supplementary materials provided to ascertain if additional resources or data are available.
14. How can I stay updated on further developments or reports in the Pantograph Bus Charger Market?
To stay informed about further developments, trends, and reports in the Pantograph Bus Charger Market, consider subscribing to industry newsletters, following relevant companies and organizations, or regularly checking reputable industry news sources and publications.
Methodology
Step 1 - Identification of Relevant Samples Size from Population Database


Step 2 - Approaches for Defining Global Market Size (Value, Volume* & Price*)

Note*: In applicable scenarios
Step 3 - Data Sources
Primary Research
- Web Analytics
- Survey Reports
- Research Institute
- Latest Research Reports
- Opinion Leaders
Secondary Research
- Annual Reports
- White Paper
- Latest Press Release
- Industry Association
- Paid Database
- Investor Presentations

Step 4 - Data Triangulation
Involves using different sources of information in order to increase the validity of a study
These sources are likely to be stakeholders in a program - participants, other researchers, program staff, other community members, and so on.
Then we put all data in single framework & apply various statistical tools to find out the dynamic on the market.
During the analysis stage, feedback from the stakeholder groups would be compared to determine areas of agreement as well as areas of divergence
