

Key Insights
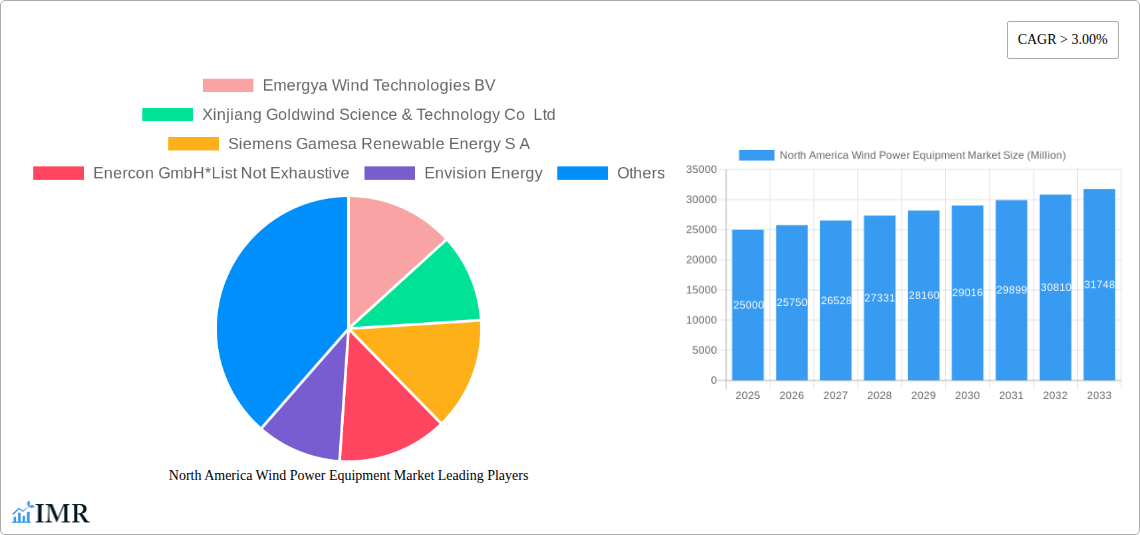
The North American wind power equipment market is experiencing robust growth, driven by increasing demand for renewable energy sources, supportive government policies promoting clean energy adoption, and advancements in wind turbine technology leading to higher efficiency and lower costs. The market, which includes onshore and offshore wind turbine components such as rotors/blades, towers, gearboxes, generators, and other ancillary equipment, is projected to maintain a Compound Annual Growth Rate (CAGR) exceeding 3% from 2025 to 2033. Significant investments in renewable energy infrastructure, particularly in the United States, Canada, and Mexico, are fueling this expansion. The onshore segment currently holds the largest market share due to established infrastructure and lower initial investment costs compared to offshore projects. However, the offshore segment is expected to witness accelerated growth due to the vast untapped potential of offshore wind resources, particularly along the Atlantic and Pacific coasts. This growth will be further propelled by technological breakthroughs enabling the construction of larger and more efficient offshore wind turbines capable of operating in deeper waters. Leading players like Vestas, Siemens Gamesa, General Electric, and others are strategically positioning themselves to capitalize on this burgeoning market by investing in research and development, expanding manufacturing capacities, and securing key project contracts.
While the market faces constraints such as land availability for onshore projects, permitting complexities, and the fluctuating costs of raw materials (steel, rare earth elements), these challenges are being addressed through innovative solutions, improved project planning, and optimized supply chain management. The industry is also actively exploring strategies to minimize environmental impact and ensure responsible sourcing of materials. The competitive landscape is dynamic with a mix of established global players and emerging regional companies vying for market share. This leads to continuous technological innovation and competitive pricing, ultimately benefiting consumers and further driving market expansion. The continued focus on reducing the levelized cost of energy (LCOE) for wind power, combined with supportive policy frameworks, ensures a positive outlook for the North American wind power equipment market in the coming years.
North America Wind Power Equipment Market: A Comprehensive Report (2019-2033)
This in-depth report provides a comprehensive analysis of the North America wind power equipment market, encompassing market dynamics, growth trends, regional insights, and key player strategies. The study period covers 2019-2033, with a base year of 2025 and a forecast period of 2025-2033. This report is essential for industry professionals, investors, and strategic decision-makers seeking a clear understanding of this rapidly evolving market. The market is segmented by location (onshore, offshore) and equipment type (rotor/blade, tower, gearbox, generator, other equipment types).
North America Wind Power Equipment Market Dynamics & Structure
The North American wind power equipment market is characterized by a moderately concentrated landscape, with a few major players holding significant market share. However, the market is also witnessing the emergence of several innovative companies, driving competition and technological advancements. The market size in 2025 is estimated at xx Million units.
- Market Concentration: The top five players hold an estimated xx% market share in 2025. This concentration is expected to shift slightly by 2033 due to new entrants and technological disruptions.
- Technological Innovation: Advancements in blade design, turbine efficiency, and smart grid integration are key drivers of market growth. However, challenges exist in scaling up innovative technologies and reducing manufacturing costs.
- Regulatory Framework: Government policies promoting renewable energy, such as tax credits and subsidies, play a vital role in shaping market dynamics. Furthermore, fluctuating regulatory landscapes across different states and provinces present both opportunities and challenges.
- Competitive Product Substitutes: While wind power faces competition from other renewable sources (solar, hydro), its cost competitiveness and scalability contribute to sustained growth. The market also faces pressure from fossil fuel alternatives, though this is predicted to decrease over the forecast period.
- End-User Demographics: The primary end-users are independent power producers (IPPs), utilities, and energy companies. The growth of distributed generation is also driving demand for smaller-scale wind turbines.
- M&A Trends: The past five years have witnessed xx M&A deals in the North American wind power equipment sector. Consolidation and strategic partnerships are likely to increase as companies strive to improve their technological capabilities and market reach.
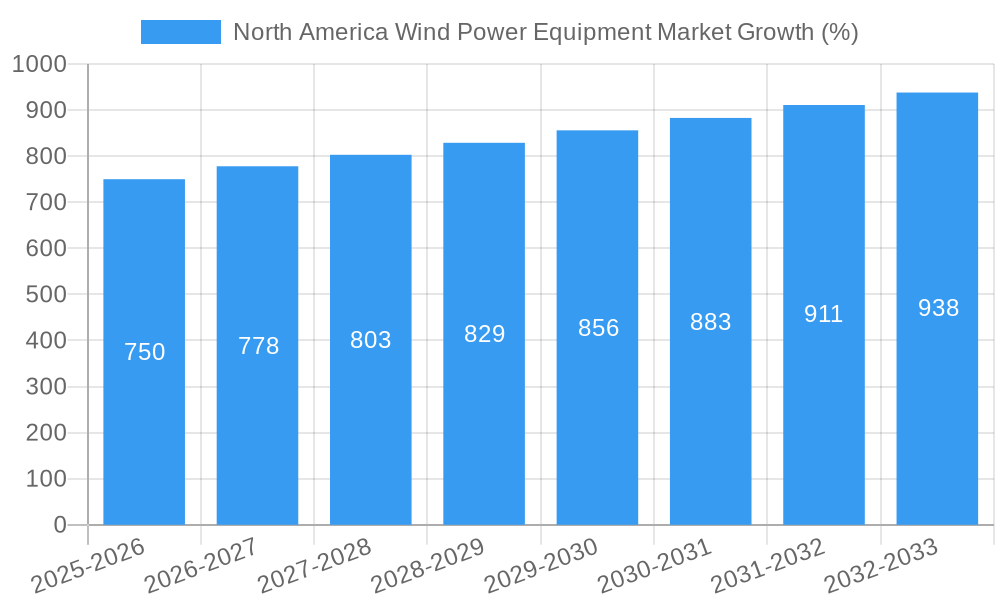
North America Wind Power Equipment Market Growth Trends & Insights
The North America wind power equipment market exhibits robust growth potential, driven by increasing demand for renewable energy, favorable government policies, and decreasing equipment costs. The historical period (2019-2024) showed a CAGR of xx%, while the forecast period (2025-2033) is projected to experience a CAGR of xx%. This growth is attributed to several factors:
- Market Size Evolution: The market size is expected to reach xx Million units by 2033, fueled by a steady increase in wind energy capacity additions.
- Adoption Rates: The adoption of wind power is expected to accelerate due to improvements in technology, cost reductions, and increasing awareness of climate change. Offshore wind projects will drive significant growth in the latter half of the forecast period.
- Technological Disruptions: The integration of advanced technologies like artificial intelligence and machine learning is improving turbine efficiency and operational reliability, while innovations in floating offshore wind foundation designs are unlocking new deployment possibilities.
- Consumer Behavior Shifts: Growing consumer demand for sustainable energy and corporate sustainability goals are driving investments in renewable energy projects. There is a discernible shift toward environmentally conscious consumption habits.
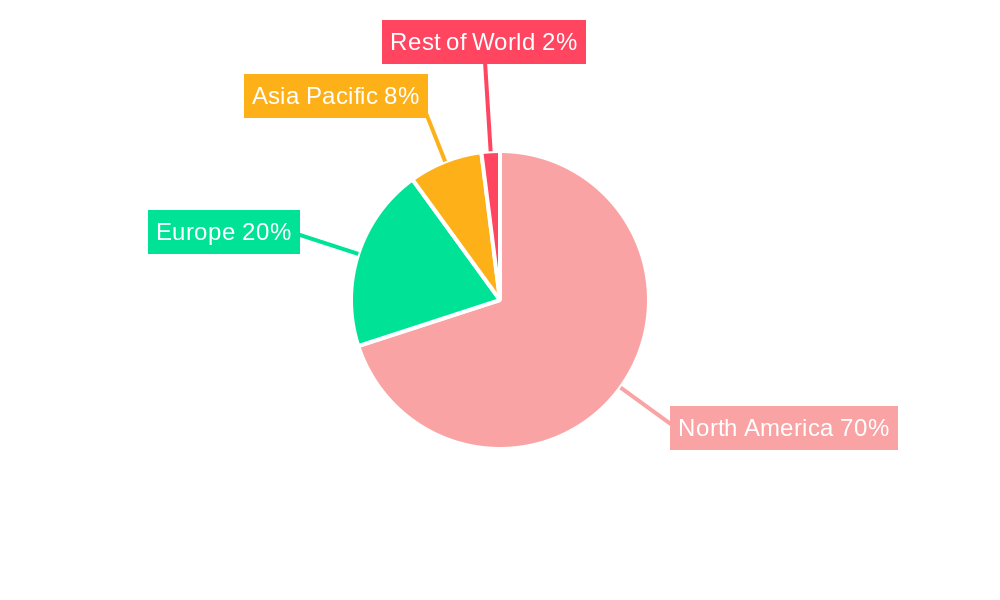
Dominant Regions, Countries, or Segments in North America Wind Power Equipment Market
The United States dominates the North American wind power equipment market, with xx% market share in 2025. Significant growth is also anticipated in Canada. Onshore wind currently represents a larger segment, but offshore wind projects are expected to drive substantial growth in the forecast period.
- United States: Strong government support, a large land area suitable for wind farms, and a well-developed power grid have propelled the US to the forefront of the market.
- Canada: Significant investments in renewable energy, particularly in Quebec and Ontario, contribute to Canada’s strong market position. Government incentives and a commitment to carbon reduction are key drivers.
- Onshore Wind: The mature onshore wind segment is set to continue growing, particularly in regions with abundant wind resources. However, land availability and permitting processes are potential challenges.
- Offshore Wind: Offshore wind holds enormous growth potential due to the vast untapped resources in coastal waters. However, higher development costs and technological complexities are primary barriers.
- Equipment Type: The Rotor/Blade segment holds the largest market share followed by Towers and Generators. This reflects the importance of these components to overall turbine performance and cost.
North America Wind Power Equipment Market Product Landscape
The North American wind power equipment market is characterized by ongoing product innovation focused on improving turbine efficiency, durability, and cost-effectiveness. New developments include advanced blade designs, larger turbine capacities, and more sophisticated control systems. These innovations enhance performance metrics such as energy output, operational life, and reduced maintenance needs, all of which lead to increased competitiveness and value propositions for both manufacturers and customers.
Key Drivers, Barriers & Challenges in North America Wind Power Equipment Market
Key Drivers:
- Government Policies: Incentives and regulations promoting renewable energy deployment significantly boost market growth.
- Falling Equipment Costs: Technological advancements have reduced the cost of wind power equipment, making it more competitive.
- Growing Demand for Renewable Energy: Increasing concerns about climate change and energy security are driving a shift toward sustainable energy sources.
Key Barriers and Challenges:
- Supply Chain Disruptions: Global supply chain constraints can lead to delays and increased costs in project development. This has caused a projected xx% increase in costs over the past three years.
- Regulatory Hurdles: Complex permitting processes and regulatory uncertainty can slow down project implementation and hinder market growth.
- Intermittency and Grid Integration: The intermittent nature of wind power necessitates robust grid infrastructure to ensure stable electricity supply. This requires significant investment and upgrades to the existing infrastructure.
Emerging Opportunities in North America Wind Power Equipment Market
- Offshore Wind Development: Untapped offshore wind resources present significant growth opportunities.
- Hybrid Energy Projects: Combining wind power with other renewable energy sources (solar, storage) can enhance reliability and efficiency.
- Smart Grid Integration: Advanced grid management systems can optimize wind power integration and improve grid stability.
Growth Accelerators in the North America Wind Power Equipment Market Industry
Technological breakthroughs in turbine design, material science, and energy storage are key growth catalysts. Strategic partnerships between equipment manufacturers, developers, and utilities foster efficient project execution and accelerate market penetration. The expanding deployment of floating offshore wind farms and the increasing integration of wind energy into smart grids further enhance market expansion opportunities.
Key Players Shaping the North America Wind Power Equipment Market Market
- Emergya Wind Technologies BV
- Xinjiang Goldwind Science & Technology Co Ltd
- Siemens Gamesa Renewable Energy S A
- Enercon GmbH
- Envision Energy
- Acciona S A
- Vestas Wind Systems AS
- General Electric Company
- Nordex SE
Notable Milestones in North America Wind Power Equipment Market Sector
- November 2022: TPI Composites, Inc. and GE Renewable Energy signed a ten-year lease extension agreement for a rotor blade manufacturing facility, boosting domestic production capabilities.
- May 2022: BW Ideol, EDF Renewables, and Maple Power collaborated on floating foundation designs for a significant offshore wind tender, driving innovation in offshore wind technology.
- April 2022: Boralex, Énergir, and Hydro-Québec partnered to develop three 400 MW wind projects in Quebec, showcasing collaborative efforts in expanding wind energy capacity.
In-Depth North America Wind Power Equipment Market Outlook
The North American wind power equipment market is poised for substantial growth over the forecast period, driven by favorable policy environments, technological advancements, and rising demand for clean energy. Strategic partnerships, innovative product developments, and the expansion of offshore wind capacity are poised to unlock significant opportunities for market players. This robust growth trajectory presents lucrative opportunities for companies to establish a strong foothold in this dynamic market segment and capture significant market share. The market is projected to create xx million new jobs by 2033.
North America Wind Power Equipment Market Segmentation
-
1. Location
- 1.1. Onshore
- 1.2. Offshore
-
2. Equipment Type
- 2.1. Rotor/Blade
- 2.2. Tower
- 2.3. Gearbox
- 2.4. Generator
- 2.5. Other Equipment Types
-
3. Geography
- 3.1. United States
- 3.2. Canada
- 3.3. Rest of North America
North America Wind Power Equipment Market Segmentation By Geography
- 1. United States
- 2. Canada
- 3. Rest of North America
North America Wind Power Equipment Market REPORT HIGHLIGHTS
| Aspects | Details |
|---|---|
| Study Period | 2019-2033 |
| Base Year | 2024 |
| Estimated Year | 2025 |
| Forecast Period | 2025-2033 |
| Historical Period | 2019-2024 |
| Growth Rate | CAGR of > 3.00% from 2019-2033 |
| Segmentation |
|
Table of Contents
- 1. Introduction
- 1.1. Research Scope
- 1.2. Market Segmentation
- 1.3. Research Methodology
- 1.4. Definitions and Assumptions
- 2. Executive Summary
- 2.1. Introduction
- 3. Market Dynamics
- 3.1. Introduction
- 3.2. Market Drivers
- 3.2.1. 4.; Rising Demand for Renewable Energy4.; Decreasing Cost per Kilowatt of Electricity Generated Through Wind Energy Sources
- 3.3. Market Restrains
- 3.3.1. 4.; Increasing Installation of Other Renewable Sources Such as Solar Energy
- 3.4. Market Trends
- 3.4.1. Onshore Segment to Dominate the Market
- 4. Market Factor Analysis
- 4.1. Porters Five Forces
- 4.2. Supply/Value Chain
- 4.3. PESTEL analysis
- 4.4. Market Entropy
- 4.5. Patent/Trademark Analysis
- 5. North America Wind Power Equipment Market Analysis, Insights and Forecast, 2019-2031
- 5.1. Market Analysis, Insights and Forecast - by Location
- 5.1.1. Onshore
- 5.1.2. Offshore
- 5.2. Market Analysis, Insights and Forecast - by Equipment Type
- 5.2.1. Rotor/Blade
- 5.2.2. Tower
- 5.2.3. Gearbox
- 5.2.4. Generator
- 5.2.5. Other Equipment Types
- 5.3. Market Analysis, Insights and Forecast - by Geography
- 5.3.1. United States
- 5.3.2. Canada
- 5.3.3. Rest of North America
- 5.4. Market Analysis, Insights and Forecast - by Region
- 5.4.1. United States
- 5.4.2. Canada
- 5.4.3. Rest of North America
- 5.1. Market Analysis, Insights and Forecast - by Location
- 6. United States North America Wind Power Equipment Market Analysis, Insights and Forecast, 2019-2031
- 6.1. Market Analysis, Insights and Forecast - by Location
- 6.1.1. Onshore
- 6.1.2. Offshore
- 6.2. Market Analysis, Insights and Forecast - by Equipment Type
- 6.2.1. Rotor/Blade
- 6.2.2. Tower
- 6.2.3. Gearbox
- 6.2.4. Generator
- 6.2.5. Other Equipment Types
- 6.3. Market Analysis, Insights and Forecast - by Geography
- 6.3.1. United States
- 6.3.2. Canada
- 6.3.3. Rest of North America
- 6.1. Market Analysis, Insights and Forecast - by Location
- 7. Canada North America Wind Power Equipment Market Analysis, Insights and Forecast, 2019-2031
- 7.1. Market Analysis, Insights and Forecast - by Location
- 7.1.1. Onshore
- 7.1.2. Offshore
- 7.2. Market Analysis, Insights and Forecast - by Equipment Type
- 7.2.1. Rotor/Blade
- 7.2.2. Tower
- 7.2.3. Gearbox
- 7.2.4. Generator
- 7.2.5. Other Equipment Types
- 7.3. Market Analysis, Insights and Forecast - by Geography
- 7.3.1. United States
- 7.3.2. Canada
- 7.3.3. Rest of North America
- 7.1. Market Analysis, Insights and Forecast - by Location
- 8. Rest of North America North America Wind Power Equipment Market Analysis, Insights and Forecast, 2019-2031
- 8.1. Market Analysis, Insights and Forecast - by Location
- 8.1.1. Onshore
- 8.1.2. Offshore
- 8.2. Market Analysis, Insights and Forecast - by Equipment Type
- 8.2.1. Rotor/Blade
- 8.2.2. Tower
- 8.2.3. Gearbox
- 8.2.4. Generator
- 8.2.5. Other Equipment Types
- 8.3. Market Analysis, Insights and Forecast - by Geography
- 8.3.1. United States
- 8.3.2. Canada
- 8.3.3. Rest of North America
- 8.1. Market Analysis, Insights and Forecast - by Location
- 9. United States North America Wind Power Equipment Market Analysis, Insights and Forecast, 2019-2031
- 10. Canada North America Wind Power Equipment Market Analysis, Insights and Forecast, 2019-2031
- 11. Mexico North America Wind Power Equipment Market Analysis, Insights and Forecast, 2019-2031
- 12. Rest of North America North America Wind Power Equipment Market Analysis, Insights and Forecast, 2019-2031
- 13. Competitive Analysis
- 13.1. Market Share Analysis 2024
- 13.2. Company Profiles
- 13.2.1 Emergya Wind Technologies BV
- 13.2.1.1. Overview
- 13.2.1.2. Products
- 13.2.1.3. SWOT Analysis
- 13.2.1.4. Recent Developments
- 13.2.1.5. Financials (Based on Availability)
- 13.2.2 Xinjiang Goldwind Science & Technology Co Ltd
- 13.2.2.1. Overview
- 13.2.2.2. Products
- 13.2.2.3. SWOT Analysis
- 13.2.2.4. Recent Developments
- 13.2.2.5. Financials (Based on Availability)
- 13.2.3 Siemens Gamesa Renewable Energy S A
- 13.2.3.1. Overview
- 13.2.3.2. Products
- 13.2.3.3. SWOT Analysis
- 13.2.3.4. Recent Developments
- 13.2.3.5. Financials (Based on Availability)
- 13.2.4 Enercon GmbH*List Not Exhaustive
- 13.2.4.1. Overview
- 13.2.4.2. Products
- 13.2.4.3. SWOT Analysis
- 13.2.4.4. Recent Developments
- 13.2.4.5. Financials (Based on Availability)
- 13.2.5 Envision Energy
- 13.2.5.1. Overview
- 13.2.5.2. Products
- 13.2.5.3. SWOT Analysis
- 13.2.5.4. Recent Developments
- 13.2.5.5. Financials (Based on Availability)
- 13.2.6 Acciona S A
- 13.2.6.1. Overview
- 13.2.6.2. Products
- 13.2.6.3. SWOT Analysis
- 13.2.6.4. Recent Developments
- 13.2.6.5. Financials (Based on Availability)
- 13.2.7 Vestas Wind Systems AS
- 13.2.7.1. Overview
- 13.2.7.2. Products
- 13.2.7.3. SWOT Analysis
- 13.2.7.4. Recent Developments
- 13.2.7.5. Financials (Based on Availability)
- 13.2.8 General Electric Company
- 13.2.8.1. Overview
- 13.2.8.2. Products
- 13.2.8.3. SWOT Analysis
- 13.2.8.4. Recent Developments
- 13.2.8.5. Financials (Based on Availability)
- 13.2.9 Nordex SE
- 13.2.9.1. Overview
- 13.2.9.2. Products
- 13.2.9.3. SWOT Analysis
- 13.2.9.4. Recent Developments
- 13.2.9.5. Financials (Based on Availability)
- 13.2.1 Emergya Wind Technologies BV
List of Figures
- Figure 1: North America Wind Power Equipment Market Revenue Breakdown (Million, %) by Product 2024 & 2032
- Figure 2: North America Wind Power Equipment Market Share (%) by Company 2024
List of Tables
- Table 1: North America Wind Power Equipment Market Revenue Million Forecast, by Region 2019 & 2032
- Table 2: North America Wind Power Equipment Market Volume K Unit Forecast, by Region 2019 & 2032
- Table 3: North America Wind Power Equipment Market Revenue Million Forecast, by Location 2019 & 2032
- Table 4: North America Wind Power Equipment Market Volume K Unit Forecast, by Location 2019 & 2032
- Table 5: North America Wind Power Equipment Market Revenue Million Forecast, by Equipment Type 2019 & 2032
- Table 6: North America Wind Power Equipment Market Volume K Unit Forecast, by Equipment Type 2019 & 2032
- Table 7: North America Wind Power Equipment Market Revenue Million Forecast, by Geography 2019 & 2032
- Table 8: North America Wind Power Equipment Market Volume K Unit Forecast, by Geography 2019 & 2032
- Table 9: North America Wind Power Equipment Market Revenue Million Forecast, by Region 2019 & 2032
- Table 10: North America Wind Power Equipment Market Volume K Unit Forecast, by Region 2019 & 2032
- Table 11: North America Wind Power Equipment Market Revenue Million Forecast, by Country 2019 & 2032
- Table 12: North America Wind Power Equipment Market Volume K Unit Forecast, by Country 2019 & 2032
- Table 13: United States North America Wind Power Equipment Market Revenue (Million) Forecast, by Application 2019 & 2032
- Table 14: United States North America Wind Power Equipment Market Volume (K Unit) Forecast, by Application 2019 & 2032
- Table 15: Canada North America Wind Power Equipment Market Revenue (Million) Forecast, by Application 2019 & 2032
- Table 16: Canada North America Wind Power Equipment Market Volume (K Unit) Forecast, by Application 2019 & 2032
- Table 17: Mexico North America Wind Power Equipment Market Revenue (Million) Forecast, by Application 2019 & 2032
- Table 18: Mexico North America Wind Power Equipment Market Volume (K Unit) Forecast, by Application 2019 & 2032
- Table 19: Rest of North America North America Wind Power Equipment Market Revenue (Million) Forecast, by Application 2019 & 2032
- Table 20: Rest of North America North America Wind Power Equipment Market Volume (K Unit) Forecast, by Application 2019 & 2032
- Table 21: North America Wind Power Equipment Market Revenue Million Forecast, by Location 2019 & 2032
- Table 22: North America Wind Power Equipment Market Volume K Unit Forecast, by Location 2019 & 2032
- Table 23: North America Wind Power Equipment Market Revenue Million Forecast, by Equipment Type 2019 & 2032
- Table 24: North America Wind Power Equipment Market Volume K Unit Forecast, by Equipment Type 2019 & 2032
- Table 25: North America Wind Power Equipment Market Revenue Million Forecast, by Geography 2019 & 2032
- Table 26: North America Wind Power Equipment Market Volume K Unit Forecast, by Geography 2019 & 2032
- Table 27: North America Wind Power Equipment Market Revenue Million Forecast, by Country 2019 & 2032
- Table 28: North America Wind Power Equipment Market Volume K Unit Forecast, by Country 2019 & 2032
- Table 29: North America Wind Power Equipment Market Revenue Million Forecast, by Location 2019 & 2032
- Table 30: North America Wind Power Equipment Market Volume K Unit Forecast, by Location 2019 & 2032
- Table 31: North America Wind Power Equipment Market Revenue Million Forecast, by Equipment Type 2019 & 2032
- Table 32: North America Wind Power Equipment Market Volume K Unit Forecast, by Equipment Type 2019 & 2032
- Table 33: North America Wind Power Equipment Market Revenue Million Forecast, by Geography 2019 & 2032
- Table 34: North America Wind Power Equipment Market Volume K Unit Forecast, by Geography 2019 & 2032
- Table 35: North America Wind Power Equipment Market Revenue Million Forecast, by Country 2019 & 2032
- Table 36: North America Wind Power Equipment Market Volume K Unit Forecast, by Country 2019 & 2032
- Table 37: North America Wind Power Equipment Market Revenue Million Forecast, by Location 2019 & 2032
- Table 38: North America Wind Power Equipment Market Volume K Unit Forecast, by Location 2019 & 2032
- Table 39: North America Wind Power Equipment Market Revenue Million Forecast, by Equipment Type 2019 & 2032
- Table 40: North America Wind Power Equipment Market Volume K Unit Forecast, by Equipment Type 2019 & 2032
- Table 41: North America Wind Power Equipment Market Revenue Million Forecast, by Geography 2019 & 2032
- Table 42: North America Wind Power Equipment Market Volume K Unit Forecast, by Geography 2019 & 2032
- Table 43: North America Wind Power Equipment Market Revenue Million Forecast, by Country 2019 & 2032
- Table 44: North America Wind Power Equipment Market Volume K Unit Forecast, by Country 2019 & 2032
Frequently Asked Questions
1. What is the projected Compound Annual Growth Rate (CAGR) of the North America Wind Power Equipment Market?
The projected CAGR is approximately > 3.00%.
2. Which companies are prominent players in the North America Wind Power Equipment Market?
Key companies in the market include Emergya Wind Technologies BV, Xinjiang Goldwind Science & Technology Co Ltd, Siemens Gamesa Renewable Energy S A, Enercon GmbH*List Not Exhaustive, Envision Energy, Acciona S A, Vestas Wind Systems AS, General Electric Company, Nordex SE.
3. What are the main segments of the North America Wind Power Equipment Market?
The market segments include Location, Equipment Type, Geography.
4. Can you provide details about the market size?
The market size is estimated to be USD XX Million as of 2022.
5. What are some drivers contributing to market growth?
4.; Rising Demand for Renewable Energy4.; Decreasing Cost per Kilowatt of Electricity Generated Through Wind Energy Sources.
6. What are the notable trends driving market growth?
Onshore Segment to Dominate the Market.
7. Are there any restraints impacting market growth?
4.; Increasing Installation of Other Renewable Sources Such as Solar Energy.
8. Can you provide examples of recent developments in the market?
November 2022: TPI Composites, Inc. (TPI) signed an agreement with GE Renewable Energy (GE) to allow the former company to secure a ten-year lease extension for its rotor blade manufacturing facility in Newton, Iowa, United States. Under the agreement, GE and TPI planned to develop competitive rotor blade manufacturing options to meet GE's commitments in the United States market, with production expected to commence in 2024. The agreement is a component of the Inflation Reduction Act of 2022's support for important American industries working in the domestic renewable energy sector.
9. What pricing options are available for accessing the report?
Pricing options include single-user, multi-user, and enterprise licenses priced at USD 4750, USD 5250, and USD 8750 respectively.
10. Is the market size provided in terms of value or volume?
The market size is provided in terms of value, measured in Million and volume, measured in K Unit.
11. Are there any specific market keywords associated with the report?
Yes, the market keyword associated with the report is "North America Wind Power Equipment Market," which aids in identifying and referencing the specific market segment covered.
12. How do I determine which pricing option suits my needs best?
The pricing options vary based on user requirements and access needs. Individual users may opt for single-user licenses, while businesses requiring broader access may choose multi-user or enterprise licenses for cost-effective access to the report.
13. Are there any additional resources or data provided in the North America Wind Power Equipment Market report?
While the report offers comprehensive insights, it's advisable to review the specific contents or supplementary materials provided to ascertain if additional resources or data are available.
14. How can I stay updated on further developments or reports in the North America Wind Power Equipment Market?
To stay informed about further developments, trends, and reports in the North America Wind Power Equipment Market, consider subscribing to industry newsletters, following relevant companies and organizations, or regularly checking reputable industry news sources and publications.
Methodology
Step 1 - Identification of Relevant Samples Size from Population Database


Step 2 - Approaches for Defining Global Market Size (Value, Volume* & Price*)

Note*: In applicable scenarios
Step 3 - Data Sources
Primary Research
- Web Analytics
- Survey Reports
- Research Institute
- Latest Research Reports
- Opinion Leaders
Secondary Research
- Annual Reports
- White Paper
- Latest Press Release
- Industry Association
- Paid Database
- Investor Presentations

Step 4 - Data Triangulation
Involves using different sources of information in order to increase the validity of a study
These sources are likely to be stakeholders in a program - participants, other researchers, program staff, other community members, and so on.
Then we put all data in single framework & apply various statistical tools to find out the dynamic on the market.
During the analysis stage, feedback from the stakeholder groups would be compared to determine areas of agreement as well as areas of divergence
