

Key Insights
The South East Asia Snack Bars Industry is poised for significant expansion, currently valued at 1200 Million. With a robust Compound Annual Growth Rate (CAGR) of 5.19%, the market is projected to reach substantial figures by 2033. This growth is primarily propelled by increasing health consciousness among consumers, a rising disposable income across the region, and the escalating demand for convenient, on-the-go nutritional options. Key market drivers include the growing popularity of fitness and wellness trends, which directly translate to a higher demand for energy bars and protein-rich snack options. Furthermore, the expansion of modern retail formats like hypermarkets and supermarkets, alongside the burgeoning e-commerce sector, are significantly enhancing product accessibility and driving sales volume. The product segmentation reveals a strong preference for Cereal Bars, particularly Granola/Muesli Bars, indicating a consumer inclination towards healthier, whole-grain based snacking.
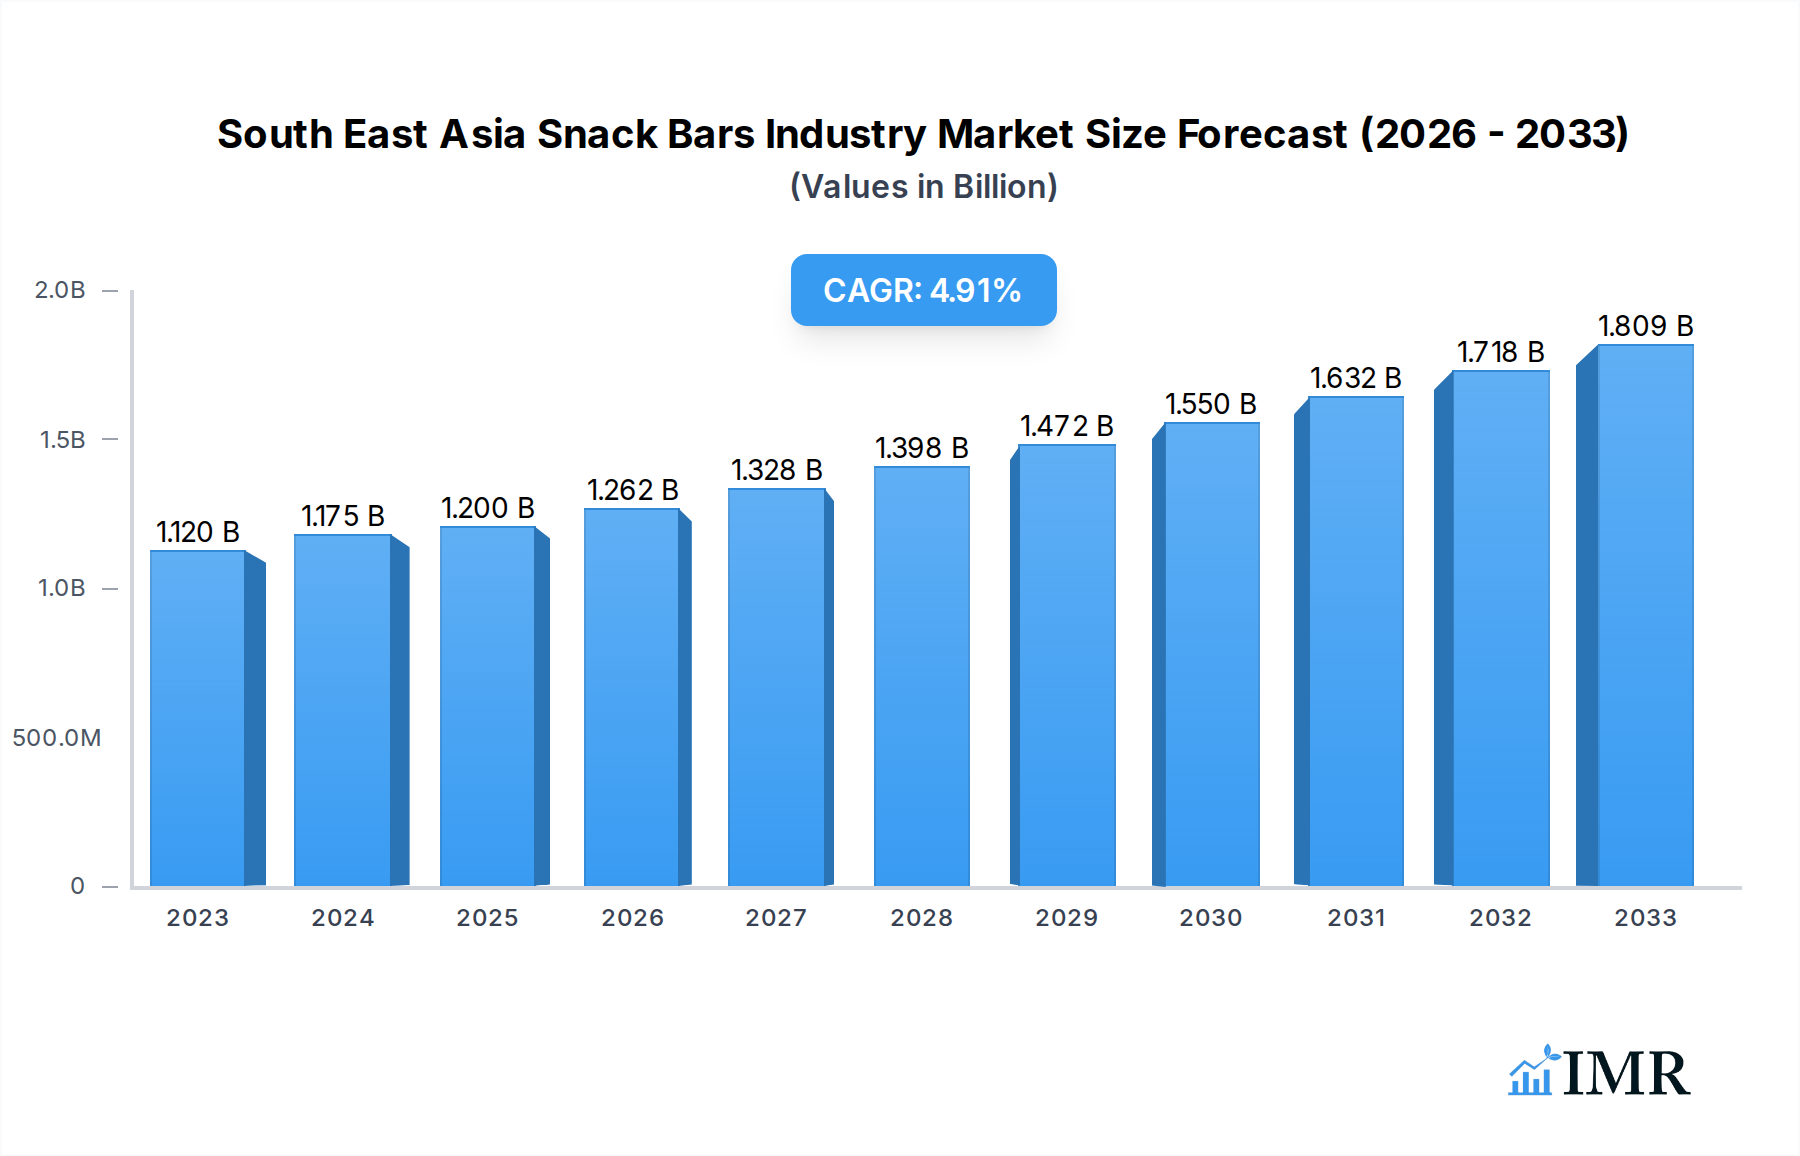
South East Asia Snack Bars Industry Market Size (In Billion)
The market landscape in South East Asia is characterized by a dynamic interplay of established multinational corporations and agile local players. Major companies like Nestle SA, General Mills Inc., and Kellogg Company are leveraging their extensive distribution networks and brand recognition, while brands like KIND LLC and GRANOVA are capturing market share with their focus on premium and innovative product offerings. Emerging trends indicate a growing interest in plant-based and organic snack bar options, catering to a niche but rapidly expanding segment of health-conscious consumers. However, the market is not without its challenges. Price sensitivity among a significant portion of the population and intense competition from traditional snack alternatives could act as restraints. Despite these, the overarching trajectory for the South East Asia Snack Bars Industry remains exceptionally positive, driven by evolving consumer preferences and a widening distribution reach across countries like Indonesia, Malaysia, Singapore, Thailand, and Vietnam.

South East Asia Snack Bars Industry Company Market Share
This comprehensive report provides an in-depth analysis of the South East Asia snack bars industry, exploring market dynamics, growth trajectories, key players, and future opportunities. Covering a study period from 2019 to 2033, with 2025 as the base and estimated year, the report offers a detailed outlook for the forecast period of 2025–2033 and a historical perspective from 2019–2024. Discover critical insights into market segmentation by product type (Cereal Bars like Granola/Muesli Bars and Other Cereal Bars, Energy Bars, and Other Snack Bars) and distribution channels (Hypermarkets/Supermarkets, Online Stores, Convenience Stores, and Other Distribution Channels). Regional analysis includes Indonesia, Malaysia, Myanmar, Philippines, Singapore, Thailand, Vietnam, and the Rest of South East Asia.
South East Asia Snack Bars Industry Market Dynamics & Structure
The South East Asia snack bars industry exhibits a moderately concentrated market structure, with a blend of global giants and agile regional players actively vying for market share. Technological innovation is a significant driver, fueled by advancements in ingredient processing, flavor development, and functional fortification, catering to evolving consumer demand for healthier and more convenient snacking options. Regulatory frameworks, particularly concerning sugar and fat content, are increasingly influencing product formulation and innovation. Competitive product substitutes, ranging from traditional snacks to fresh fruit and dairy products, necessitate continuous product differentiation and value proposition enhancement. End-user demographics are diverse, with a growing middle class, health-conscious millennials, and busy professionals forming key consumer segments. Mergers and acquisitions (M&A) trends are evident as larger companies seek to expand their market reach and product portfolios, while smaller innovative brands leverage strategic partnerships to gain traction. The market is characterized by a constant influx of new product launches, with an estimated 20% of market players actively introducing new items annually. Barriers to innovation include stringent regulatory approvals for novel ingredients and high R&D investment requirements for advanced functional benefits.
- Market Concentration: Moderate, with 5-7 key global players holding approximately 40-50% of the market share.
- Technological Innovation: Driven by functional ingredients (e.g., probiotics, vitamins), novel flavor profiles (e.g., local fruit infusions), and improved texture technologies.
- Regulatory Frameworks: Increasing scrutiny on sugar, fat, and artificial ingredient content.
- Product Substitutes: High competition from traditional snacks, fruits, nuts, and confectioneries.
- End-User Demographics: Young professionals, health-conscious individuals, and families seeking convenient and nutritious options.
- M&A Trends: Strategic acquisitions by multinational corporations to gain access to emerging markets and unique product offerings.
South East Asia Snack Bars Industry Growth Trends & Insights
The South East Asia snack bars industry is poised for robust growth, driven by a confluence of escalating disposable incomes, a burgeoning health and wellness consciousness, and a fast-paced lifestyle that favors convenient food options. The market size is projected to expand significantly, with an anticipated Compound Annual Growth Rate (CAGR) of approximately 7.5% from 2025 to 2033. This growth is underpinned by increasing adoption rates of processed snack bars, particularly among urban populations. Technological disruptions are playing a pivotal role, enabling manufacturers to develop products with enhanced nutritional profiles, such as protein-enriched bars, low-sugar variants, and those fortified with vitamins and minerals. These innovations directly address shifting consumer behavior towards mindful eating and proactive health management. Online retail channels have witnessed a substantial surge in adoption, further accelerating market penetration for snack bars, offering consumers wider accessibility and product variety. The penetration rate of snack bars in the overall confectionery and snack market is estimated to reach 25% by 2030, reflecting a growing preference for these on-the-go solutions. The evolution of dietary habits, including an increased acceptance of plant-based and gluten-free options, is also contributing to market expansion. Furthermore, the rising trend of snacking between meals as a way to manage energy levels and appetite is a significant behavioral shift favoring the snack bar category. The market's ability to adapt to these evolving consumer preferences and leverage technological advancements will be crucial in sustaining its upward trajectory. The overall market value is expected to reach approximately $3,500 million units by 2033.
Dominant Regions, Countries, or Segments in South East Asia Snack Bars Industry
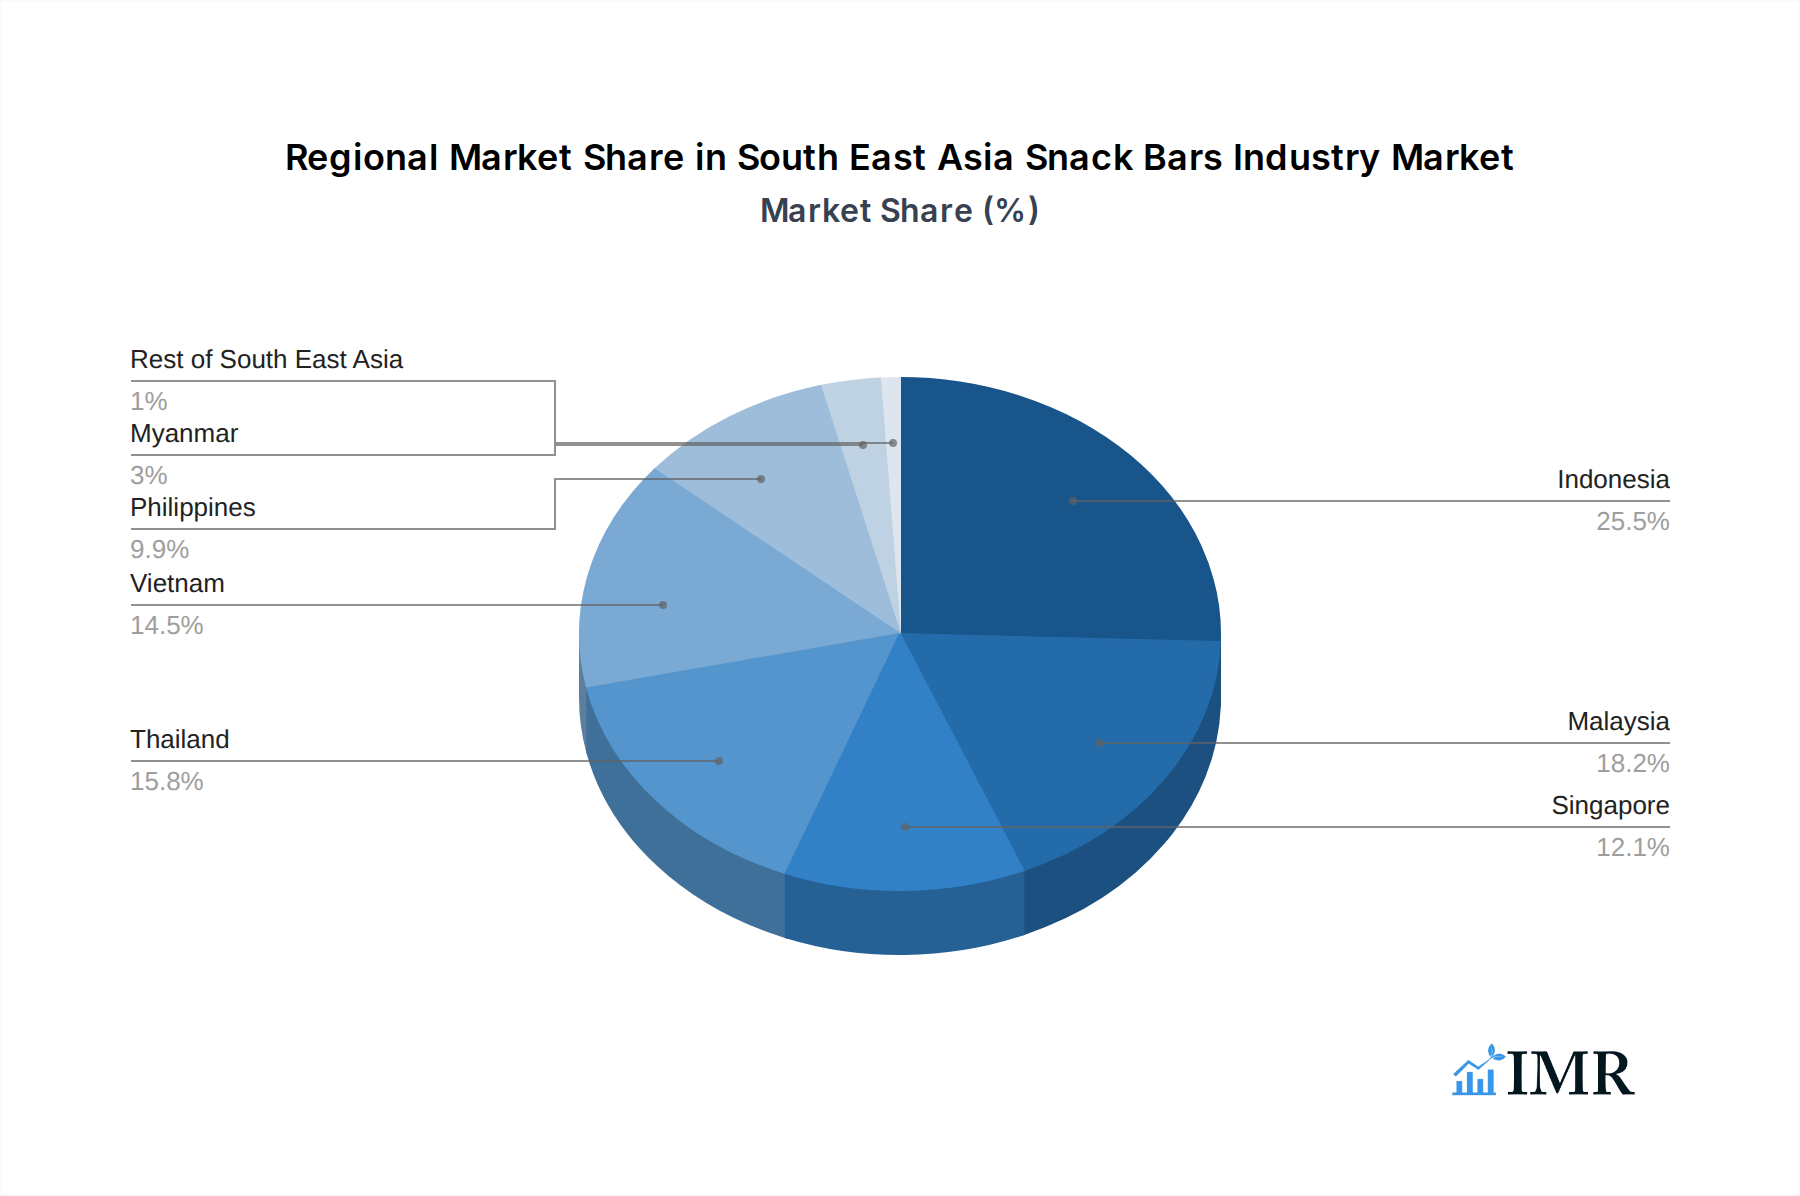
The Indonesia snack bars market is emerging as a dominant force within the South East Asian landscape, propelled by its vast population, rapidly expanding middle class, and increasing urbanization. This demographic shift translates into a higher demand for convenient and on-the-go food options, with snack bars fitting seamlessly into busy lifestyles. The Hypermarket/Supermarket distribution channel currently holds the largest market share in Indonesia, accounting for approximately 45% of snack bar sales. This dominance is attributed to the widespread presence of large retail chains offering a diverse range of products and competitive pricing, attracting a significant consumer base. However, Online Stores are rapidly gaining traction, driven by the convenience of e-commerce and the increasing smartphone penetration, projected to capture 30% of the market share by 2030.
Within the Product Type segmentation, Cereal Bars, particularly Granola/Muesli Bars, are the leading segment, holding an estimated 40% market share. This preference is linked to their perceived health benefits, natural ingredients, and satisfying texture, aligning with the growing health-conscious consumer trend. Energy Bars follow closely, catering to the active and sports-oriented population, representing around 30% of the market.
Several key drivers contribute to Indonesia's dominance and the overall growth of the snack bar industry in the region. Favorable government economic policies aimed at boosting the food processing sector, coupled with investments in modern retail infrastructure, create a conducive environment for market expansion. The increasing disposable income allows consumers to allocate more spending towards premium and health-oriented food products. Furthermore, the youthful demographic and growing awareness about health and fitness are significant demand generators. The "Rest of South East Asia" also presents substantial growth potential, driven by similar evolving consumer preferences and expanding retail footprints. Thailand and the Philippines are also key contributors to regional growth, with established convenience store networks and a growing preference for on-the-go snacking solutions.
- Dominant Country: Indonesia, due to its large population and rising disposable income.
- Dominant Distribution Channel: Hypermarket/Supermarket, followed by a rapid rise in Online Stores.
- Dominant Product Type: Cereal Bar (Granola/Muesli Bars), driven by health perception.
- Key Drivers: Economic growth, urbanization, health consciousness, youth demographic, and expanding retail infrastructure.
South East Asia Snack Bars Industry Product Landscape
The South East Asia snack bars product landscape is characterized by an accelerating trend towards functional fortification and innovative flavor profiles. Manufacturers are increasingly incorporating ingredients like probiotics for gut health, protein for satiety and muscle support, and adaptogens for stress management, catering to a growing health-conscious consumer base. Unique applications are emerging, moving beyond simple on-the-go snacks to post-workout recovery options and even meal replacement alternatives. Performance metrics are being redefined by higher protein content, lower sugar levels, and the inclusion of natural sweeteners. Technological advancements in extrusion and baking processes are enabling the creation of bars with superior textures, from chewy to crunchy, and improved shelf stability. The unique selling proposition for many new entrants lies in their ability to blend these functional benefits with appealing local flavors, such as durian or pandan, alongside international favorites.
Key Drivers, Barriers & Challenges in South East Asia Snack Bars Industry
Key Drivers:
- Rising Health and Wellness Consciousness: Consumers are actively seeking healthier snack alternatives, driving demand for bars with natural ingredients, low sugar, and added nutrients.
- Convenience and On-the-Go Lifestyles: Urbanization and fast-paced living create a significant need for portable, ready-to-eat food options.
- Growing Middle Class and Disposable Income: Increased purchasing power allows consumers to opt for premium and functional snack bars.
- Product Innovation: Continuous development of new flavors, textures, and functional benefits attracts and retains consumers.
- Expanding Retail Reach: The proliferation of hypermarkets, supermarkets, convenience stores, and online platforms enhances accessibility.
Barriers & Challenges:
- Intense Competition and Price Sensitivity: The market faces competition from a wide array of snack options, leading to price wars and margin pressures. Approximately 30% of consumers cite price as a primary purchase determinant.
- Regulatory Hurdles: Evolving government regulations on sugar, fat, and artificial ingredients can necessitate costly reformulation and compliance efforts.
- Supply Chain Volatility: Fluctuations in raw material prices and availability, particularly for exotic ingredients, can impact production costs and product consistency.
- Consumer Education and Perceptions: Convincing consumers about the true nutritional value and benefits of certain functional ingredients can be challenging.
- Counterfeit Products: The presence of counterfeit or substandard products can damage brand reputation and consumer trust.
Emerging Opportunities in South East Asia Snack Bars Industry
Emerging opportunities lie in the development of highly personalized snack bars, catering to specific dietary needs like gluten-free, vegan, or allergen-free options, a segment projected to grow by 15% annually. The untapped potential of "clean label" snack bars, free from artificial additives and preservatives, presents a significant avenue for growth. Exploring innovative applications, such as snack bars for specific age groups (e.g., children's nutrition bars) or for niche health concerns (e.g., digestive health bars), can unlock new consumer segments. The increasing demand for sustainable packaging and ethically sourced ingredients offers a chance for brands to differentiate themselves and build strong consumer loyalty, with an estimated 20% of consumers willing to pay a premium for eco-friendly products. Furthermore, leveraging digital platforms for direct-to-consumer sales and personalized subscription models can enhance customer engagement and retention.
Growth Accelerators in the South East Asia Snack Bars Industry Industry
Long-term growth in the South East Asia snack bars industry will be significantly accelerated by continuous technological breakthroughs in ingredient science and processing, enabling the creation of more nutritious and appealing products. Strategic partnerships between local manufacturers and international food science companies can foster innovation and market penetration. Market expansion strategies focusing on underpenetrated rural areas and developing nations within the region will unlock significant untapped demand. The growing popularity of functional ingredients and personalized nutrition trends will also act as powerful growth catalysts. Furthermore, proactive engagement with evolving consumer preferences for natural, sustainable, and ethically produced goods will solidify brand loyalty and drive sustained market expansion.
Key Players Shaping the South East Asia Snack Bars Industry Market
- Nesle SA
- General Mills Inc
- GRANOVA
- Clif Bar & Company
- Amway Corp
- KIND LLC
- The Hut com Limited (Myprotein)
- Kellogg Company
- General Nutrition Centers Inc
- PRISTINE (Yogood)
Notable Milestones in South East Asia Snack Bars Industry Sector
- 2021: Launch of plant-based energy bars with exotic fruit flavors by a leading regional player, tapping into the vegan trend.
- 2022: Nestle SA acquires a majority stake in a local snack bar manufacturer in Vietnam to expand its product portfolio and distribution network.
- 2022: KIND LLC introduces a range of low-sugar granola bars fortified with prebiotics to cater to digestive health concerns.
- 2023: Several companies, including PRISTINE (Yogood), focus on developing snack bars with fully compostable packaging materials.
- 2024: Government regulations in Thailand introduce stricter labeling requirements for sugar content in processed foods, impacting formulation strategies.
- 2024: GRANOVA announces a strategic partnership with a local distributor to strengthen its presence in the Philippines.
- 2024: Amway Corp launches a new line of protein bars featuring locally sourced ingredients and traditional Asian superfoods.
In-Depth South East Asia Snack Bars Industry Market Outlook
The future outlook for the South East Asia snack bars industry is exceptionally promising, propelled by sustained growth accelerators including ongoing technological advancements in health-focused ingredients and sophisticated processing techniques. Strategic alliances and potential acquisitions will continue to reshape the competitive landscape, fostering innovation and expanding market reach. The increasing consumer demand for transparency in sourcing and a commitment to sustainable practices will become crucial differentiators. Opportunities for market penetration in emerging economies within the region and the development of niche product categories catering to specific health needs or lifestyles will further fuel growth. The industry is well-positioned to capitalize on evolving consumer preferences for convenient, nutritious, and ethically produced food options.
South East Asia Snack Bars Industry Segmentation
-
1. Product Type
-
1.1. Cereal Bar
- 1.1.1. Granola/Muesli Bars
- 1.1.2. Other Cereal Bars
- 1.2. Energy Bar
- 1.3. Other Snack Bars
-
1.1. Cereal Bar
-
2. Distribution Channel
- 2.1. Hypermarket/Supermarket
- 2.2. Online Stores
- 2.3. Convenience Stores
- 2.4. Other Distribution Channels
-
3. Countires
- 3.1. Indonesia
- 3.2. Malaysia
- 3.3. Myanmar
- 3.4. Philippines
- 3.5. Singapore
- 3.6. Thailand
- 3.7. Vietnam
- 3.8. Rest of South East Asia
South East Asia Snack Bars Industry Segmentation By Geography
-
1. South East Asia
- 1.1. Indonesia
- 1.2. Malaysia
- 1.3. Singapore
- 1.4. Thailand
- 1.5. Vietnam
- 1.6. Philippines
- 1.7. Myanmar
- 1.8. Cambodia
- 1.9. Laos
South East Asia Snack Bars Industry Regional Market Share
Geographic Coverage of South East Asia Snack Bars Industry
South East Asia Snack Bars Industry REPORT HIGHLIGHTS
| Aspects | Details |
|---|---|
| Study Period | 2020-2034 |
| Base Year | 2025 |
| Estimated Year | 2026 |
| Forecast Period | 2026-2034 |
| Historical Period | 2020-2025 |
| Growth Rate | CAGR of 5.19% from 2020-2034 |
| Segmentation |
|
Table of Contents
- 1. Introduction
- 1.1. Research Scope
- 1.2. Market Segmentation
- 1.3. Research Objective
- 1.4. Definitions and Assumptions
- 2. Executive Summary
- 2.1. Market Snapshot
- 3. Market Dynamics
- 3.1. Market Drivers
- 3.2. Market Restrains
- 3.3. Market Trends
- 3.4. Market Opportunities
- 4. Market Factor Analysis
- 4.1. Porters Five Forces
- 4.1.1. Bargaining Power of Suppliers
- 4.1.2. Bargaining Power of Buyers
- 4.1.3. Threat of New Entrants
- 4.1.4. Threat of Substitutes
- 4.1.5. Competitive Rivalry
- 4.2. PESTEL analysis
- 4.3. BCG Analysis
- 4.3.1. Stars (High Growth, High Market Share)
- 4.3.2. Cash Cows (Low Growth, High Market Share)
- 4.3.3. Question Mark (High Growth, Low Market Share)
- 4.3.4. Dogs (Low Growth, Low Market Share)
- 4.4. Ansoff Matrix Analysis
- 4.5. Supply Chain Analysis
- 4.6. Regulatory Landscape
- 4.7. Current Market Potential and Opportunity Assessment (TAM–SAM–SOM Framework)
- 4.8. IMR Analyst Note
- 4.1. Porters Five Forces
- 5. Market Analysis, Insights and Forecast 2021-2033
- 5.1. Market Analysis, Insights and Forecast - by Product Type
- 5.1.1. Cereal Bar
- 5.1.1.1. Granola/Muesli Bars
- 5.1.1.2. Other Cereal Bars
- 5.1.2. Energy Bar
- 5.1.3. Other Snack Bars
- 5.1.1. Cereal Bar
- 5.2. Market Analysis, Insights and Forecast - by Distribution Channel
- 5.2.1. Hypermarket/Supermarket
- 5.2.2. Online Stores
- 5.2.3. Convenience Stores
- 5.2.4. Other Distribution Channels
- 5.3. Market Analysis, Insights and Forecast - by Countires
- 5.3.1. Indonesia
- 5.3.2. Malaysia
- 5.3.3. Myanmar
- 5.3.4. Philippines
- 5.3.5. Singapore
- 5.3.6. Thailand
- 5.3.7. Vietnam
- 5.3.8. Rest of South East Asia
- 5.4. Market Analysis, Insights and Forecast - by Region
- 5.4.1. South East Asia
- 5.1. Market Analysis, Insights and Forecast - by Product Type
- 6. South East Asia Snack Bars Industry Analysis, Insights and Forecast, 2021-2033
- 6.1. Market Analysis, Insights and Forecast - by Product Type
- 6.1.1. Cereal Bar
- 6.1.1.1. Granola/Muesli Bars
- 6.1.1.2. Other Cereal Bars
- 6.1.2. Energy Bar
- 6.1.3. Other Snack Bars
- 6.1.1. Cereal Bar
- 6.2. Market Analysis, Insights and Forecast - by Distribution Channel
- 6.2.1. Hypermarket/Supermarket
- 6.2.2. Online Stores
- 6.2.3. Convenience Stores
- 6.2.4. Other Distribution Channels
- 6.3. Market Analysis, Insights and Forecast - by Countires
- 6.3.1. Indonesia
- 6.3.2. Malaysia
- 6.3.3. Myanmar
- 6.3.4. Philippines
- 6.3.5. Singapore
- 6.3.6. Thailand
- 6.3.7. Vietnam
- 6.3.8. Rest of South East Asia
- 6.1. Market Analysis, Insights and Forecast - by Product Type
- 7. Competitive Analysis
- 7.1. Company Profiles
- 7.1.1 Nesle SA
- 7.1.1.1. Company Overview
- 7.1.1.2. Products
- 7.1.1.3. Company Financials
- 7.1.1.4. SWOT Analysis
- 7.1.2 General Mills Inc
- 7.1.2.1. Company Overview
- 7.1.2.2. Products
- 7.1.2.3. Company Financials
- 7.1.2.4. SWOT Analysis
- 7.1.3 GRANOVA
- 7.1.3.1. Company Overview
- 7.1.3.2. Products
- 7.1.3.3. Company Financials
- 7.1.3.4. SWOT Analysis
- 7.1.4 Clif Bar & Company
- 7.1.4.1. Company Overview
- 7.1.4.2. Products
- 7.1.4.3. Company Financials
- 7.1.4.4. SWOT Analysis
- 7.1.5 Amway Corp *List Not Exhaustive
- 7.1.5.1. Company Overview
- 7.1.5.2. Products
- 7.1.5.3. Company Financials
- 7.1.5.4. SWOT Analysis
- 7.1.6 KIND LLC
- 7.1.6.1. Company Overview
- 7.1.6.2. Products
- 7.1.6.3. Company Financials
- 7.1.6.4. SWOT Analysis
- 7.1.7 The Hut com Limited (Myprotein)
- 7.1.7.1. Company Overview
- 7.1.7.2. Products
- 7.1.7.3. Company Financials
- 7.1.7.4. SWOT Analysis
- 7.1.8 Kellogg Company
- 7.1.8.1. Company Overview
- 7.1.8.2. Products
- 7.1.8.3. Company Financials
- 7.1.8.4. SWOT Analysis
- 7.1.9 General Nutrition Centers Inc
- 7.1.9.1. Company Overview
- 7.1.9.2. Products
- 7.1.9.3. Company Financials
- 7.1.9.4. SWOT Analysis
- 7.1.10 PRISTINE (Yogood)
- 7.1.10.1. Company Overview
- 7.1.10.2. Products
- 7.1.10.3. Company Financials
- 7.1.10.4. SWOT Analysis
- 7.1.1 Nesle SA
- 7.2. Market Entropy
- 7.2.1 Company's Key Areas Served
- 7.2.2 Recent Developments
- 7.3. Company Market Share Analysis 2025
- 7.3.1 Top 5 Companies Market Share Analysis
- 7.3.2 Top 3 Companies Market Share Analysis
- 7.4. List of Potential Customers
- 8. Research Methodology
List of Figures
- Figure 1: South East Asia Snack Bars Industry Revenue Breakdown (Million, %) by Product 2025 & 2033
- Figure 2: South East Asia Snack Bars Industry Share (%) by Company 2025
List of Tables
- Table 1: South East Asia Snack Bars Industry Revenue Million Forecast, by Product Type 2020 & 2033
- Table 2: South East Asia Snack Bars Industry Volume K Tons Forecast, by Product Type 2020 & 2033
- Table 3: South East Asia Snack Bars Industry Revenue Million Forecast, by Distribution Channel 2020 & 2033
- Table 4: South East Asia Snack Bars Industry Volume K Tons Forecast, by Distribution Channel 2020 & 2033
- Table 5: South East Asia Snack Bars Industry Revenue Million Forecast, by Countires 2020 & 2033
- Table 6: South East Asia Snack Bars Industry Volume K Tons Forecast, by Countires 2020 & 2033
- Table 7: South East Asia Snack Bars Industry Revenue Million Forecast, by Region 2020 & 2033
- Table 8: South East Asia Snack Bars Industry Volume K Tons Forecast, by Region 2020 & 2033
- Table 9: South East Asia Snack Bars Industry Revenue Million Forecast, by Product Type 2020 & 2033
- Table 10: South East Asia Snack Bars Industry Volume K Tons Forecast, by Product Type 2020 & 2033
- Table 11: South East Asia Snack Bars Industry Revenue Million Forecast, by Distribution Channel 2020 & 2033
- Table 12: South East Asia Snack Bars Industry Volume K Tons Forecast, by Distribution Channel 2020 & 2033
- Table 13: South East Asia Snack Bars Industry Revenue Million Forecast, by Countires 2020 & 2033
- Table 14: South East Asia Snack Bars Industry Volume K Tons Forecast, by Countires 2020 & 2033
- Table 15: South East Asia Snack Bars Industry Revenue Million Forecast, by Country 2020 & 2033
- Table 16: South East Asia Snack Bars Industry Volume K Tons Forecast, by Country 2020 & 2033
- Table 17: Indonesia South East Asia Snack Bars Industry Revenue (Million) Forecast, by Application 2020 & 2033
- Table 18: Indonesia South East Asia Snack Bars Industry Volume (K Tons) Forecast, by Application 2020 & 2033
- Table 19: Malaysia South East Asia Snack Bars Industry Revenue (Million) Forecast, by Application 2020 & 2033
- Table 20: Malaysia South East Asia Snack Bars Industry Volume (K Tons) Forecast, by Application 2020 & 2033
- Table 21: Singapore South East Asia Snack Bars Industry Revenue (Million) Forecast, by Application 2020 & 2033
- Table 22: Singapore South East Asia Snack Bars Industry Volume (K Tons) Forecast, by Application 2020 & 2033
- Table 23: Thailand South East Asia Snack Bars Industry Revenue (Million) Forecast, by Application 2020 & 2033
- Table 24: Thailand South East Asia Snack Bars Industry Volume (K Tons) Forecast, by Application 2020 & 2033
- Table 25: Vietnam South East Asia Snack Bars Industry Revenue (Million) Forecast, by Application 2020 & 2033
- Table 26: Vietnam South East Asia Snack Bars Industry Volume (K Tons) Forecast, by Application 2020 & 2033
- Table 27: Philippines South East Asia Snack Bars Industry Revenue (Million) Forecast, by Application 2020 & 2033
- Table 28: Philippines South East Asia Snack Bars Industry Volume (K Tons) Forecast, by Application 2020 & 2033
- Table 29: Myanmar South East Asia Snack Bars Industry Revenue (Million) Forecast, by Application 2020 & 2033
- Table 30: Myanmar South East Asia Snack Bars Industry Volume (K Tons) Forecast, by Application 2020 & 2033
- Table 31: Cambodia South East Asia Snack Bars Industry Revenue (Million) Forecast, by Application 2020 & 2033
- Table 32: Cambodia South East Asia Snack Bars Industry Volume (K Tons) Forecast, by Application 2020 & 2033
- Table 33: Laos South East Asia Snack Bars Industry Revenue (Million) Forecast, by Application 2020 & 2033
- Table 34: Laos South East Asia Snack Bars Industry Volume (K Tons) Forecast, by Application 2020 & 2033
Frequently Asked Questions
1. What is the projected Compound Annual Growth Rate (CAGR) of the South East Asia Snack Bars Industry?
The projected CAGR is approximately 5.19%.
2. Which companies are prominent players in the South East Asia Snack Bars Industry?
Key companies in the market include Nesle SA, General Mills Inc, GRANOVA, Clif Bar & Company, Amway Corp *List Not Exhaustive, KIND LLC, The Hut com Limited (Myprotein), Kellogg Company, General Nutrition Centers Inc, PRISTINE (Yogood).
3. What are the main segments of the South East Asia Snack Bars Industry?
The market segments include Product Type, Distribution Channel, Countires.
4. Can you provide details about the market size?
The market size is estimated to be USD 1200 Million as of 2022.
5. What are some drivers contributing to market growth?
Increasing application of Gelatin in healthcare and pharmaceutical sector.
6. What are the notable trends driving market growth?
Propensity to Consume Convenient and Healthy On-the-go Meal and Snack Options.
7. Are there any restraints impacting market growth?
Rising demand for clean label products.
8. Can you provide examples of recent developments in the market?
New product launches with functional ingredients and innovative flavors
9. What pricing options are available for accessing the report?
Pricing options include single-user, multi-user, and enterprise licenses priced at USD 4750, USD 4950, and USD 6800 respectively.
10. Is the market size provided in terms of value or volume?
The market size is provided in terms of value, measured in Million and volume, measured in K Tons.
11. Are there any specific market keywords associated with the report?
Yes, the market keyword associated with the report is "South East Asia Snack Bars Industry," which aids in identifying and referencing the specific market segment covered.
12. How do I determine which pricing option suits my needs best?
The pricing options vary based on user requirements and access needs. Individual users may opt for single-user licenses, while businesses requiring broader access may choose multi-user or enterprise licenses for cost-effective access to the report.
13. Are there any additional resources or data provided in the South East Asia Snack Bars Industry report?
While the report offers comprehensive insights, it's advisable to review the specific contents or supplementary materials provided to ascertain if additional resources or data are available.
14. How can I stay updated on further developments or reports in the South East Asia Snack Bars Industry?
To stay informed about further developments, trends, and reports in the South East Asia Snack Bars Industry, consider subscribing to industry newsletters, following relevant companies and organizations, or regularly checking reputable industry news sources and publications.
Methodology
Step 1 - Identification of Relevant Samples Size from Population Database


Step 2 - Approaches for Defining Global Market Size (Value, Volume* & Price*)

Note*: In applicable scenarios
Step 3 - Data Sources
Primary Research
- Web Analytics
- Survey Reports
- Research Institute
- Latest Research Reports
- Opinion Leaders
Secondary Research
- Annual Reports
- White Paper
- Latest Press Release
- Industry Association
- Paid Database
- Investor Presentations

Step 4 - Data Triangulation
Involves using different sources of information in order to increase the validity of a study
These sources are likely to be stakeholders in a program - participants, other researchers, program staff, other community members, and so on.
Then we put all data in single framework & apply various statistical tools to find out the dynamic on the market.
During the analysis stage, feedback from the stakeholder groups would be compared to determine areas of agreement as well as areas of divergence