

Key Insights
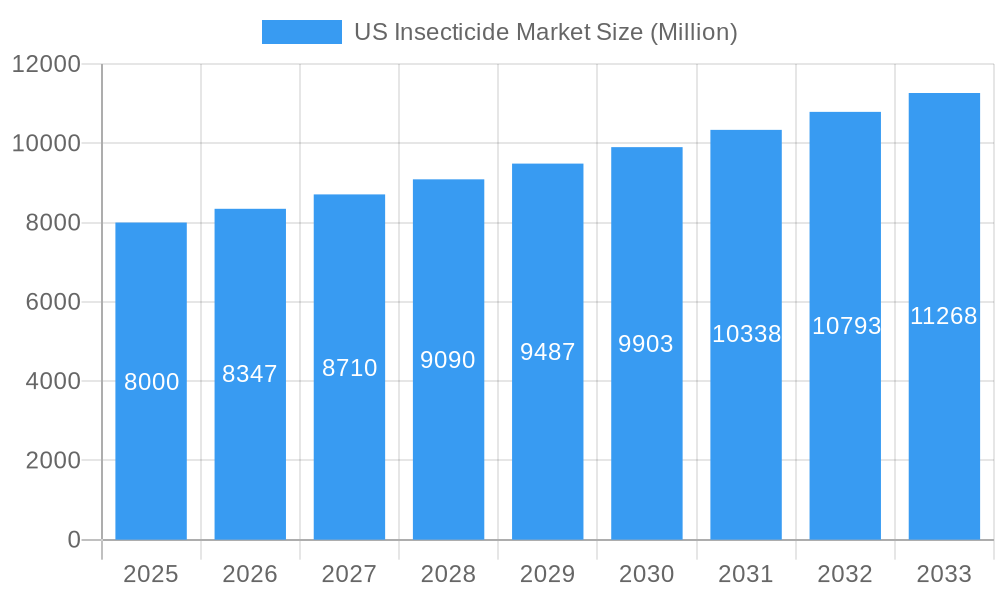
The US insecticide market, valued at approximately $8 billion in 2025, is projected to experience steady growth, exhibiting a compound annual growth rate (CAGR) of 4.34% from 2025 to 2033. This growth is driven by several key factors. Increasing pest infestations in both commercial crops and residential settings necessitate greater insecticide usage. The rising prevalence of insect-borne diseases, particularly in agricultural settings, further fuels demand. Furthermore, advancements in insecticide technology, including the development of more targeted and environmentally friendly formulations, contribute to market expansion. The market is segmented by application mode (chemigation, foliar, fumigation, seed treatment, soil treatment) and crop type (commercial crops, fruits & vegetables, grains & cereals, pulses & oilseeds, turf & ornamental), each demonstrating unique growth trajectories. Chemigation and foliar applications are expected to maintain a dominant market share due to their effectiveness and relative ease of application across various crops. Commercial crops and fruits & vegetables segments will likely continue to dominate in terms of consumption volume owing to the higher value and susceptibility to pest damage. However, the grains & cereals, pulses & oilseeds, and turf & ornamental segments are also anticipated to show significant growth, driven by rising global food demands and increasing focus on landscape aesthetics.
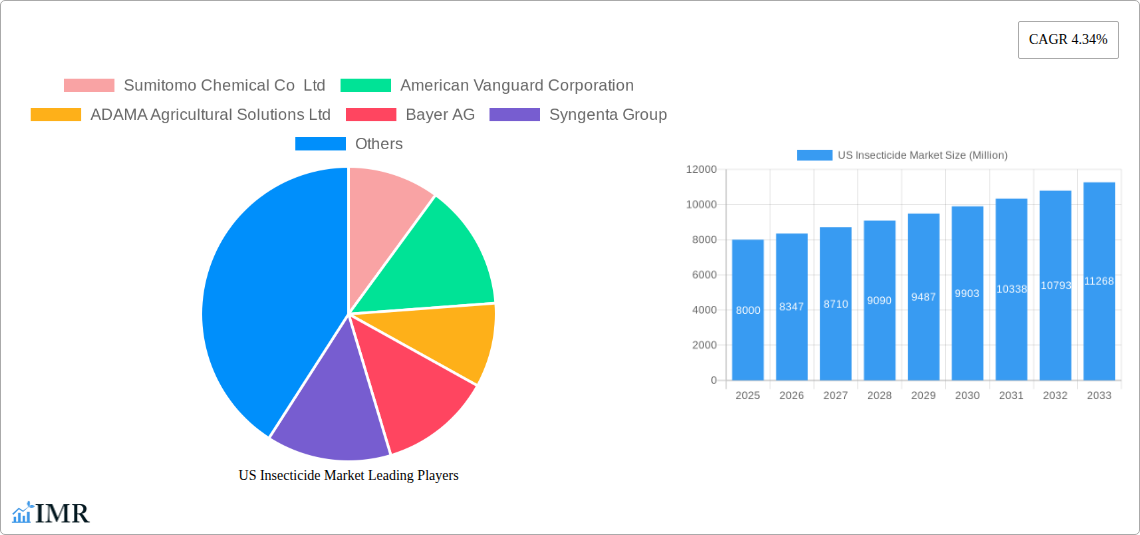
US Insecticide Market Market Size (In Billion)
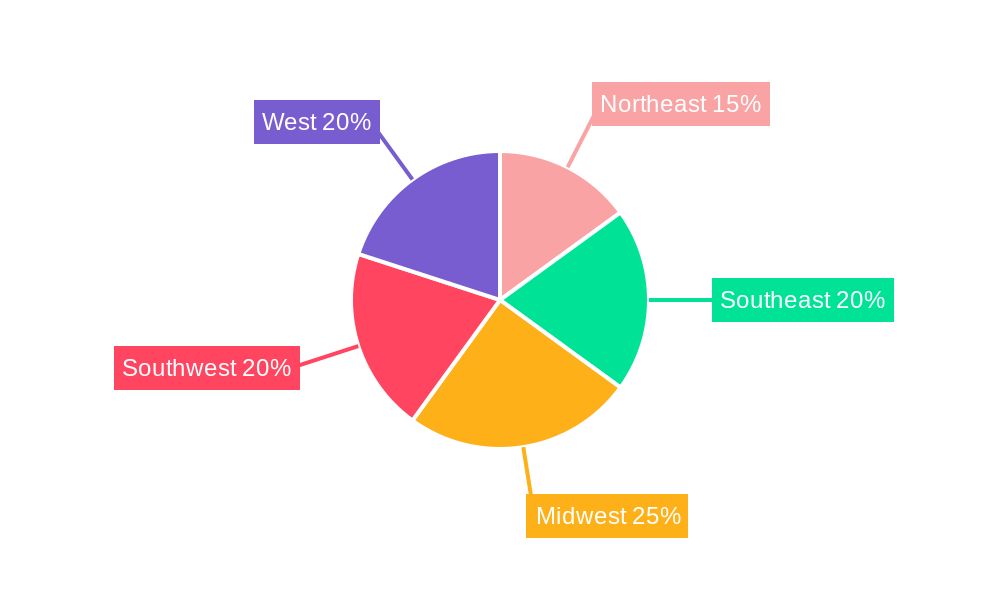
Major players like Sumitomo Chemical Co Ltd, American Vanguard Corporation, Adama Agricultural Solutions Ltd, Bayer AG, Syngenta Group, BASF SE, FMC Corporation, UPL Limited, Corteva Agriscience, and Nufarm Ltd. are shaping market competition through continuous innovation, mergers and acquisitions, and expansion into new geographical areas. While regulatory scrutiny and concerns surrounding environmental impact pose challenges to market growth, the development of biopesticides and integrated pest management (IPM) strategies is offering sustainable alternatives, helping mitigate these restraints. Regional variations exist within the US, with the Northeast, Southeast, Midwest, Southwest, and West exhibiting different growth rates depending on agricultural practices, climate conditions, and pest pressure. The forecast period (2025-2033) indicates a positive outlook for the US insecticide market, driven by a complex interplay of factors encompassing economic growth, changing agricultural practices, technological advancements, and evolving regulatory landscapes.
US Insecticide Market Company Market Share
US Insecticide Market: A Comprehensive Report (2019-2033)
This comprehensive report provides a detailed analysis of the US Insecticide Market, encompassing market dynamics, growth trends, dominant segments, key players, and future outlook. The study period covers 2019-2033, with 2025 as the base year and a forecast period of 2025-2033. The report is invaluable for industry professionals, investors, and researchers seeking insights into this vital agricultural sector. Market values are presented in million units.
US Insecticide Market Dynamics & Structure
The US insecticide market, a sub-segment of the broader US Crop Protection market, is characterized by a moderately concentrated structure with several multinational corporations holding significant market share. The market is driven by technological innovations focused on enhancing efficacy, reducing environmental impact, and addressing pest resistance. Stringent regulatory frameworks, including the Environmental Protection Agency (EPA) regulations, heavily influence product development and market entry. Competition from biopesticides and other biological control methods represents a significant challenge, alongside concerns regarding the potential for insecticide resistance. Mergers and acquisitions (M&A) activity remains moderate, driven by companies aiming to expand their product portfolios and geographic reach.
- Market Concentration: Top 5 players hold approximately xx% market share (2024).
- Technological Innovation: Focus on targeted delivery systems, biopesticides integration, and resistance management strategies.
- Regulatory Framework: EPA regulations and labeling requirements significantly impact market dynamics.
- Competitive Substitutes: Biopesticides, biological control agents, and integrated pest management (IPM) strategies are gaining traction.
- M&A Activity: xx major M&A deals recorded between 2019 and 2024, with an average deal value of xx million units.
- Innovation Barriers: High R&D costs, stringent regulatory approvals, and the complexity of developing effective and environmentally sound solutions.
US Insecticide Market Growth Trends & Insights
The US insecticide market exhibited a CAGR of xx% during the historical period (2019-2024), reaching a market size of xx million units in 2024. This growth was primarily driven by increasing crop acreage, rising pest pressure due to climate change, and the adoption of advanced application technologies. Technological disruptions, such as the development of novel active ingredients and targeted delivery systems, are further enhancing market growth. Shifts in consumer preferences toward eco-friendly solutions are also influencing market dynamics, creating opportunities for biopesticides and other sustainable alternatives. The market is projected to maintain a robust growth trajectory during the forecast period (2025-2033), with a projected CAGR of xx%, reaching xx million units by 2033. Market penetration of advanced technologies like drone application is expected to increase significantly, while resistance management strategies are gaining wider adoption.
Dominant Regions, Countries, or Segments in US Insecticide Market
The major growth drivers within the US insecticide market are concentrated across specific segments and geographical regions. Within application modes, foliar application dominates, accounting for approximately xx% of the total market in 2024, driven by its ease of use and effectiveness across various crops. Among crop types, fruits and vegetables represent the largest segment, driven by high value crops and significant pest pressure. California, Florida, and other major agricultural states represent key geographical hotspots.
- Application Mode: Foliar application leads due to widespread adoption across various crops.
- Crop Type: Fruits & vegetables, followed by grains & cereals, and commercial crops drive demand, due to higher pest prevalence and value.
- Key Regional Drivers: California, Florida, and the Midwest (corn belt) lead due to high agricultural activity and diversified crop production.
- Economic Policies: Government support for agricultural practices influences insecticide usage.
- Infrastructure: Efficient distribution networks and advanced application technologies are crucial for market growth.
US Insecticide Market Product Landscape
The US insecticide market is characterized by a dynamic and evolving product portfolio. While conventional chemistries such as organophosphates, carbamates, and pyrethroids continue to play a role, there is a significant and accelerating shift towards newer generation synthetic insecticides like neonicotinoids, alongside a substantial surge in the development and adoption of biopesticides. Innovations are sharply focused on enhancing efficacy through novel active ingredients and synergistic combinations, reducing environmental footprints with more targeted modes of action and biodegradable formulations, and optimizing application through advanced delivery systems like microencapsulation and nano-formulations. Unique selling propositions are increasingly centered on products offering reduced application rates, superior rainfastness, extended residual control, and a favorable safety profile for applicators and non-target organisms. Technological advancements are also driving the integration of these products into comprehensive pest management programs, emphasizing precision application and data-driven decision-making.
Key Drivers, Barriers & Challenges in US Insecticide Market
Key Drivers: The fundamental driver for the US insecticide market remains the persistent need to increase crop yields and quality to meet the demands of a growing population and a robust export market. Rising incidences of pest outbreaks, often exacerbated by changing climate patterns and increasing pest resistance, necessitate effective control measures. Supportive government policies and initiatives that promote efficient crop protection and food security further bolster demand. Crucially, ongoing advancements in agricultural technology, including precision application equipment and sophisticated scouting tools, enable more effective and targeted use of insecticides, thereby driving market growth. The pursuit of higher agricultural productivity and profitability by farmers acts as a constant incentive for the adoption of innovative insecticide solutions.
Key Challenges: The landscape is significantly shaped by stringent and evolving environmental regulations, which can slow the approval process for new products and restrict the use of existing ones. Widespread and growing concerns regarding insecticide resistance in pest populations pose a major threat to product efficacy and market longevity. Public and regulatory scrutiny over potential human health and environmental impacts of insecticide use continues to be a significant barrier. Fluctuations in the cost and availability of key raw materials, influenced by global supply chain dynamics and geopolitical factors, directly impact production costs and pricing. Supply chain disruptions, as witnessed in recent years, have had a tangible effect on the availability and cost of insecticides. Furthermore, the increasing adoption of alternative and sustainable pest control methods, particularly biopesticides and biological control agents, presents a growing competitive challenge, compelling traditional insecticide manufacturers to innovate and adapt. An estimated 15-20% increase in production costs in 2024 due to persistent supply chain issues and inflationary pressures is a significant concern.
Emerging Opportunities in US Insecticide Market
The burgeoning demand for sustainable agricultural practices is opening substantial avenues for the growth of biopesticides and integrated pest management (IPM) strategies. These eco-friendly alternatives are gaining traction due to their reduced environmental impact and favorable regulatory profiles. Untapped market segments, particularly within specialized crops and the rapidly expanding organic farming sector, represent significant growth potential for both novel synthetic and biological insecticides. The widespread adoption of precision agriculture techniques, including the utilization of drones for targeted spraying, sensor-based pest monitoring, and variable rate application, is revolutionizing insecticide delivery, enhancing efficiency, minimizing waste, and reducing off-target exposure. The development and implementation of robust resistance management strategies are not only crucial for maintaining the efficacy of existing products but also present an opportunity for companies offering integrated solutions and educational support to farmers.
Growth Accelerators in the US Insecticide Market Industry
Technological advancements across the entire value chain are pivotal for market expansion. This includes innovation in formulation science to improve efficacy and reduce environmental impact, the development of sophisticated delivery systems that ensure targeted application, and the discovery of novel active ingredients with enhanced potency and unique modes of action. Strategic collaborations and partnerships between leading insecticide manufacturers and agricultural technology companies are fostering cross-pollination of ideas, accelerating innovation, and broadening market penetration. Expansion into niche or underserved markets and the deployment of innovative, data-driven marketing and distribution strategies are key accelerators. A strong and consistent focus on developing and promoting environmentally sound and sustainable insecticide solutions is not only essential for long-term market viability and regulatory compliance but also crucial for building consumer trust and enhancing broader market acceptance.
Key Players Shaping the US Insecticide Market Market
- Sumitomo Chemical Co Ltd
- American Vanguard Corporation
- ADAMA Agricultural Solutions Ltd
- Bayer AG
- Syngenta Group
- BASF SE
- FMC Corporation
- UPL Limite
- Corteva Agriscience
- Nufarm Ltd
Notable Milestones in US Insecticide Market Sector
- November 2021: Syngenta Crop Protection introduced Plinazolin technology, a new active ingredient with a unique Mode of Action (IRAC Group 30) for insect control.
- May 2022: UPL partnered with Bayer for Spirotetramat insecticide, developing new pest management solutions.
- January 2023: Bayer formed a new partnership with Oerth Bio to enhance crop protection technology and create more eco-friendly solutions.
In-Depth US Insecticide Market Market Outlook
The US insecticide market is poised for continued growth driven by technological innovation, increasing demand for food security, and evolving pest management practices. Strategic partnerships, market expansion into specialized segments, and the development of sustainable solutions will shape the future landscape. The market presents significant opportunities for companies that can deliver innovative, effective, and environmentally responsible insecticides. The focus on resistance management and biopesticide integration will be crucial for long-term market sustainability and growth.
US Insecticide Market Segmentation
-
1. Application Mode
- 1.1. Chemigation
- 1.2. Foliar
- 1.3. Fumigation
- 1.4. Seed Treatment
- 1.5. Soil Treatment
-
2. Crop Type
- 2.1. Commercial Crops
- 2.2. Fruits & Vegetables
- 2.3. Grains & Cereals
- 2.4. Pulses & Oilseeds
- 2.5. Turf & Ornamental
-
3. Application Mode
- 3.1. Chemigation
- 3.2. Foliar
- 3.3. Fumigation
- 3.4. Seed Treatment
- 3.5. Soil Treatment
-
4. Crop Type
- 4.1. Commercial Crops
- 4.2. Fruits & Vegetables
- 4.3. Grains & Cereals
- 4.4. Pulses & Oilseeds
- 4.5. Turf & Ornamental
US Insecticide Market Segmentation By Geography
-
1. North America
- 1.1. United States
- 1.2. Canada
- 1.3. Mexico
-
2. South America
- 2.1. Brazil
- 2.2. Argentina
- 2.3. Rest of South America
-
3. Europe
- 3.1. United Kingdom
- 3.2. Germany
- 3.3. France
- 3.4. Italy
- 3.5. Spain
- 3.6. Russia
- 3.7. Benelux
- 3.8. Nordics
- 3.9. Rest of Europe
-
4. Middle East & Africa
- 4.1. Turkey
- 4.2. Israel
- 4.3. GCC
- 4.4. North Africa
- 4.5. South Africa
- 4.6. Rest of Middle East & Africa
-
5. Asia Pacific
- 5.1. China
- 5.2. India
- 5.3. Japan
- 5.4. South Korea
- 5.5. ASEAN
- 5.6. Oceania
- 5.7. Rest of Asia Pacific
US Insecticide Market Regional Market Share
Geographic Coverage of US Insecticide Market
US Insecticide Market REPORT HIGHLIGHTS
| Aspects | Details |
|---|---|
| Study Period | 2020-2034 |
| Base Year | 2025 |
| Estimated Year | 2026 |
| Forecast Period | 2026-2034 |
| Historical Period | 2020-2025 |
| Growth Rate | CAGR of 4.31% from 2020-2034 |
| Segmentation |
|
Table of Contents
- 1. Introduction
- 1.1. Research Scope
- 1.2. Market Segmentation
- 1.3. Research Objective
- 1.4. Definitions and Assumptions
- 2. Executive Summary
- 2.1. Market Snapshot
- 3. Market Dynamics
- 3.1. Market Drivers
- 3.2. Market Restrains
- 3.3. Market Trends
- 3.4. Market Opportunities
- 4. Market Factor Analysis
- 4.1. Porters Five Forces
- 4.1.1. Bargaining Power of Suppliers
- 4.1.2. Bargaining Power of Buyers
- 4.1.3. Threat of New Entrants
- 4.1.4. Threat of Substitutes
- 4.1.5. Competitive Rivalry
- 4.2. PESTEL analysis
- 4.3. BCG Analysis
- 4.3.1. Stars (High Growth, High Market Share)
- 4.3.2. Cash Cows (Low Growth, High Market Share)
- 4.3.3. Question Mark (High Growth, Low Market Share)
- 4.3.4. Dogs (Low Growth, Low Market Share)
- 4.4. Ansoff Matrix Analysis
- 4.5. Supply Chain Analysis
- 4.6. Regulatory Landscape
- 4.7. Current Market Potential and Opportunity Assessment (TAM–SAM–SOM Framework)
- 4.8. IMR Analyst Note
- 4.1. Porters Five Forces
- 5. Market Analysis, Insights and Forecast 2021-2033
- 5.1. Market Analysis, Insights and Forecast - by Application Mode
- 5.1.1. Chemigation
- 5.1.2. Foliar
- 5.1.3. Fumigation
- 5.1.4. Seed Treatment
- 5.1.5. Soil Treatment
- 5.2. Market Analysis, Insights and Forecast - by Crop Type
- 5.2.1. Commercial Crops
- 5.2.2. Fruits & Vegetables
- 5.2.3. Grains & Cereals
- 5.2.4. Pulses & Oilseeds
- 5.2.5. Turf & Ornamental
- 5.3. Market Analysis, Insights and Forecast - by Application Mode
- 5.3.1. Chemigation
- 5.3.2. Foliar
- 5.3.3. Fumigation
- 5.3.4. Seed Treatment
- 5.3.5. Soil Treatment
- 5.4. Market Analysis, Insights and Forecast - by Crop Type
- 5.4.1. Commercial Crops
- 5.4.2. Fruits & Vegetables
- 5.4.3. Grains & Cereals
- 5.4.4. Pulses & Oilseeds
- 5.4.5. Turf & Ornamental
- 5.5. Market Analysis, Insights and Forecast - by Region
- 5.5.1. North America
- 5.5.2. South America
- 5.5.3. Europe
- 5.5.4. Middle East & Africa
- 5.5.5. Asia Pacific
- 5.1. Market Analysis, Insights and Forecast - by Application Mode
- 6. Global US Insecticide Market Analysis, Insights and Forecast, 2021-2033
- 6.1. Market Analysis, Insights and Forecast - by Application Mode
- 6.1.1. Chemigation
- 6.1.2. Foliar
- 6.1.3. Fumigation
- 6.1.4. Seed Treatment
- 6.1.5. Soil Treatment
- 6.2. Market Analysis, Insights and Forecast - by Crop Type
- 6.2.1. Commercial Crops
- 6.2.2. Fruits & Vegetables
- 6.2.3. Grains & Cereals
- 6.2.4. Pulses & Oilseeds
- 6.2.5. Turf & Ornamental
- 6.3. Market Analysis, Insights and Forecast - by Application Mode
- 6.3.1. Chemigation
- 6.3.2. Foliar
- 6.3.3. Fumigation
- 6.3.4. Seed Treatment
- 6.3.5. Soil Treatment
- 6.4. Market Analysis, Insights and Forecast - by Crop Type
- 6.4.1. Commercial Crops
- 6.4.2. Fruits & Vegetables
- 6.4.3. Grains & Cereals
- 6.4.4. Pulses & Oilseeds
- 6.4.5. Turf & Ornamental
- 6.1. Market Analysis, Insights and Forecast - by Application Mode
- 7. North America US Insecticide Market Analysis, Insights and Forecast, 2020-2032
- 7.1. Market Analysis, Insights and Forecast - by Application Mode
- 7.1.1. Chemigation
- 7.1.2. Foliar
- 7.1.3. Fumigation
- 7.1.4. Seed Treatment
- 7.1.5. Soil Treatment
- 7.2. Market Analysis, Insights and Forecast - by Crop Type
- 7.2.1. Commercial Crops
- 7.2.2. Fruits & Vegetables
- 7.2.3. Grains & Cereals
- 7.2.4. Pulses & Oilseeds
- 7.2.5. Turf & Ornamental
- 7.3. Market Analysis, Insights and Forecast - by Application Mode
- 7.3.1. Chemigation
- 7.3.2. Foliar
- 7.3.3. Fumigation
- 7.3.4. Seed Treatment
- 7.3.5. Soil Treatment
- 7.4. Market Analysis, Insights and Forecast - by Crop Type
- 7.4.1. Commercial Crops
- 7.4.2. Fruits & Vegetables
- 7.4.3. Grains & Cereals
- 7.4.4. Pulses & Oilseeds
- 7.4.5. Turf & Ornamental
- 7.1. Market Analysis, Insights and Forecast - by Application Mode
- 8. South America US Insecticide Market Analysis, Insights and Forecast, 2020-2032
- 8.1. Market Analysis, Insights and Forecast - by Application Mode
- 8.1.1. Chemigation
- 8.1.2. Foliar
- 8.1.3. Fumigation
- 8.1.4. Seed Treatment
- 8.1.5. Soil Treatment
- 8.2. Market Analysis, Insights and Forecast - by Crop Type
- 8.2.1. Commercial Crops
- 8.2.2. Fruits & Vegetables
- 8.2.3. Grains & Cereals
- 8.2.4. Pulses & Oilseeds
- 8.2.5. Turf & Ornamental
- 8.3. Market Analysis, Insights and Forecast - by Application Mode
- 8.3.1. Chemigation
- 8.3.2. Foliar
- 8.3.3. Fumigation
- 8.3.4. Seed Treatment
- 8.3.5. Soil Treatment
- 8.4. Market Analysis, Insights and Forecast - by Crop Type
- 8.4.1. Commercial Crops
- 8.4.2. Fruits & Vegetables
- 8.4.3. Grains & Cereals
- 8.4.4. Pulses & Oilseeds
- 8.4.5. Turf & Ornamental
- 8.1. Market Analysis, Insights and Forecast - by Application Mode
- 9. Europe US Insecticide Market Analysis, Insights and Forecast, 2020-2032
- 9.1. Market Analysis, Insights and Forecast - by Application Mode
- 9.1.1. Chemigation
- 9.1.2. Foliar
- 9.1.3. Fumigation
- 9.1.4. Seed Treatment
- 9.1.5. Soil Treatment
- 9.2. Market Analysis, Insights and Forecast - by Crop Type
- 9.2.1. Commercial Crops
- 9.2.2. Fruits & Vegetables
- 9.2.3. Grains & Cereals
- 9.2.4. Pulses & Oilseeds
- 9.2.5. Turf & Ornamental
- 9.3. Market Analysis, Insights and Forecast - by Application Mode
- 9.3.1. Chemigation
- 9.3.2. Foliar
- 9.3.3. Fumigation
- 9.3.4. Seed Treatment
- 9.3.5. Soil Treatment
- 9.4. Market Analysis, Insights and Forecast - by Crop Type
- 9.4.1. Commercial Crops
- 9.4.2. Fruits & Vegetables
- 9.4.3. Grains & Cereals
- 9.4.4. Pulses & Oilseeds
- 9.4.5. Turf & Ornamental
- 9.1. Market Analysis, Insights and Forecast - by Application Mode
- 10. Middle East & Africa US Insecticide Market Analysis, Insights and Forecast, 2020-2032
- 10.1. Market Analysis, Insights and Forecast - by Application Mode
- 10.1.1. Chemigation
- 10.1.2. Foliar
- 10.1.3. Fumigation
- 10.1.4. Seed Treatment
- 10.1.5. Soil Treatment
- 10.2. Market Analysis, Insights and Forecast - by Crop Type
- 10.2.1. Commercial Crops
- 10.2.2. Fruits & Vegetables
- 10.2.3. Grains & Cereals
- 10.2.4. Pulses & Oilseeds
- 10.2.5. Turf & Ornamental
- 10.3. Market Analysis, Insights and Forecast - by Application Mode
- 10.3.1. Chemigation
- 10.3.2. Foliar
- 10.3.3. Fumigation
- 10.3.4. Seed Treatment
- 10.3.5. Soil Treatment
- 10.4. Market Analysis, Insights and Forecast - by Crop Type
- 10.4.1. Commercial Crops
- 10.4.2. Fruits & Vegetables
- 10.4.3. Grains & Cereals
- 10.4.4. Pulses & Oilseeds
- 10.4.5. Turf & Ornamental
- 10.1. Market Analysis, Insights and Forecast - by Application Mode
- 11. Asia Pacific US Insecticide Market Analysis, Insights and Forecast, 2020-2032
- 11.1. Market Analysis, Insights and Forecast - by Application Mode
- 11.1.1. Chemigation
- 11.1.2. Foliar
- 11.1.3. Fumigation
- 11.1.4. Seed Treatment
- 11.1.5. Soil Treatment
- 11.2. Market Analysis, Insights and Forecast - by Crop Type
- 11.2.1. Commercial Crops
- 11.2.2. Fruits & Vegetables
- 11.2.3. Grains & Cereals
- 11.2.4. Pulses & Oilseeds
- 11.2.5. Turf & Ornamental
- 11.3. Market Analysis, Insights and Forecast - by Application Mode
- 11.3.1. Chemigation
- 11.3.2. Foliar
- 11.3.3. Fumigation
- 11.3.4. Seed Treatment
- 11.3.5. Soil Treatment
- 11.4. Market Analysis, Insights and Forecast - by Crop Type
- 11.4.1. Commercial Crops
- 11.4.2. Fruits & Vegetables
- 11.4.3. Grains & Cereals
- 11.4.4. Pulses & Oilseeds
- 11.4.5. Turf & Ornamental
- 11.1. Market Analysis, Insights and Forecast - by Application Mode
- 12. Competitive Analysis
- 12.1. Company Profiles
- 12.1.1 Sumitomo Chemical Co Ltd
- 12.1.1.1. Company Overview
- 12.1.1.2. Products
- 12.1.1.3. Company Financials
- 12.1.1.4. SWOT Analysis
- 12.1.2 American Vanguard Corporation
- 12.1.2.1. Company Overview
- 12.1.2.2. Products
- 12.1.2.3. Company Financials
- 12.1.2.4. SWOT Analysis
- 12.1.3 ADAMA Agricultural Solutions Ltd
- 12.1.3.1. Company Overview
- 12.1.3.2. Products
- 12.1.3.3. Company Financials
- 12.1.3.4. SWOT Analysis
- 12.1.4 Bayer AG
- 12.1.4.1. Company Overview
- 12.1.4.2. Products
- 12.1.4.3. Company Financials
- 12.1.4.4. SWOT Analysis
- 12.1.5 Syngenta Group
- 12.1.5.1. Company Overview
- 12.1.5.2. Products
- 12.1.5.3. Company Financials
- 12.1.5.4. SWOT Analysis
- 12.1.6 BASF SE
- 12.1.6.1. Company Overview
- 12.1.6.2. Products
- 12.1.6.3. Company Financials
- 12.1.6.4. SWOT Analysis
- 12.1.7 FMC Corporation
- 12.1.7.1. Company Overview
- 12.1.7.2. Products
- 12.1.7.3. Company Financials
- 12.1.7.4. SWOT Analysis
- 12.1.8 UPL Limite
- 12.1.8.1. Company Overview
- 12.1.8.2. Products
- 12.1.8.3. Company Financials
- 12.1.8.4. SWOT Analysis
- 12.1.9 Corteva Agriscience
- 12.1.9.1. Company Overview
- 12.1.9.2. Products
- 12.1.9.3. Company Financials
- 12.1.9.4. SWOT Analysis
- 12.1.10 Nufarm Ltd
- 12.1.10.1. Company Overview
- 12.1.10.2. Products
- 12.1.10.3. Company Financials
- 12.1.10.4. SWOT Analysis
- 12.1.1 Sumitomo Chemical Co Ltd
- 12.2. Market Entropy
- 12.2.1 Company's Key Areas Served
- 12.2.2 Recent Developments
- 12.3. Company Market Share Analysis 2025
- 12.3.1 Top 5 Companies Market Share Analysis
- 12.3.2 Top 3 Companies Market Share Analysis
- 12.4. List of Potential Customers
- 13. Research Methodology
List of Figures
- Figure 1: Global US Insecticide Market Revenue Breakdown (billion, %) by Region 2025 & 2033
- Figure 2: Global US Insecticide Market Volume Breakdown (Kiloton, %) by Region 2025 & 2033
- Figure 3: North America US Insecticide Market Revenue (billion), by Application Mode 2025 & 2033
- Figure 4: North America US Insecticide Market Volume (Kiloton), by Application Mode 2025 & 2033
- Figure 5: North America US Insecticide Market Revenue Share (%), by Application Mode 2025 & 2033
- Figure 6: North America US Insecticide Market Volume Share (%), by Application Mode 2025 & 2033
- Figure 7: North America US Insecticide Market Revenue (billion), by Crop Type 2025 & 2033
- Figure 8: North America US Insecticide Market Volume (Kiloton), by Crop Type 2025 & 2033
- Figure 9: North America US Insecticide Market Revenue Share (%), by Crop Type 2025 & 2033
- Figure 10: North America US Insecticide Market Volume Share (%), by Crop Type 2025 & 2033
- Figure 11: North America US Insecticide Market Revenue (billion), by Application Mode 2025 & 2033
- Figure 12: North America US Insecticide Market Volume (Kiloton), by Application Mode 2025 & 2033
- Figure 13: North America US Insecticide Market Revenue Share (%), by Application Mode 2025 & 2033
- Figure 14: North America US Insecticide Market Volume Share (%), by Application Mode 2025 & 2033
- Figure 15: North America US Insecticide Market Revenue (billion), by Crop Type 2025 & 2033
- Figure 16: North America US Insecticide Market Volume (Kiloton), by Crop Type 2025 & 2033
- Figure 17: North America US Insecticide Market Revenue Share (%), by Crop Type 2025 & 2033
- Figure 18: North America US Insecticide Market Volume Share (%), by Crop Type 2025 & 2033
- Figure 19: North America US Insecticide Market Revenue (billion), by Country 2025 & 2033
- Figure 20: North America US Insecticide Market Volume (Kiloton), by Country 2025 & 2033
- Figure 21: North America US Insecticide Market Revenue Share (%), by Country 2025 & 2033
- Figure 22: North America US Insecticide Market Volume Share (%), by Country 2025 & 2033
- Figure 23: South America US Insecticide Market Revenue (billion), by Application Mode 2025 & 2033
- Figure 24: South America US Insecticide Market Volume (Kiloton), by Application Mode 2025 & 2033
- Figure 25: South America US Insecticide Market Revenue Share (%), by Application Mode 2025 & 2033
- Figure 26: South America US Insecticide Market Volume Share (%), by Application Mode 2025 & 2033
- Figure 27: South America US Insecticide Market Revenue (billion), by Crop Type 2025 & 2033
- Figure 28: South America US Insecticide Market Volume (Kiloton), by Crop Type 2025 & 2033
- Figure 29: South America US Insecticide Market Revenue Share (%), by Crop Type 2025 & 2033
- Figure 30: South America US Insecticide Market Volume Share (%), by Crop Type 2025 & 2033
- Figure 31: South America US Insecticide Market Revenue (billion), by Application Mode 2025 & 2033
- Figure 32: South America US Insecticide Market Volume (Kiloton), by Application Mode 2025 & 2033
- Figure 33: South America US Insecticide Market Revenue Share (%), by Application Mode 2025 & 2033
- Figure 34: South America US Insecticide Market Volume Share (%), by Application Mode 2025 & 2033
- Figure 35: South America US Insecticide Market Revenue (billion), by Crop Type 2025 & 2033
- Figure 36: South America US Insecticide Market Volume (Kiloton), by Crop Type 2025 & 2033
- Figure 37: South America US Insecticide Market Revenue Share (%), by Crop Type 2025 & 2033
- Figure 38: South America US Insecticide Market Volume Share (%), by Crop Type 2025 & 2033
- Figure 39: South America US Insecticide Market Revenue (billion), by Country 2025 & 2033
- Figure 40: South America US Insecticide Market Volume (Kiloton), by Country 2025 & 2033
- Figure 41: South America US Insecticide Market Revenue Share (%), by Country 2025 & 2033
- Figure 42: South America US Insecticide Market Volume Share (%), by Country 2025 & 2033
- Figure 43: Europe US Insecticide Market Revenue (billion), by Application Mode 2025 & 2033
- Figure 44: Europe US Insecticide Market Volume (Kiloton), by Application Mode 2025 & 2033
- Figure 45: Europe US Insecticide Market Revenue Share (%), by Application Mode 2025 & 2033
- Figure 46: Europe US Insecticide Market Volume Share (%), by Application Mode 2025 & 2033
- Figure 47: Europe US Insecticide Market Revenue (billion), by Crop Type 2025 & 2033
- Figure 48: Europe US Insecticide Market Volume (Kiloton), by Crop Type 2025 & 2033
- Figure 49: Europe US Insecticide Market Revenue Share (%), by Crop Type 2025 & 2033
- Figure 50: Europe US Insecticide Market Volume Share (%), by Crop Type 2025 & 2033
- Figure 51: Europe US Insecticide Market Revenue (billion), by Application Mode 2025 & 2033
- Figure 52: Europe US Insecticide Market Volume (Kiloton), by Application Mode 2025 & 2033
- Figure 53: Europe US Insecticide Market Revenue Share (%), by Application Mode 2025 & 2033
- Figure 54: Europe US Insecticide Market Volume Share (%), by Application Mode 2025 & 2033
- Figure 55: Europe US Insecticide Market Revenue (billion), by Crop Type 2025 & 2033
- Figure 56: Europe US Insecticide Market Volume (Kiloton), by Crop Type 2025 & 2033
- Figure 57: Europe US Insecticide Market Revenue Share (%), by Crop Type 2025 & 2033
- Figure 58: Europe US Insecticide Market Volume Share (%), by Crop Type 2025 & 2033
- Figure 59: Europe US Insecticide Market Revenue (billion), by Country 2025 & 2033
- Figure 60: Europe US Insecticide Market Volume (Kiloton), by Country 2025 & 2033
- Figure 61: Europe US Insecticide Market Revenue Share (%), by Country 2025 & 2033
- Figure 62: Europe US Insecticide Market Volume Share (%), by Country 2025 & 2033
- Figure 63: Middle East & Africa US Insecticide Market Revenue (billion), by Application Mode 2025 & 2033
- Figure 64: Middle East & Africa US Insecticide Market Volume (Kiloton), by Application Mode 2025 & 2033
- Figure 65: Middle East & Africa US Insecticide Market Revenue Share (%), by Application Mode 2025 & 2033
- Figure 66: Middle East & Africa US Insecticide Market Volume Share (%), by Application Mode 2025 & 2033
- Figure 67: Middle East & Africa US Insecticide Market Revenue (billion), by Crop Type 2025 & 2033
- Figure 68: Middle East & Africa US Insecticide Market Volume (Kiloton), by Crop Type 2025 & 2033
- Figure 69: Middle East & Africa US Insecticide Market Revenue Share (%), by Crop Type 2025 & 2033
- Figure 70: Middle East & Africa US Insecticide Market Volume Share (%), by Crop Type 2025 & 2033
- Figure 71: Middle East & Africa US Insecticide Market Revenue (billion), by Application Mode 2025 & 2033
- Figure 72: Middle East & Africa US Insecticide Market Volume (Kiloton), by Application Mode 2025 & 2033
- Figure 73: Middle East & Africa US Insecticide Market Revenue Share (%), by Application Mode 2025 & 2033
- Figure 74: Middle East & Africa US Insecticide Market Volume Share (%), by Application Mode 2025 & 2033
- Figure 75: Middle East & Africa US Insecticide Market Revenue (billion), by Crop Type 2025 & 2033
- Figure 76: Middle East & Africa US Insecticide Market Volume (Kiloton), by Crop Type 2025 & 2033
- Figure 77: Middle East & Africa US Insecticide Market Revenue Share (%), by Crop Type 2025 & 2033
- Figure 78: Middle East & Africa US Insecticide Market Volume Share (%), by Crop Type 2025 & 2033
- Figure 79: Middle East & Africa US Insecticide Market Revenue (billion), by Country 2025 & 2033
- Figure 80: Middle East & Africa US Insecticide Market Volume (Kiloton), by Country 2025 & 2033
- Figure 81: Middle East & Africa US Insecticide Market Revenue Share (%), by Country 2025 & 2033
- Figure 82: Middle East & Africa US Insecticide Market Volume Share (%), by Country 2025 & 2033
- Figure 83: Asia Pacific US Insecticide Market Revenue (billion), by Application Mode 2025 & 2033
- Figure 84: Asia Pacific US Insecticide Market Volume (Kiloton), by Application Mode 2025 & 2033
- Figure 85: Asia Pacific US Insecticide Market Revenue Share (%), by Application Mode 2025 & 2033
- Figure 86: Asia Pacific US Insecticide Market Volume Share (%), by Application Mode 2025 & 2033
- Figure 87: Asia Pacific US Insecticide Market Revenue (billion), by Crop Type 2025 & 2033
- Figure 88: Asia Pacific US Insecticide Market Volume (Kiloton), by Crop Type 2025 & 2033
- Figure 89: Asia Pacific US Insecticide Market Revenue Share (%), by Crop Type 2025 & 2033
- Figure 90: Asia Pacific US Insecticide Market Volume Share (%), by Crop Type 2025 & 2033
- Figure 91: Asia Pacific US Insecticide Market Revenue (billion), by Application Mode 2025 & 2033
- Figure 92: Asia Pacific US Insecticide Market Volume (Kiloton), by Application Mode 2025 & 2033
- Figure 93: Asia Pacific US Insecticide Market Revenue Share (%), by Application Mode 2025 & 2033
- Figure 94: Asia Pacific US Insecticide Market Volume Share (%), by Application Mode 2025 & 2033
- Figure 95: Asia Pacific US Insecticide Market Revenue (billion), by Crop Type 2025 & 2033
- Figure 96: Asia Pacific US Insecticide Market Volume (Kiloton), by Crop Type 2025 & 2033
- Figure 97: Asia Pacific US Insecticide Market Revenue Share (%), by Crop Type 2025 & 2033
- Figure 98: Asia Pacific US Insecticide Market Volume Share (%), by Crop Type 2025 & 2033
- Figure 99: Asia Pacific US Insecticide Market Revenue (billion), by Country 2025 & 2033
- Figure 100: Asia Pacific US Insecticide Market Volume (Kiloton), by Country 2025 & 2033
- Figure 101: Asia Pacific US Insecticide Market Revenue Share (%), by Country 2025 & 2033
- Figure 102: Asia Pacific US Insecticide Market Volume Share (%), by Country 2025 & 2033
List of Tables
- Table 1: Global US Insecticide Market Revenue billion Forecast, by Application Mode 2020 & 2033
- Table 2: Global US Insecticide Market Volume Kiloton Forecast, by Application Mode 2020 & 2033
- Table 3: Global US Insecticide Market Revenue billion Forecast, by Crop Type 2020 & 2033
- Table 4: Global US Insecticide Market Volume Kiloton Forecast, by Crop Type 2020 & 2033
- Table 5: Global US Insecticide Market Revenue billion Forecast, by Application Mode 2020 & 2033
- Table 6: Global US Insecticide Market Volume Kiloton Forecast, by Application Mode 2020 & 2033
- Table 7: Global US Insecticide Market Revenue billion Forecast, by Crop Type 2020 & 2033
- Table 8: Global US Insecticide Market Volume Kiloton Forecast, by Crop Type 2020 & 2033
- Table 9: Global US Insecticide Market Revenue billion Forecast, by Region 2020 & 2033
- Table 10: Global US Insecticide Market Volume Kiloton Forecast, by Region 2020 & 2033
- Table 11: Global US Insecticide Market Revenue billion Forecast, by Application Mode 2020 & 2033
- Table 12: Global US Insecticide Market Volume Kiloton Forecast, by Application Mode 2020 & 2033
- Table 13: Global US Insecticide Market Revenue billion Forecast, by Crop Type 2020 & 2033
- Table 14: Global US Insecticide Market Volume Kiloton Forecast, by Crop Type 2020 & 2033
- Table 15: Global US Insecticide Market Revenue billion Forecast, by Application Mode 2020 & 2033
- Table 16: Global US Insecticide Market Volume Kiloton Forecast, by Application Mode 2020 & 2033
- Table 17: Global US Insecticide Market Revenue billion Forecast, by Crop Type 2020 & 2033
- Table 18: Global US Insecticide Market Volume Kiloton Forecast, by Crop Type 2020 & 2033
- Table 19: Global US Insecticide Market Revenue billion Forecast, by Country 2020 & 2033
- Table 20: Global US Insecticide Market Volume Kiloton Forecast, by Country 2020 & 2033
- Table 21: United States US Insecticide Market Revenue (billion) Forecast, by Application 2020 & 2033
- Table 22: United States US Insecticide Market Volume (Kiloton) Forecast, by Application 2020 & 2033
- Table 23: Canada US Insecticide Market Revenue (billion) Forecast, by Application 2020 & 2033
- Table 24: Canada US Insecticide Market Volume (Kiloton) Forecast, by Application 2020 & 2033
- Table 25: Mexico US Insecticide Market Revenue (billion) Forecast, by Application 2020 & 2033
- Table 26: Mexico US Insecticide Market Volume (Kiloton) Forecast, by Application 2020 & 2033
- Table 27: Global US Insecticide Market Revenue billion Forecast, by Application Mode 2020 & 2033
- Table 28: Global US Insecticide Market Volume Kiloton Forecast, by Application Mode 2020 & 2033
- Table 29: Global US Insecticide Market Revenue billion Forecast, by Crop Type 2020 & 2033
- Table 30: Global US Insecticide Market Volume Kiloton Forecast, by Crop Type 2020 & 2033
- Table 31: Global US Insecticide Market Revenue billion Forecast, by Application Mode 2020 & 2033
- Table 32: Global US Insecticide Market Volume Kiloton Forecast, by Application Mode 2020 & 2033
- Table 33: Global US Insecticide Market Revenue billion Forecast, by Crop Type 2020 & 2033
- Table 34: Global US Insecticide Market Volume Kiloton Forecast, by Crop Type 2020 & 2033
- Table 35: Global US Insecticide Market Revenue billion Forecast, by Country 2020 & 2033
- Table 36: Global US Insecticide Market Volume Kiloton Forecast, by Country 2020 & 2033
- Table 37: Brazil US Insecticide Market Revenue (billion) Forecast, by Application 2020 & 2033
- Table 38: Brazil US Insecticide Market Volume (Kiloton) Forecast, by Application 2020 & 2033
- Table 39: Argentina US Insecticide Market Revenue (billion) Forecast, by Application 2020 & 2033
- Table 40: Argentina US Insecticide Market Volume (Kiloton) Forecast, by Application 2020 & 2033
- Table 41: Rest of South America US Insecticide Market Revenue (billion) Forecast, by Application 2020 & 2033
- Table 42: Rest of South America US Insecticide Market Volume (Kiloton) Forecast, by Application 2020 & 2033
- Table 43: Global US Insecticide Market Revenue billion Forecast, by Application Mode 2020 & 2033
- Table 44: Global US Insecticide Market Volume Kiloton Forecast, by Application Mode 2020 & 2033
- Table 45: Global US Insecticide Market Revenue billion Forecast, by Crop Type 2020 & 2033
- Table 46: Global US Insecticide Market Volume Kiloton Forecast, by Crop Type 2020 & 2033
- Table 47: Global US Insecticide Market Revenue billion Forecast, by Application Mode 2020 & 2033
- Table 48: Global US Insecticide Market Volume Kiloton Forecast, by Application Mode 2020 & 2033
- Table 49: Global US Insecticide Market Revenue billion Forecast, by Crop Type 2020 & 2033
- Table 50: Global US Insecticide Market Volume Kiloton Forecast, by Crop Type 2020 & 2033
- Table 51: Global US Insecticide Market Revenue billion Forecast, by Country 2020 & 2033
- Table 52: Global US Insecticide Market Volume Kiloton Forecast, by Country 2020 & 2033
- Table 53: United Kingdom US Insecticide Market Revenue (billion) Forecast, by Application 2020 & 2033
- Table 54: United Kingdom US Insecticide Market Volume (Kiloton) Forecast, by Application 2020 & 2033
- Table 55: Germany US Insecticide Market Revenue (billion) Forecast, by Application 2020 & 2033
- Table 56: Germany US Insecticide Market Volume (Kiloton) Forecast, by Application 2020 & 2033
- Table 57: France US Insecticide Market Revenue (billion) Forecast, by Application 2020 & 2033
- Table 58: France US Insecticide Market Volume (Kiloton) Forecast, by Application 2020 & 2033
- Table 59: Italy US Insecticide Market Revenue (billion) Forecast, by Application 2020 & 2033
- Table 60: Italy US Insecticide Market Volume (Kiloton) Forecast, by Application 2020 & 2033
- Table 61: Spain US Insecticide Market Revenue (billion) Forecast, by Application 2020 & 2033
- Table 62: Spain US Insecticide Market Volume (Kiloton) Forecast, by Application 2020 & 2033
- Table 63: Russia US Insecticide Market Revenue (billion) Forecast, by Application 2020 & 2033
- Table 64: Russia US Insecticide Market Volume (Kiloton) Forecast, by Application 2020 & 2033
- Table 65: Benelux US Insecticide Market Revenue (billion) Forecast, by Application 2020 & 2033
- Table 66: Benelux US Insecticide Market Volume (Kiloton) Forecast, by Application 2020 & 2033
- Table 67: Nordics US Insecticide Market Revenue (billion) Forecast, by Application 2020 & 2033
- Table 68: Nordics US Insecticide Market Volume (Kiloton) Forecast, by Application 2020 & 2033
- Table 69: Rest of Europe US Insecticide Market Revenue (billion) Forecast, by Application 2020 & 2033
- Table 70: Rest of Europe US Insecticide Market Volume (Kiloton) Forecast, by Application 2020 & 2033
- Table 71: Global US Insecticide Market Revenue billion Forecast, by Application Mode 2020 & 2033
- Table 72: Global US Insecticide Market Volume Kiloton Forecast, by Application Mode 2020 & 2033
- Table 73: Global US Insecticide Market Revenue billion Forecast, by Crop Type 2020 & 2033
- Table 74: Global US Insecticide Market Volume Kiloton Forecast, by Crop Type 2020 & 2033
- Table 75: Global US Insecticide Market Revenue billion Forecast, by Application Mode 2020 & 2033
- Table 76: Global US Insecticide Market Volume Kiloton Forecast, by Application Mode 2020 & 2033
- Table 77: Global US Insecticide Market Revenue billion Forecast, by Crop Type 2020 & 2033
- Table 78: Global US Insecticide Market Volume Kiloton Forecast, by Crop Type 2020 & 2033
- Table 79: Global US Insecticide Market Revenue billion Forecast, by Country 2020 & 2033
- Table 80: Global US Insecticide Market Volume Kiloton Forecast, by Country 2020 & 2033
- Table 81: Turkey US Insecticide Market Revenue (billion) Forecast, by Application 2020 & 2033
- Table 82: Turkey US Insecticide Market Volume (Kiloton) Forecast, by Application 2020 & 2033
- Table 83: Israel US Insecticide Market Revenue (billion) Forecast, by Application 2020 & 2033
- Table 84: Israel US Insecticide Market Volume (Kiloton) Forecast, by Application 2020 & 2033
- Table 85: GCC US Insecticide Market Revenue (billion) Forecast, by Application 2020 & 2033
- Table 86: GCC US Insecticide Market Volume (Kiloton) Forecast, by Application 2020 & 2033
- Table 87: North Africa US Insecticide Market Revenue (billion) Forecast, by Application 2020 & 2033
- Table 88: North Africa US Insecticide Market Volume (Kiloton) Forecast, by Application 2020 & 2033
- Table 89: South Africa US Insecticide Market Revenue (billion) Forecast, by Application 2020 & 2033
- Table 90: South Africa US Insecticide Market Volume (Kiloton) Forecast, by Application 2020 & 2033
- Table 91: Rest of Middle East & Africa US Insecticide Market Revenue (billion) Forecast, by Application 2020 & 2033
- Table 92: Rest of Middle East & Africa US Insecticide Market Volume (Kiloton) Forecast, by Application 2020 & 2033
- Table 93: Global US Insecticide Market Revenue billion Forecast, by Application Mode 2020 & 2033
- Table 94: Global US Insecticide Market Volume Kiloton Forecast, by Application Mode 2020 & 2033
- Table 95: Global US Insecticide Market Revenue billion Forecast, by Crop Type 2020 & 2033
- Table 96: Global US Insecticide Market Volume Kiloton Forecast, by Crop Type 2020 & 2033
- Table 97: Global US Insecticide Market Revenue billion Forecast, by Application Mode 2020 & 2033
- Table 98: Global US Insecticide Market Volume Kiloton Forecast, by Application Mode 2020 & 2033
- Table 99: Global US Insecticide Market Revenue billion Forecast, by Crop Type 2020 & 2033
- Table 100: Global US Insecticide Market Volume Kiloton Forecast, by Crop Type 2020 & 2033
- Table 101: Global US Insecticide Market Revenue billion Forecast, by Country 2020 & 2033
- Table 102: Global US Insecticide Market Volume Kiloton Forecast, by Country 2020 & 2033
- Table 103: China US Insecticide Market Revenue (billion) Forecast, by Application 2020 & 2033
- Table 104: China US Insecticide Market Volume (Kiloton) Forecast, by Application 2020 & 2033
- Table 105: India US Insecticide Market Revenue (billion) Forecast, by Application 2020 & 2033
- Table 106: India US Insecticide Market Volume (Kiloton) Forecast, by Application 2020 & 2033
- Table 107: Japan US Insecticide Market Revenue (billion) Forecast, by Application 2020 & 2033
- Table 108: Japan US Insecticide Market Volume (Kiloton) Forecast, by Application 2020 & 2033
- Table 109: South Korea US Insecticide Market Revenue (billion) Forecast, by Application 2020 & 2033
- Table 110: South Korea US Insecticide Market Volume (Kiloton) Forecast, by Application 2020 & 2033
- Table 111: ASEAN US Insecticide Market Revenue (billion) Forecast, by Application 2020 & 2033
- Table 112: ASEAN US Insecticide Market Volume (Kiloton) Forecast, by Application 2020 & 2033
- Table 113: Oceania US Insecticide Market Revenue (billion) Forecast, by Application 2020 & 2033
- Table 114: Oceania US Insecticide Market Volume (Kiloton) Forecast, by Application 2020 & 2033
- Table 115: Rest of Asia Pacific US Insecticide Market Revenue (billion) Forecast, by Application 2020 & 2033
- Table 116: Rest of Asia Pacific US Insecticide Market Volume (Kiloton) Forecast, by Application 2020 & 2033
Frequently Asked Questions
1. What is the projected Compound Annual Growth Rate (CAGR) of the US Insecticide Market?
The projected CAGR is approximately 4.31%.
2. Which companies are prominent players in the US Insecticide Market?
Key companies in the market include Sumitomo Chemical Co Ltd, American Vanguard Corporation, ADAMA Agricultural Solutions Ltd, Bayer AG, Syngenta Group, BASF SE, FMC Corporation, UPL Limite, Corteva Agriscience, Nufarm Ltd.
3. What are the main segments of the US Insecticide Market?
The market segments include Application Mode, Crop Type, Application Mode, Crop Type.
4. Can you provide details about the market size?
The market size is estimated to be USD 7.98 billion as of 2022.
5. What are some drivers contributing to market growth?
Seed Treatment As A Solution To Enhance Yield; Growing Awareness For Seed Treatment Among The Farmers; Rising Trend Of Organic Farming.
6. What are the notable trends driving market growth?
The foliar application mode is a common and effective way of applying insecticides for preventive and curative reasons.
7. Are there any restraints impacting market growth?
Limitations Across Farm-Level Seed Treatment; Rising Environmental Concerns.
8. Can you provide examples of recent developments in the market?
January 2023: Bayer formed a new partnership with Oerth Bio to enhance crop protection technology and create more eco-friendly crop protection solutions.May 2022: UPL partnered with Bayer for Spirotetramat insecticide to develop new pest management solutions. Through this long-term global data access and supply agreement with Bayer, specifically for addressing farmer demands regarding resistance management and difficult-to-control sucking pests, UPL will develop, register, and distribute new unique solutions, including Spirotetramat, using its experience in insecticides and worldwide research and development network.November 2021: Syngenta Crop Protection introduced the Plinazolin technology, a new active ingredient with a unique Mode of Action (IRAC Group 30) for insect control to assist farmers in protecting their crops from a variety of pests.
9. What pricing options are available for accessing the report?
Pricing options include single-user, multi-user, and enterprise licenses priced at USD 3800, USD 4500, and USD 5800 respectively.
10. Is the market size provided in terms of value or volume?
The market size is provided in terms of value, measured in billion and volume, measured in Kiloton.
11. Are there any specific market keywords associated with the report?
Yes, the market keyword associated with the report is "US Insecticide Market," which aids in identifying and referencing the specific market segment covered.
12. How do I determine which pricing option suits my needs best?
The pricing options vary based on user requirements and access needs. Individual users may opt for single-user licenses, while businesses requiring broader access may choose multi-user or enterprise licenses for cost-effective access to the report.
13. Are there any additional resources or data provided in the US Insecticide Market report?
While the report offers comprehensive insights, it's advisable to review the specific contents or supplementary materials provided to ascertain if additional resources or data are available.
14. How can I stay updated on further developments or reports in the US Insecticide Market?
To stay informed about further developments, trends, and reports in the US Insecticide Market, consider subscribing to industry newsletters, following relevant companies and organizations, or regularly checking reputable industry news sources and publications.
Methodology
Step 1 - Identification of Relevant Samples Size from Population Database


Step 2 - Approaches for Defining Global Market Size (Value, Volume* & Price*)

Note*: In applicable scenarios
Step 3 - Data Sources
Primary Research
- Web Analytics
- Survey Reports
- Research Institute
- Latest Research Reports
- Opinion Leaders
Secondary Research
- Annual Reports
- White Paper
- Latest Press Release
- Industry Association
- Paid Database
- Investor Presentations

Step 4 - Data Triangulation
Involves using different sources of information in order to increase the validity of a study
These sources are likely to be stakeholders in a program - participants, other researchers, program staff, other community members, and so on.
Then we put all data in single framework & apply various statistical tools to find out the dynamic on the market.
During the analysis stage, feedback from the stakeholder groups would be compared to determine areas of agreement as well as areas of divergence