

Key Insights
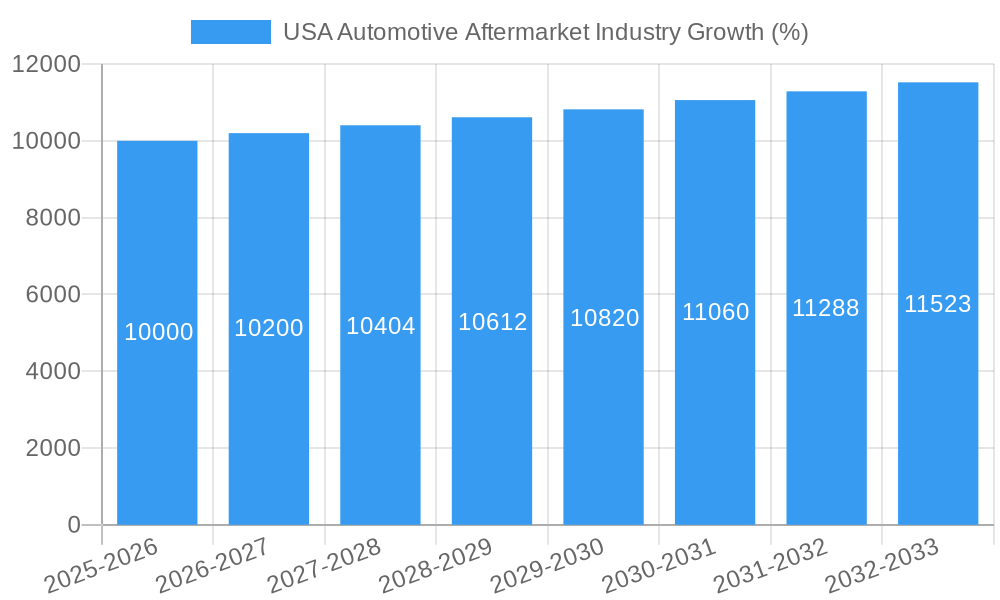
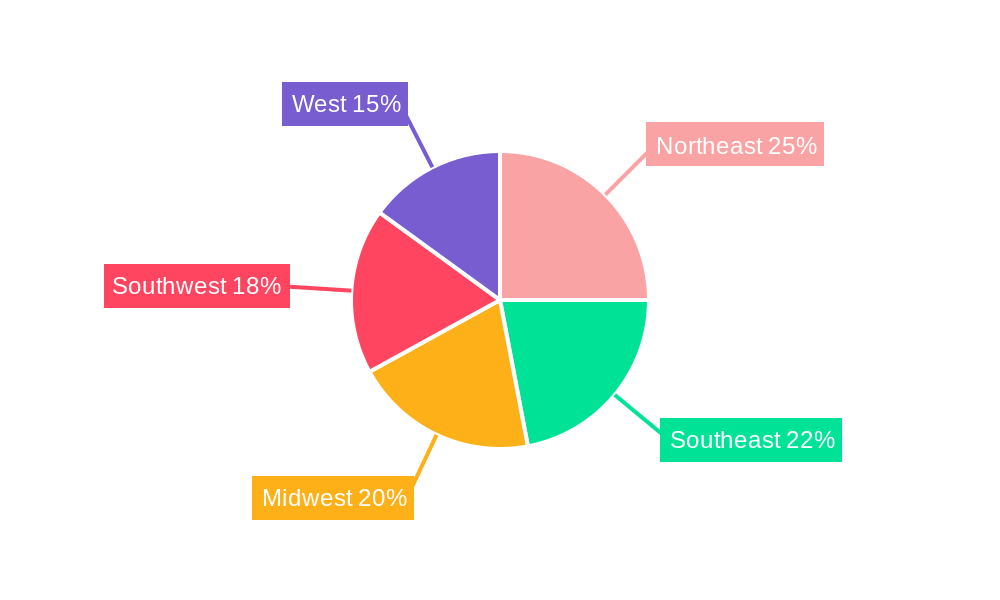
The US automotive aftermarket industry, a significant sector of the broader automotive landscape, is experiencing steady growth, projected to maintain a Compound Annual Growth Rate (CAGR) of 2.00% from 2025 to 2033. This growth is fueled by several key drivers. The aging vehicle fleet in the US necessitates increased repair and replacement parts, significantly boosting demand. Furthermore, the rising adoption of advanced driver-assistance systems (ADAS) and connected car technologies is creating new aftermarket opportunities for specialized parts and services. Consumer preference for vehicle customization and personalization also contributes to market expansion. Segmentation within the market reveals strong growth in passenger car components, particularly in engine and transmission parts, driven by increasing vehicle mileage and the need for regular maintenance. The online sales channel is gaining traction, offering convenience and competitive pricing, yet the offline channel remains dominant, leveraging established relationships with repair shops and garages. Major players like Magna International, Aisin, and Bosch are strategically investing in innovation and expanding their product portfolios to capture market share. Geographic variations exist, with regions like the Northeast and West potentially exhibiting higher growth rates due to factors like higher vehicle density and disposable income. However, challenges remain, including supply chain disruptions and fluctuating raw material prices, which might exert some pressure on market expansion.
Despite these challenges, the long-term outlook for the US automotive aftermarket remains positive. The continued expansion of the vehicle fleet, technological advancements leading to more complex vehicle systems, and the increasing preference for vehicle upkeep and customization ensure sustained growth. Strategic partnerships, mergers, and acquisitions are likely to reshape the competitive landscape as companies strive to consolidate market share and cater to evolving consumer needs. The increasing focus on electric vehicle (EV) technologies presents both challenges and opportunities, with the market needing to adapt to the unique aftermarket needs of this emerging sector. The interplay of these factors contributes to a dynamic and evolving market landscape, offering substantial opportunities for companies that can successfully navigate the complexities of the industry.
USA Automotive Aftermarket Industry Report: 2019-2033
This comprehensive report provides an in-depth analysis of the USA automotive aftermarket industry, covering market dynamics, growth trends, key players, and future outlook. With a focus on key segments like passenger cars and commercial vehicles, and applications spanning engine components, transmission, interior, exterior, and other areas, this report is an essential resource for industry professionals, investors, and strategic planners. The report covers the period 2019-2033, with a base year of 2025 and a forecast period of 2025-2033. Expected market size values are presented in million units.
USA Automotive Aftermarket Industry Market Dynamics & Structure
The USA automotive aftermarket industry is characterized by a moderately concentrated market structure, with a few major players holding significant market share. Technological innovation, particularly in areas like electric vehicles (EVs) and advanced driver-assistance systems (ADAS), is a key driver of growth. Stringent regulatory frameworks, including emission standards and safety regulations, influence product development and market dynamics. The rise of online sales channels is significantly changing the landscape of the aftermarket. Furthermore, the industry witnesses significant Mergers and Acquisitions (M&A) activity, shaping the competitive landscape.
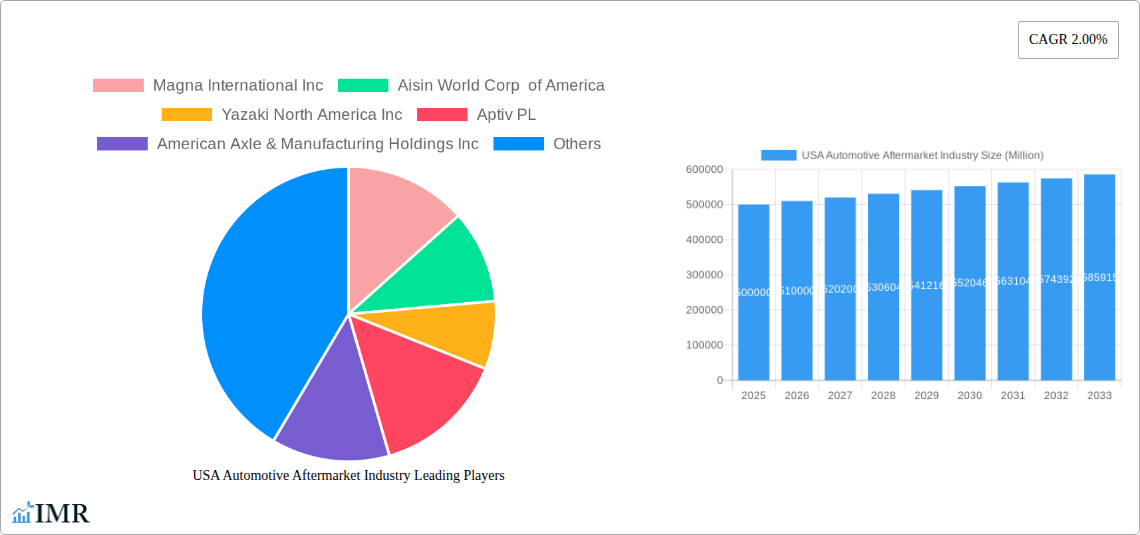
- Market Concentration: Top 5 players hold approximately xx% of the market share in 2025 (estimated).
- Technological Innovation: Focus on lightweight materials, improved fuel efficiency, and EV components are major drivers.
- Regulatory Framework: Compliance with emission and safety standards is crucial, impacting product design and lifecycle.
- Competitive Substitutes: The emergence of alternative repair and maintenance options puts pressure on traditional players.
- End-User Demographics: The aging vehicle fleet and increasing vehicle ownership are key growth factors.
- M&A Trends: High deal volume in the past five years signals consolidation and expansion efforts within the industry (xx deals in 2019-2024).
USA Automotive Aftermarket Industry Growth Trends & Insights
The USA automotive aftermarket industry has experienced significant growth over the past few years, driven by a number of factors, including an aging vehicle parc, rising disposable incomes, increasing vehicle customization, and technological advancements. The market size is expected to witness a Compound Annual Growth Rate (CAGR) of xx% during the forecast period (2025-2033). Market penetration for specific aftermarket products (e.g., performance parts, EV components) will show varying rates depending on consumer preference and vehicle technology adoption. Technological disruptions, such as the rise of connected vehicles and the transition to EVs, are reshaping the industry. Shifts in consumer behavior, including a preference for online purchases and DIY maintenance, are also creating new opportunities and challenges.
Dominant Regions, Countries, or Segments in USA Automotive Aftermarket Industry
The largest segment within the US automotive aftermarket remains the Passenger Car segment, representing xx million units in 2025 (estimated), followed by the Commercial Vehicle segment at xx million units. Within applications, Engine Components and Interior parts constitute the largest sectors. The Offline sales channel currently dominates, but the Online channel shows high growth potential. Growth is geographically dispersed, with significant contributions from all major regions. California is a standout due to its large population and focus on electric vehicle technology.
- Key Drivers (Passenger Cars): High vehicle ownership, aging vehicle fleet, increasing disposable income.
- Key Drivers (Commercial Vehicles): Expansion of logistics and transportation sectors, increased demand for maintenance and repairs due to intensive usage.
- Key Drivers (Engine Components): Growing demand for performance upgrades and emission control systems.
- Key Drivers (Interior): Growing demand for customization and comfort features.
- Key Drivers (Online Sales): Increased internet penetration and e-commerce adoption.
- Key Drivers (Offline Sales): Established distribution network and customer preference for in-person service.
USA Automotive Aftermarket Industry Product Landscape
The aftermarket product landscape is diverse, ranging from routine maintenance parts to high-performance upgrades. Innovation is focused on enhancing durability, fuel efficiency, safety, and vehicle connectivity. Key advancements include the use of lightweight materials, advanced sensors, and integration with telematics systems. Unique selling propositions often center on performance improvements, extended warranties, or ease of installation.
Key Drivers, Barriers & Challenges in USA Automotive Aftermarket Industry
Key Drivers: Increasing vehicle parc, rising demand for vehicle customization, technological advancements leading to new product development, increased focus on vehicle maintenance to extend vehicle lifespan.
Key Challenges: Fluctuating raw material prices, supply chain disruptions (experienced a xx% impact on production in 2022), intense competition, regulatory changes, and shifts in consumer preferences create significant headwinds for the industry.
Emerging Opportunities in USA Automotive Aftermarket Industry
The growth of the electric vehicle market presents significant opportunities for companies offering EV-specific parts and services. The increasing demand for personalized vehicle modifications and accessories also creates a niche market. Expansion into untapped markets, such as autonomous vehicle technologies and aftermarket solutions for connected cars, provides promising avenues for future growth.
Growth Accelerators in the USA Automotive Aftermarket Industry Industry
Strategic partnerships between aftermarket companies and original equipment manufacturers (OEMs) will unlock new growth avenues. Investment in R&D and technological innovation to develop advanced products will further propel market expansion. Increased market penetration in under-served regions and expansion into newer segments like connected car technologies are further accelerating market growth.
Key Players Shaping the USA Automotive Aftermarket Industry Market
- Magna International Inc
- Aisin World Corp of America
- Yazaki North America Inc
- Aptiv PL
- American Axle & Manufacturing Holdings Inc
- Panasonic Automotive Systems Company of America
- Continental AG
- Flex-N-Gate Corporation
- Robert Bosch GmbH
- Lear Corporation
- Faurecia
- DENSO Corporation
- Adient PLC
- ZF Friedrichshafen AG
Notable Milestones in USA Automotive Aftermarket Industry Sector
- December 2022: BorgWarner Inc. announced plans to spin off its Fuel Systems and Aftermarket businesses, focusing on EV technologies.
- August 2022: Cummins Inc. completed its acquisition of Meritor, Inc., strengthening its position in integrated powertrain solutions.
- June 2022: Meritor, Inc. launched the ProTec Independent Front Suspension (IFS) for motorcoaches, expanding its product portfolio.
In-Depth USA Automotive Aftermarket Industry Market Outlook
The USA automotive aftermarket is poised for sustained growth driven by technological advancements, evolving consumer preferences, and increasing vehicle ownership. Strategic partnerships and investments in R&D will be pivotal for players aiming to capitalize on emerging opportunities presented by EV technology, connected cars, and autonomous driving. The market's long-term potential rests on effectively addressing challenges related to supply chain resilience and adapting to the evolving regulatory landscape.
USA Automotive Aftermarket Industry Segmentation
-
1. Vehicle Type
- 1.1. Passenger Cars
- 1.2. Commercial Vehicles
-
2. Application
- 2.1. Engine Components
- 2.2. Transmission
- 2.3. Interior
- 2.4. Exterior
- 2.5. Other Applications
-
3. Sales Channel
- 3.1. Online
- 3.2. Offline
USA Automotive Aftermarket Industry Segmentation By Geography
-
1. North America
- 1.1. United States
- 1.2. Canada
- 1.3. Mexico
-
2. South America
- 2.1. Brazil
- 2.2. Argentina
- 2.3. Rest of South America
-
3. Europe
- 3.1. United Kingdom
- 3.2. Germany
- 3.3. France
- 3.4. Italy
- 3.5. Spain
- 3.6. Russia
- 3.7. Benelux
- 3.8. Nordics
- 3.9. Rest of Europe
-
4. Middle East & Africa
- 4.1. Turkey
- 4.2. Israel
- 4.3. GCC
- 4.4. North Africa
- 4.5. South Africa
- 4.6. Rest of Middle East & Africa
-
5. Asia Pacific
- 5.1. China
- 5.2. India
- 5.3. Japan
- 5.4. South Korea
- 5.5. ASEAN
- 5.6. Oceania
- 5.7. Rest of Asia Pacific
USA Automotive Aftermarket Industry REPORT HIGHLIGHTS
| Aspects | Details |
|---|---|
| Study Period | 2019-2033 |
| Base Year | 2024 |
| Estimated Year | 2025 |
| Forecast Period | 2025-2033 |
| Historical Period | 2019-2024 |
| Growth Rate | CAGR of 2.00% from 2019-2033 |
| Segmentation |
|
Table of Contents
- 1. Introduction
- 1.1. Research Scope
- 1.2. Market Segmentation
- 1.3. Research Methodology
- 1.4. Definitions and Assumptions
- 2. Executive Summary
- 2.1. Introduction
- 3. Market Dynamics
- 3.1. Introduction
- 3.2. Market Drivers
- 3.2.1. Rising Recreational and Motorsports Activities is Expected to Drive the Market; Others
- 3.3. Market Restrains
- 3.3.1. High Value and Maintenance Cost Offered to Restrain the Market Growth; Others
- 3.4. Market Trends
- 3.4.1. Rising Online Aftermarket Automotive Parts and Components Sales
- 4. Market Factor Analysis
- 4.1. Porters Five Forces
- 4.2. Supply/Value Chain
- 4.3. PESTEL analysis
- 4.4. Market Entropy
- 4.5. Patent/Trademark Analysis
- 5. Global USA Automotive Aftermarket Industry Analysis, Insights and Forecast, 2019-2031
- 5.1. Market Analysis, Insights and Forecast - by Vehicle Type
- 5.1.1. Passenger Cars
- 5.1.2. Commercial Vehicles
- 5.2. Market Analysis, Insights and Forecast - by Application
- 5.2.1. Engine Components
- 5.2.2. Transmission
- 5.2.3. Interior
- 5.2.4. Exterior
- 5.2.5. Other Applications
- 5.3. Market Analysis, Insights and Forecast - by Sales Channel
- 5.3.1. Online
- 5.3.2. Offline
- 5.4. Market Analysis, Insights and Forecast - by Region
- 5.4.1. North America
- 5.4.2. South America
- 5.4.3. Europe
- 5.4.4. Middle East & Africa
- 5.4.5. Asia Pacific
- 5.1. Market Analysis, Insights and Forecast - by Vehicle Type
- 6. North America USA Automotive Aftermarket Industry Analysis, Insights and Forecast, 2019-2031
- 6.1. Market Analysis, Insights and Forecast - by Vehicle Type
- 6.1.1. Passenger Cars
- 6.1.2. Commercial Vehicles
- 6.2. Market Analysis, Insights and Forecast - by Application
- 6.2.1. Engine Components
- 6.2.2. Transmission
- 6.2.3. Interior
- 6.2.4. Exterior
- 6.2.5. Other Applications
- 6.3. Market Analysis, Insights and Forecast - by Sales Channel
- 6.3.1. Online
- 6.3.2. Offline
- 6.1. Market Analysis, Insights and Forecast - by Vehicle Type
- 7. South America USA Automotive Aftermarket Industry Analysis, Insights and Forecast, 2019-2031
- 7.1. Market Analysis, Insights and Forecast - by Vehicle Type
- 7.1.1. Passenger Cars
- 7.1.2. Commercial Vehicles
- 7.2. Market Analysis, Insights and Forecast - by Application
- 7.2.1. Engine Components
- 7.2.2. Transmission
- 7.2.3. Interior
- 7.2.4. Exterior
- 7.2.5. Other Applications
- 7.3. Market Analysis, Insights and Forecast - by Sales Channel
- 7.3.1. Online
- 7.3.2. Offline
- 7.1. Market Analysis, Insights and Forecast - by Vehicle Type
- 8. Europe USA Automotive Aftermarket Industry Analysis, Insights and Forecast, 2019-2031
- 8.1. Market Analysis, Insights and Forecast - by Vehicle Type
- 8.1.1. Passenger Cars
- 8.1.2. Commercial Vehicles
- 8.2. Market Analysis, Insights and Forecast - by Application
- 8.2.1. Engine Components
- 8.2.2. Transmission
- 8.2.3. Interior
- 8.2.4. Exterior
- 8.2.5. Other Applications
- 8.3. Market Analysis, Insights and Forecast - by Sales Channel
- 8.3.1. Online
- 8.3.2. Offline
- 8.1. Market Analysis, Insights and Forecast - by Vehicle Type
- 9. Middle East & Africa USA Automotive Aftermarket Industry Analysis, Insights and Forecast, 2019-2031
- 9.1. Market Analysis, Insights and Forecast - by Vehicle Type
- 9.1.1. Passenger Cars
- 9.1.2. Commercial Vehicles
- 9.2. Market Analysis, Insights and Forecast - by Application
- 9.2.1. Engine Components
- 9.2.2. Transmission
- 9.2.3. Interior
- 9.2.4. Exterior
- 9.2.5. Other Applications
- 9.3. Market Analysis, Insights and Forecast - by Sales Channel
- 9.3.1. Online
- 9.3.2. Offline
- 9.1. Market Analysis, Insights and Forecast - by Vehicle Type
- 10. Asia Pacific USA Automotive Aftermarket Industry Analysis, Insights and Forecast, 2019-2031
- 10.1. Market Analysis, Insights and Forecast - by Vehicle Type
- 10.1.1. Passenger Cars
- 10.1.2. Commercial Vehicles
- 10.2. Market Analysis, Insights and Forecast - by Application
- 10.2.1. Engine Components
- 10.2.2. Transmission
- 10.2.3. Interior
- 10.2.4. Exterior
- 10.2.5. Other Applications
- 10.3. Market Analysis, Insights and Forecast - by Sales Channel
- 10.3.1. Online
- 10.3.2. Offline
- 10.1. Market Analysis, Insights and Forecast - by Vehicle Type
- 11. Northeast USA Automotive Aftermarket Industry Analysis, Insights and Forecast, 2019-2031
- 12. Southeast USA Automotive Aftermarket Industry Analysis, Insights and Forecast, 2019-2031
- 13. Midwest USA Automotive Aftermarket Industry Analysis, Insights and Forecast, 2019-2031
- 14. Southwest USA Automotive Aftermarket Industry Analysis, Insights and Forecast, 2019-2031
- 15. West USA Automotive Aftermarket Industry Analysis, Insights and Forecast, 2019-2031
- 16. Competitive Analysis
- 16.1. Global Market Share Analysis 2024
- 16.2. Company Profiles
- 16.2.1 Magna International Inc
- 16.2.1.1. Overview
- 16.2.1.2. Products
- 16.2.1.3. SWOT Analysis
- 16.2.1.4. Recent Developments
- 16.2.1.5. Financials (Based on Availability)
- 16.2.2 Aisin World Corp of America
- 16.2.2.1. Overview
- 16.2.2.2. Products
- 16.2.2.3. SWOT Analysis
- 16.2.2.4. Recent Developments
- 16.2.2.5. Financials (Based on Availability)
- 16.2.3 Yazaki North America Inc
- 16.2.3.1. Overview
- 16.2.3.2. Products
- 16.2.3.3. SWOT Analysis
- 16.2.3.4. Recent Developments
- 16.2.3.5. Financials (Based on Availability)
- 16.2.4 Aptiv PL
- 16.2.4.1. Overview
- 16.2.4.2. Products
- 16.2.4.3. SWOT Analysis
- 16.2.4.4. Recent Developments
- 16.2.4.5. Financials (Based on Availability)
- 16.2.5 American Axle & Manufacturing Holdings Inc
- 16.2.5.1. Overview
- 16.2.5.2. Products
- 16.2.5.3. SWOT Analysis
- 16.2.5.4. Recent Developments
- 16.2.5.5. Financials (Based on Availability)
- 16.2.6 Panasonic Automotive Systems Company of America
- 16.2.6.1. Overview
- 16.2.6.2. Products
- 16.2.6.3. SWOT Analysis
- 16.2.6.4. Recent Developments
- 16.2.6.5. Financials (Based on Availability)
- 16.2.7 Continental AG
- 16.2.7.1. Overview
- 16.2.7.2. Products
- 16.2.7.3. SWOT Analysis
- 16.2.7.4. Recent Developments
- 16.2.7.5. Financials (Based on Availability)
- 16.2.8 Flex-N-Gate Corporation
- 16.2.8.1. Overview
- 16.2.8.2. Products
- 16.2.8.3. SWOT Analysis
- 16.2.8.4. Recent Developments
- 16.2.8.5. Financials (Based on Availability)
- 16.2.9 Robert Bosch GmbH
- 16.2.9.1. Overview
- 16.2.9.2. Products
- 16.2.9.3. SWOT Analysis
- 16.2.9.4. Recent Developments
- 16.2.9.5. Financials (Based on Availability)
- 16.2.10 Lear Corporation
- 16.2.10.1. Overview
- 16.2.10.2. Products
- 16.2.10.3. SWOT Analysis
- 16.2.10.4. Recent Developments
- 16.2.10.5. Financials (Based on Availability)
- 16.2.11 Faurecia
- 16.2.11.1. Overview
- 16.2.11.2. Products
- 16.2.11.3. SWOT Analysis
- 16.2.11.4. Recent Developments
- 16.2.11.5. Financials (Based on Availability)
- 16.2.12 DENSO Corporation
- 16.2.12.1. Overview
- 16.2.12.2. Products
- 16.2.12.3. SWOT Analysis
- 16.2.12.4. Recent Developments
- 16.2.12.5. Financials (Based on Availability)
- 16.2.13 Adient PLC
- 16.2.13.1. Overview
- 16.2.13.2. Products
- 16.2.13.3. SWOT Analysis
- 16.2.13.4. Recent Developments
- 16.2.13.5. Financials (Based on Availability)
- 16.2.14 ZF Friedrichshafen AG
- 16.2.14.1. Overview
- 16.2.14.2. Products
- 16.2.14.3. SWOT Analysis
- 16.2.14.4. Recent Developments
- 16.2.14.5. Financials (Based on Availability)
- 16.2.1 Magna International Inc
List of Figures
- Figure 1: Global USA Automotive Aftermarket Industry Revenue Breakdown (Million, %) by Region 2024 & 2032
- Figure 2: United states USA Automotive Aftermarket Industry Revenue (Million), by Country 2024 & 2032
- Figure 3: United states USA Automotive Aftermarket Industry Revenue Share (%), by Country 2024 & 2032
- Figure 4: North America USA Automotive Aftermarket Industry Revenue (Million), by Vehicle Type 2024 & 2032
- Figure 5: North America USA Automotive Aftermarket Industry Revenue Share (%), by Vehicle Type 2024 & 2032
- Figure 6: North America USA Automotive Aftermarket Industry Revenue (Million), by Application 2024 & 2032
- Figure 7: North America USA Automotive Aftermarket Industry Revenue Share (%), by Application 2024 & 2032
- Figure 8: North America USA Automotive Aftermarket Industry Revenue (Million), by Sales Channel 2024 & 2032
- Figure 9: North America USA Automotive Aftermarket Industry Revenue Share (%), by Sales Channel 2024 & 2032
- Figure 10: North America USA Automotive Aftermarket Industry Revenue (Million), by Country 2024 & 2032
- Figure 11: North America USA Automotive Aftermarket Industry Revenue Share (%), by Country 2024 & 2032
- Figure 12: South America USA Automotive Aftermarket Industry Revenue (Million), by Vehicle Type 2024 & 2032
- Figure 13: South America USA Automotive Aftermarket Industry Revenue Share (%), by Vehicle Type 2024 & 2032
- Figure 14: South America USA Automotive Aftermarket Industry Revenue (Million), by Application 2024 & 2032
- Figure 15: South America USA Automotive Aftermarket Industry Revenue Share (%), by Application 2024 & 2032
- Figure 16: South America USA Automotive Aftermarket Industry Revenue (Million), by Sales Channel 2024 & 2032
- Figure 17: South America USA Automotive Aftermarket Industry Revenue Share (%), by Sales Channel 2024 & 2032
- Figure 18: South America USA Automotive Aftermarket Industry Revenue (Million), by Country 2024 & 2032
- Figure 19: South America USA Automotive Aftermarket Industry Revenue Share (%), by Country 2024 & 2032
- Figure 20: Europe USA Automotive Aftermarket Industry Revenue (Million), by Vehicle Type 2024 & 2032
- Figure 21: Europe USA Automotive Aftermarket Industry Revenue Share (%), by Vehicle Type 2024 & 2032
- Figure 22: Europe USA Automotive Aftermarket Industry Revenue (Million), by Application 2024 & 2032
- Figure 23: Europe USA Automotive Aftermarket Industry Revenue Share (%), by Application 2024 & 2032
- Figure 24: Europe USA Automotive Aftermarket Industry Revenue (Million), by Sales Channel 2024 & 2032
- Figure 25: Europe USA Automotive Aftermarket Industry Revenue Share (%), by Sales Channel 2024 & 2032
- Figure 26: Europe USA Automotive Aftermarket Industry Revenue (Million), by Country 2024 & 2032
- Figure 27: Europe USA Automotive Aftermarket Industry Revenue Share (%), by Country 2024 & 2032
- Figure 28: Middle East & Africa USA Automotive Aftermarket Industry Revenue (Million), by Vehicle Type 2024 & 2032
- Figure 29: Middle East & Africa USA Automotive Aftermarket Industry Revenue Share (%), by Vehicle Type 2024 & 2032
- Figure 30: Middle East & Africa USA Automotive Aftermarket Industry Revenue (Million), by Application 2024 & 2032
- Figure 31: Middle East & Africa USA Automotive Aftermarket Industry Revenue Share (%), by Application 2024 & 2032
- Figure 32: Middle East & Africa USA Automotive Aftermarket Industry Revenue (Million), by Sales Channel 2024 & 2032
- Figure 33: Middle East & Africa USA Automotive Aftermarket Industry Revenue Share (%), by Sales Channel 2024 & 2032
- Figure 34: Middle East & Africa USA Automotive Aftermarket Industry Revenue (Million), by Country 2024 & 2032
- Figure 35: Middle East & Africa USA Automotive Aftermarket Industry Revenue Share (%), by Country 2024 & 2032
- Figure 36: Asia Pacific USA Automotive Aftermarket Industry Revenue (Million), by Vehicle Type 2024 & 2032
- Figure 37: Asia Pacific USA Automotive Aftermarket Industry Revenue Share (%), by Vehicle Type 2024 & 2032
- Figure 38: Asia Pacific USA Automotive Aftermarket Industry Revenue (Million), by Application 2024 & 2032
- Figure 39: Asia Pacific USA Automotive Aftermarket Industry Revenue Share (%), by Application 2024 & 2032
- Figure 40: Asia Pacific USA Automotive Aftermarket Industry Revenue (Million), by Sales Channel 2024 & 2032
- Figure 41: Asia Pacific USA Automotive Aftermarket Industry Revenue Share (%), by Sales Channel 2024 & 2032
- Figure 42: Asia Pacific USA Automotive Aftermarket Industry Revenue (Million), by Country 2024 & 2032
- Figure 43: Asia Pacific USA Automotive Aftermarket Industry Revenue Share (%), by Country 2024 & 2032
List of Tables
- Table 1: Global USA Automotive Aftermarket Industry Revenue Million Forecast, by Region 2019 & 2032
- Table 2: Global USA Automotive Aftermarket Industry Revenue Million Forecast, by Vehicle Type 2019 & 2032
- Table 3: Global USA Automotive Aftermarket Industry Revenue Million Forecast, by Application 2019 & 2032
- Table 4: Global USA Automotive Aftermarket Industry Revenue Million Forecast, by Sales Channel 2019 & 2032
- Table 5: Global USA Automotive Aftermarket Industry Revenue Million Forecast, by Region 2019 & 2032
- Table 6: Global USA Automotive Aftermarket Industry Revenue Million Forecast, by Country 2019 & 2032
- Table 7: Northeast USA Automotive Aftermarket Industry Revenue (Million) Forecast, by Application 2019 & 2032
- Table 8: Southeast USA Automotive Aftermarket Industry Revenue (Million) Forecast, by Application 2019 & 2032
- Table 9: Midwest USA Automotive Aftermarket Industry Revenue (Million) Forecast, by Application 2019 & 2032
- Table 10: Southwest USA Automotive Aftermarket Industry Revenue (Million) Forecast, by Application 2019 & 2032
- Table 11: West USA Automotive Aftermarket Industry Revenue (Million) Forecast, by Application 2019 & 2032
- Table 12: Global USA Automotive Aftermarket Industry Revenue Million Forecast, by Vehicle Type 2019 & 2032
- Table 13: Global USA Automotive Aftermarket Industry Revenue Million Forecast, by Application 2019 & 2032
- Table 14: Global USA Automotive Aftermarket Industry Revenue Million Forecast, by Sales Channel 2019 & 2032
- Table 15: Global USA Automotive Aftermarket Industry Revenue Million Forecast, by Country 2019 & 2032
- Table 16: United States USA Automotive Aftermarket Industry Revenue (Million) Forecast, by Application 2019 & 2032
- Table 17: Canada USA Automotive Aftermarket Industry Revenue (Million) Forecast, by Application 2019 & 2032
- Table 18: Mexico USA Automotive Aftermarket Industry Revenue (Million) Forecast, by Application 2019 & 2032
- Table 19: Global USA Automotive Aftermarket Industry Revenue Million Forecast, by Vehicle Type 2019 & 2032
- Table 20: Global USA Automotive Aftermarket Industry Revenue Million Forecast, by Application 2019 & 2032
- Table 21: Global USA Automotive Aftermarket Industry Revenue Million Forecast, by Sales Channel 2019 & 2032
- Table 22: Global USA Automotive Aftermarket Industry Revenue Million Forecast, by Country 2019 & 2032
- Table 23: Brazil USA Automotive Aftermarket Industry Revenue (Million) Forecast, by Application 2019 & 2032
- Table 24: Argentina USA Automotive Aftermarket Industry Revenue (Million) Forecast, by Application 2019 & 2032
- Table 25: Rest of South America USA Automotive Aftermarket Industry Revenue (Million) Forecast, by Application 2019 & 2032
- Table 26: Global USA Automotive Aftermarket Industry Revenue Million Forecast, by Vehicle Type 2019 & 2032
- Table 27: Global USA Automotive Aftermarket Industry Revenue Million Forecast, by Application 2019 & 2032
- Table 28: Global USA Automotive Aftermarket Industry Revenue Million Forecast, by Sales Channel 2019 & 2032
- Table 29: Global USA Automotive Aftermarket Industry Revenue Million Forecast, by Country 2019 & 2032
- Table 30: United Kingdom USA Automotive Aftermarket Industry Revenue (Million) Forecast, by Application 2019 & 2032
- Table 31: Germany USA Automotive Aftermarket Industry Revenue (Million) Forecast, by Application 2019 & 2032
- Table 32: France USA Automotive Aftermarket Industry Revenue (Million) Forecast, by Application 2019 & 2032
- Table 33: Italy USA Automotive Aftermarket Industry Revenue (Million) Forecast, by Application 2019 & 2032
- Table 34: Spain USA Automotive Aftermarket Industry Revenue (Million) Forecast, by Application 2019 & 2032
- Table 35: Russia USA Automotive Aftermarket Industry Revenue (Million) Forecast, by Application 2019 & 2032
- Table 36: Benelux USA Automotive Aftermarket Industry Revenue (Million) Forecast, by Application 2019 & 2032
- Table 37: Nordics USA Automotive Aftermarket Industry Revenue (Million) Forecast, by Application 2019 & 2032
- Table 38: Rest of Europe USA Automotive Aftermarket Industry Revenue (Million) Forecast, by Application 2019 & 2032
- Table 39: Global USA Automotive Aftermarket Industry Revenue Million Forecast, by Vehicle Type 2019 & 2032
- Table 40: Global USA Automotive Aftermarket Industry Revenue Million Forecast, by Application 2019 & 2032
- Table 41: Global USA Automotive Aftermarket Industry Revenue Million Forecast, by Sales Channel 2019 & 2032
- Table 42: Global USA Automotive Aftermarket Industry Revenue Million Forecast, by Country 2019 & 2032
- Table 43: Turkey USA Automotive Aftermarket Industry Revenue (Million) Forecast, by Application 2019 & 2032
- Table 44: Israel USA Automotive Aftermarket Industry Revenue (Million) Forecast, by Application 2019 & 2032
- Table 45: GCC USA Automotive Aftermarket Industry Revenue (Million) Forecast, by Application 2019 & 2032
- Table 46: North Africa USA Automotive Aftermarket Industry Revenue (Million) Forecast, by Application 2019 & 2032
- Table 47: South Africa USA Automotive Aftermarket Industry Revenue (Million) Forecast, by Application 2019 & 2032
- Table 48: Rest of Middle East & Africa USA Automotive Aftermarket Industry Revenue (Million) Forecast, by Application 2019 & 2032
- Table 49: Global USA Automotive Aftermarket Industry Revenue Million Forecast, by Vehicle Type 2019 & 2032
- Table 50: Global USA Automotive Aftermarket Industry Revenue Million Forecast, by Application 2019 & 2032
- Table 51: Global USA Automotive Aftermarket Industry Revenue Million Forecast, by Sales Channel 2019 & 2032
- Table 52: Global USA Automotive Aftermarket Industry Revenue Million Forecast, by Country 2019 & 2032
- Table 53: China USA Automotive Aftermarket Industry Revenue (Million) Forecast, by Application 2019 & 2032
- Table 54: India USA Automotive Aftermarket Industry Revenue (Million) Forecast, by Application 2019 & 2032
- Table 55: Japan USA Automotive Aftermarket Industry Revenue (Million) Forecast, by Application 2019 & 2032
- Table 56: South Korea USA Automotive Aftermarket Industry Revenue (Million) Forecast, by Application 2019 & 2032
- Table 57: ASEAN USA Automotive Aftermarket Industry Revenue (Million) Forecast, by Application 2019 & 2032
- Table 58: Oceania USA Automotive Aftermarket Industry Revenue (Million) Forecast, by Application 2019 & 2032
- Table 59: Rest of Asia Pacific USA Automotive Aftermarket Industry Revenue (Million) Forecast, by Application 2019 & 2032
Frequently Asked Questions
1. What is the projected Compound Annual Growth Rate (CAGR) of the USA Automotive Aftermarket Industry?
The projected CAGR is approximately 2.00%.
2. Which companies are prominent players in the USA Automotive Aftermarket Industry?
Key companies in the market include Magna International Inc, Aisin World Corp of America, Yazaki North America Inc, Aptiv PL, American Axle & Manufacturing Holdings Inc, Panasonic Automotive Systems Company of America, Continental AG, Flex-N-Gate Corporation, Robert Bosch GmbH, Lear Corporation, Faurecia, DENSO Corporation, Adient PLC, ZF Friedrichshafen AG.
3. What are the main segments of the USA Automotive Aftermarket Industry?
The market segments include Vehicle Type, Application, Sales Channel.
4. Can you provide details about the market size?
The market size is estimated to be USD XX Million as of 2022.
5. What are some drivers contributing to market growth?
Rising Recreational and Motorsports Activities is Expected to Drive the Market; Others.
6. What are the notable trends driving market growth?
Rising Online Aftermarket Automotive Parts and Components Sales.
7. Are there any restraints impacting market growth?
High Value and Maintenance Cost Offered to Restrain the Market Growth; Others.
8. Can you provide examples of recent developments in the market?
December 2022: BorgWarner Inc announced plans to spin off their Fuel Systems and Aftermarket businesses into a separate, publicly traded company, which they are currently calling "NewCo." NewCo also intends to capitalize on growth trends in gasoline direct injection (GDI) and hydrogen injection systems. With this announcement, BorgWarner believes it will eventually meet or exceed its stated target of 25% revenue from EVs by 2025.
9. What pricing options are available for accessing the report?
Pricing options include single-user, multi-user, and enterprise licenses priced at USD 3800, USD 4500, and USD 5800 respectively.
10. Is the market size provided in terms of value or volume?
The market size is provided in terms of value, measured in Million.
11. Are there any specific market keywords associated with the report?
Yes, the market keyword associated with the report is "USA Automotive Aftermarket Industry," which aids in identifying and referencing the specific market segment covered.
12. How do I determine which pricing option suits my needs best?
The pricing options vary based on user requirements and access needs. Individual users may opt for single-user licenses, while businesses requiring broader access may choose multi-user or enterprise licenses for cost-effective access to the report.
13. Are there any additional resources or data provided in the USA Automotive Aftermarket Industry report?
While the report offers comprehensive insights, it's advisable to review the specific contents or supplementary materials provided to ascertain if additional resources or data are available.
14. How can I stay updated on further developments or reports in the USA Automotive Aftermarket Industry?
To stay informed about further developments, trends, and reports in the USA Automotive Aftermarket Industry, consider subscribing to industry newsletters, following relevant companies and organizations, or regularly checking reputable industry news sources and publications.
Methodology
Step 1 - Identification of Relevant Samples Size from Population Database


Step 2 - Approaches for Defining Global Market Size (Value, Volume* & Price*)

Note*: In applicable scenarios
Step 3 - Data Sources
Primary Research
- Web Analytics
- Survey Reports
- Research Institute
- Latest Research Reports
- Opinion Leaders
Secondary Research
- Annual Reports
- White Paper
- Latest Press Release
- Industry Association
- Paid Database
- Investor Presentations

Step 4 - Data Triangulation
Involves using different sources of information in order to increase the validity of a study
These sources are likely to be stakeholders in a program - participants, other researchers, program staff, other community members, and so on.
Then we put all data in single framework & apply various statistical tools to find out the dynamic on the market.
During the analysis stage, feedback from the stakeholder groups would be compared to determine areas of agreement as well as areas of divergence
