

Key Insights
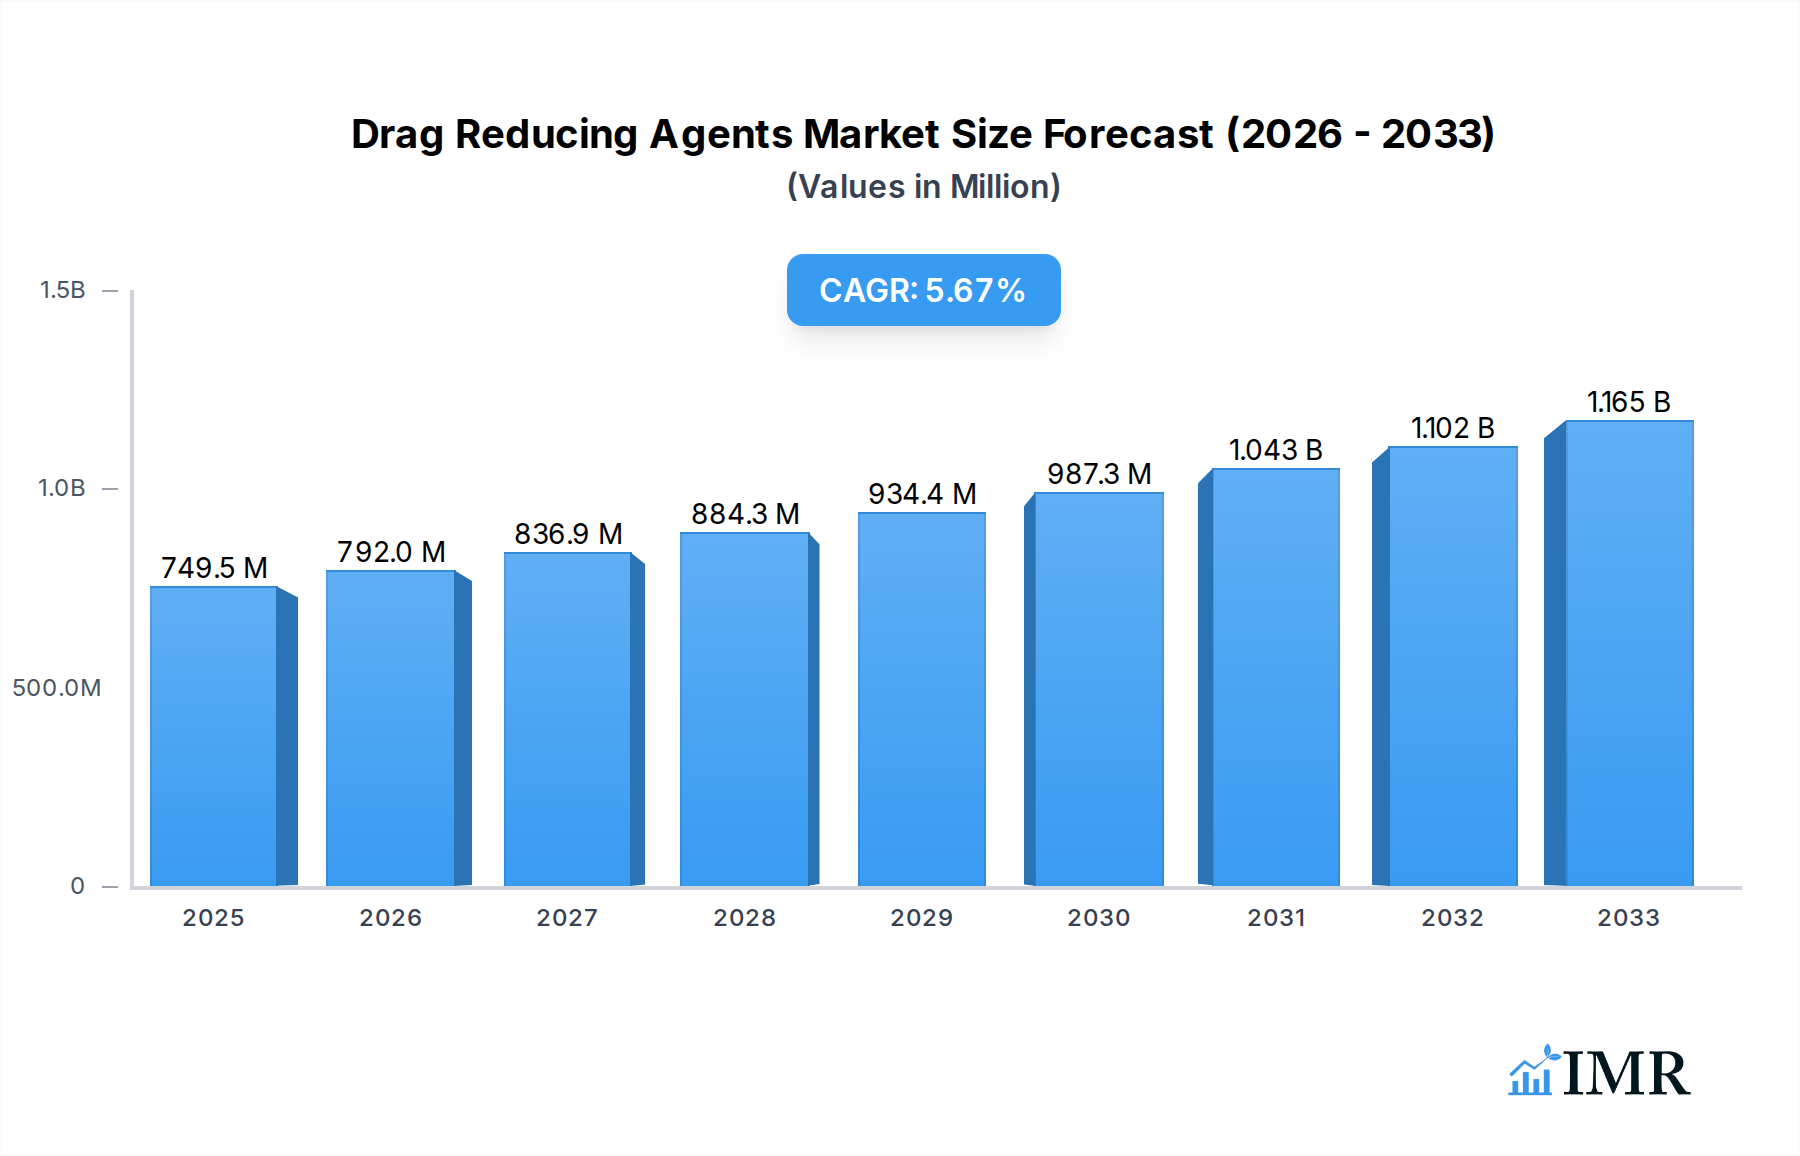
The global Drag Reducing Agents (DRA) market is poised for substantial growth, projected to reach $749.5 million by 2025, driven by an anticipated CAGR of 5.7% throughout the forecast period. This expansion is largely fueled by the increasing global demand for crude oil and refined products, necessitating enhanced efficiency in transportation and processing. The growing complexity of crude oil extraction, including the rise of heavier and more viscous crudes, directly escalates the need for effective DRA solutions. These agents play a crucial role in reducing friction within pipelines, thereby increasing flow rates, reducing pumping energy requirements, and ultimately lowering operational costs for oil and gas companies. The market's trajectory is further supported by ongoing investments in infrastructure development and the continuous pursuit of operational optimization across the energy sector.

Drag Reducing Agents Market Market Size (In Million)
Key trends shaping the DRA market include a heightened focus on the development of environmentally friendly and highly efficient DRA formulations. Advancements in polymer chemistry are leading to more potent agents that can function effectively in diverse operating conditions and with various crude oil types. The application spectrum is broadening, with significant growth anticipated in the handling of heavy/asphaltic crude and multiphase fluids, reflecting the evolving nature of global oil reserves. While the market presents robust growth opportunities, challenges such as stringent environmental regulations regarding chemical usage and disposal, alongside the inherent volatility of crude oil prices, could present headwinds. Nonetheless, the fundamental requirement for efficient fluid transport in the energy industry ensures a sustained demand for drag reducing agents.
Drag Reducing Agents Market Company Market Share
Drag Reducing Agents Market: Revolutionizing Fluid Flow Efficiency
This comprehensive report delivers an in-depth analysis of the global Drag Reducing Agents (DRA) market, forecasting significant growth and evolution throughout the study period of 2019–2033, with a base year of 2025. Explore critical market dynamics, growth trends, regional dominance, product innovations, key drivers, barriers, emerging opportunities, and pivotal industry developments. The report provides essential insights for stakeholders in the oil and gas, petrochemical, and related industries, aiming to optimize operational efficiency and enhance profitability. Values are presented in millions of units, with a forecast period spanning 2025–2033 and historical data from 2019–2024.
Drag Reducing Agents Market Market Dynamics & Structure
The Drag Reducing Agents (DRA) market is characterized by a moderately concentrated landscape, driven by continuous technological innovation and an increasing emphasis on operational efficiency within the oil and gas sector. Key players are actively investing in R&D to develop more potent and environmentally friendly DRA formulations. Regulatory frameworks, while generally supportive of efficiency improvements, can influence product approvals and application guidelines. Competitive product substitutes, primarily advanced pumping technologies and improved pipeline designs, present an ongoing challenge, but DRAs offer a cost-effective solution for existing infrastructure. End-user demographics are dominated by major oil and gas producers, refiners, and midstream companies seeking to maximize throughput and minimize energy consumption. Mergers and acquisitions (M&A) are a notable trend, as larger entities seek to consolidate market share and acquire specialized technologies.
- Market Concentration: Moderately concentrated with key players investing in R&D.
- Technological Innovation: Driven by the need for higher efficiency and eco-friendly solutions.
- Regulatory Frameworks: Generally supportive, focusing on operational safety and efficiency standards.
- Competitive Substitutes: Advanced pumping systems and pipeline design innovations.
- End-User Demographics: Primarily oil and gas majors, refiners, and midstream operators.
- M&A Trends: Strategic acquisitions to enhance technological portfolios and market reach.
Drag Reducing Agents Market Growth Trends & Insights
The global Drag Reducing Agents (DRA) market is poised for robust expansion, projected to witness substantial growth driven by the escalating demand for enhanced oil and gas transportation efficiency. The increasing complexity of extracting and transporting hydrocarbons, coupled with a global push for optimized energy infrastructure, is fueling the adoption of DRAs across various applications. From a market size perspective, the DRA market is estimated to grow from approximately $3,800 million in 2025 to an impressive $6,200 million by 2033, exhibiting a Compound Annual Growth Rate (CAGR) of around 6.3% during the forecast period. This growth is underpinned by rising exploration and production activities, particularly in deepwater and unconventional reservoirs, which necessitate advanced flow assurance solutions.
Technological disruptions, such as the development of novel polymer-based DRAs with improved thermal stability and shear resistance, are further stimulating market penetration. Consumer behavior shifts are evident, with operators increasingly prioritizing cost-effectiveness and reduced environmental impact, factors where DRAs excel by minimizing energy consumption and increasing pipeline throughput without significant infrastructure modifications. The market penetration of DRAs is expected to deepen as more companies recognize their significant return on investment. Furthermore, the evolving landscape of multiphase fluid transportation presents a burgeoning opportunity, as DRAs demonstrate efficacy in managing complex flow regimes. The market is also influenced by global energy policies that encourage efficiency and sustainability, thereby promoting the use of drag-reducing technologies. The continued development of specialized DRA formulations tailored for specific crude oil types and operational conditions will be a key determinant of future market evolution, ensuring sustained demand and market leadership.
Dominant Regions, Countries, or Segments in Drag Reducing Agents Market
The Low- and Medium-phase Crude Oil application segment stands as the dominant force within the global Drag Reducing Agents (DRA) market, projected to command the largest market share. This dominance is intrinsically linked to the sheer volume of low- and medium-phase crude oil transported globally through extensive pipeline networks. The economic policies and infrastructure development in key oil-producing regions, such as North America and the Middle East, significantly amplify the demand for DRAs in this segment. For instance, the United States, with its vast shale oil production, relies heavily on efficient pipeline transportation, making DRAs indispensable for optimizing flow rates and reducing operational costs.
- Dominant Segment: Low- and Medium-phase Crude Oil.
- Key Drivers in Dominant Segment:
- High global transport volumes of this crude type.
- Extensive existing pipeline infrastructure requiring optimization.
- Cost-effectiveness of DRAs in enhancing throughput.
- Increased production from unconventional sources necessitating efficient transport.
- Regional Dominance Factors:
- North America: Extensive shale oil production in the US, significant pipeline network, and a strong focus on operational efficiency and cost reduction. The market share here is estimated to be around 35% of the global DRA market in 2025.
- Middle East: Significant crude oil production and export, with ongoing investments in pipeline infrastructure modernization and expansion, driving demand for flow assurance solutions. The market share in this region is estimated at approximately 25% in 2025.
- Asia Pacific: Growing energy demand and expansion of refining capacities are leading to increased crude oil imports and the development of new pipeline projects, contributing to market growth. The estimated market share for this region is around 20% in 2025.
The inherent properties of low- and medium-phase crude oils, such as their viscosity and flow characteristics, make them particularly amenable to the significant benefits offered by DRAs. By reducing frictional pressure drops, DRAs enable higher flow rates, extend the lifespan of existing infrastructure, and reduce energy consumption, thereby directly contributing to the profitability of upstream and midstream operations. The projected growth potential within this segment remains exceptionally high, driven by continuous advancements in DRA technology and the ongoing need for efficient and sustainable energy transportation solutions.
Drag Reducing Agents Market Product Landscape
The product landscape of the Drag Reducing Agents (DRA) market is defined by continuous innovation focused on enhancing performance and expanding application capabilities. Leading manufacturers are developing advanced polymer-based DRAs, often characterized by their high molecular weight and specific chemical structures, designed to effectively reduce turbulent flow resistance in pipelines. These products are primarily delivered as solutions or dispersions, ensuring ease of injection and optimal mixing with the fluid being transported. Unique selling propositions include improved thermal stability, resistance to shear degradation, and biodegradability, catering to increasing environmental regulations. Technological advancements are enabling the development of customized DRA formulations for specific crude oil compositions, multiphase fluids, and diverse operating temperatures and pressures, ensuring maximum efficacy and minimal impact on fluid quality.
Key Drivers, Barriers & Challenges in Drag Reducing Agents Market
Key Drivers:
- Increasing Demand for Operational Efficiency: The primary driver is the continuous need for oil and gas companies to maximize throughput, reduce energy consumption, and lower operational costs in their transportation networks.
- Growth in Unconventional Oil and Gas Production: The expansion of shale oil and deepwater exploration necessitates advanced flow assurance solutions like DRAs to overcome the challenges of transporting these complex hydrocarbon streams.
- Aging Infrastructure Modernization: Many existing pipeline systems are undergoing upgrades or require enhanced performance, making DRAs a cost-effective solution compared to extensive infrastructure replacement.
- Environmental Regulations and Sustainability Focus: DRAs contribute to reduced energy consumption, indirectly lowering the carbon footprint associated with fluid transportation, aligning with growing environmental concerns.
Barriers & Challenges:
- High Initial Cost of R&D and Production: Developing and manufacturing advanced DRA formulations can involve significant research and development expenditure, impacting initial product pricing.
- Limited Awareness and Adoption in Certain Markets: While established in major oil-producing regions, adoption rates can be lower in emerging markets due to lack of awareness or perceived complexity.
- Potential for Fouling or Residue Accumulation: Improper application or formulation can lead to residue build-up in pipelines, requiring careful monitoring and maintenance.
- Competition from Alternative Technologies: While DRAs offer distinct advantages, advancements in areas like smart pipelines and advanced pumping systems present ongoing competitive pressure.
- Supply Chain Disruptions and Raw Material Volatility: The production of DRAs relies on specific chemical inputs, making the market susceptible to global supply chain issues and raw material price fluctuations.
Emerging Opportunities in Drag Reducing Agents Market
Emerging opportunities in the Drag Reducing Agents (DRA) market lie in the development of advanced, environmentally friendly formulations and their application in novel scenarios. The increasing focus on sustainable energy solutions is creating a demand for biodegradable DRAs with minimal environmental impact. Furthermore, the expansion of liquefied natural gas (LNG) transportation and the growing complexity of transporting refined products offer significant untapped markets. The development of intelligent injection systems and real-time monitoring technologies for DRA performance will also unlock new avenues for growth, allowing for optimized usage and enhanced efficiency. Expansion into other industrial fluid transport applications, beyond oil and gas, also presents a promising avenue for market penetration.
Growth Accelerators in the Drag Reducing Agents Market Industry
Growth in the Drag Reducing Agents (DRA) market is significantly accelerated by ongoing technological breakthroughs that enhance the efficacy and applicability of these chemicals. Innovations in polymer science are leading to the creation of DRAs with superior thermal stability, shear resistance, and compatibility with a wider range of fluids, including heavier crudes and complex multiphase systems. Strategic partnerships between DRA manufacturers and major oil and gas companies are crucial, facilitating the co-development of tailored solutions for specific field challenges and accelerating market adoption. Furthermore, the global expansion of pipeline infrastructure, particularly in developing regions and for the transportation of unconventional energy resources, acts as a powerful market expansion strategy, directly driving the demand for flow assurance chemicals like DRAs.
Key Players Shaping the Drag Reducing Agents Market Market
- Baker Hughes
- Dorf Ketal Chemicals India Pvt Ltd
- Flowchem
- Indian Oil Corp Ltd
- Innospec
- Jiangyin Huaheng Auxiliary Co Ltd
- LiquidPower Specialty Products Inc
- NuGenTec
- Oil Flux Americas
- The Zoranoc Oilfield Chemical
Notable Milestones in Drag Reducing Agents Market Sector
- August 2022: Baker Hughes announced an agreement to acquire Quest Integrity, a subsidiary of Team, Inc. This acquisition aims to enhance Baker Hughes' capabilities in technology-enabled asset inspection and reliability management solutions for industries including pipelines and refineries. Baker Hughes' pipeline inspection services identify abnormalities that may necessitate the use of drag reducers to decrease frictional pressure drops during fluid flow.
- October 2021: LiquidPower Specialty Products Inc. (LSPI) formed a strategic partnership with Safe Marine Transfer, LLC (SMT) to supply their drag-reducing agents (DRA) for subsea applications using SMT's innovative all-electric dual barrier subsea storage and injection unit. This collaboration aims to significantly boost output and increase flow rates in existing subsea production and collection lines.
In-Depth Drag Reducing Agents Market Market Outlook
The future outlook for the Drag Reducing Agents (DRA) market is exceptionally promising, fueled by a confluence of factors driving sustained growth and innovation. The ongoing global energy demand, coupled with the imperative for efficient and environmentally responsible fluid transportation, positions DRAs as critical solutions. Key growth accelerators include the continuous development of next-generation DRAs with enhanced performance characteristics and a reduced environmental footprint, alongside strategic collaborations between chemical suppliers and major energy producers. The expansion of infrastructure for transporting unconventional oil and gas resources, particularly in challenging geographies, will further propel market adoption. As the industry increasingly prioritizes operational optimization and cost-effectiveness, the strategic implementation of drag-reducing agents will remain a cornerstone for maximizing profitability and ensuring the seamless flow of essential energy resources worldwide.
Drag Reducing Agents Market Segmentation
-
1. Application
- 1.1. Low- and Medium-phase Crude Oil
- 1.2. Heavy/Asphaltic Crude
- 1.3. Multiphase Fluid
- 1.4. Refined Products
- 1.5. Other Applications
Drag Reducing Agents Market Segmentation By Geography
-
1. Asia Pacific
- 1.1. China
- 1.2. India
- 1.3. Japan
- 1.4. South Korea
- 1.5. Rest of Asia Pacific
-
2. North America
- 2.1. United States
- 2.2. Canada
- 2.3. Mexico
-
3. Europe
- 3.1. Germany
- 3.2. United Kingdom
- 3.3. France
- 3.4. Italy
- 3.5. Rest of Europe
-
4. South America
- 4.1. Brazil
- 4.2. Argentina
- 4.3. Rest of South America
-
5. Middle East and Africa
- 5.1. South Africa
- 5.2. Saudi Arabia
- 5.3. Rest of Middle East and Africa
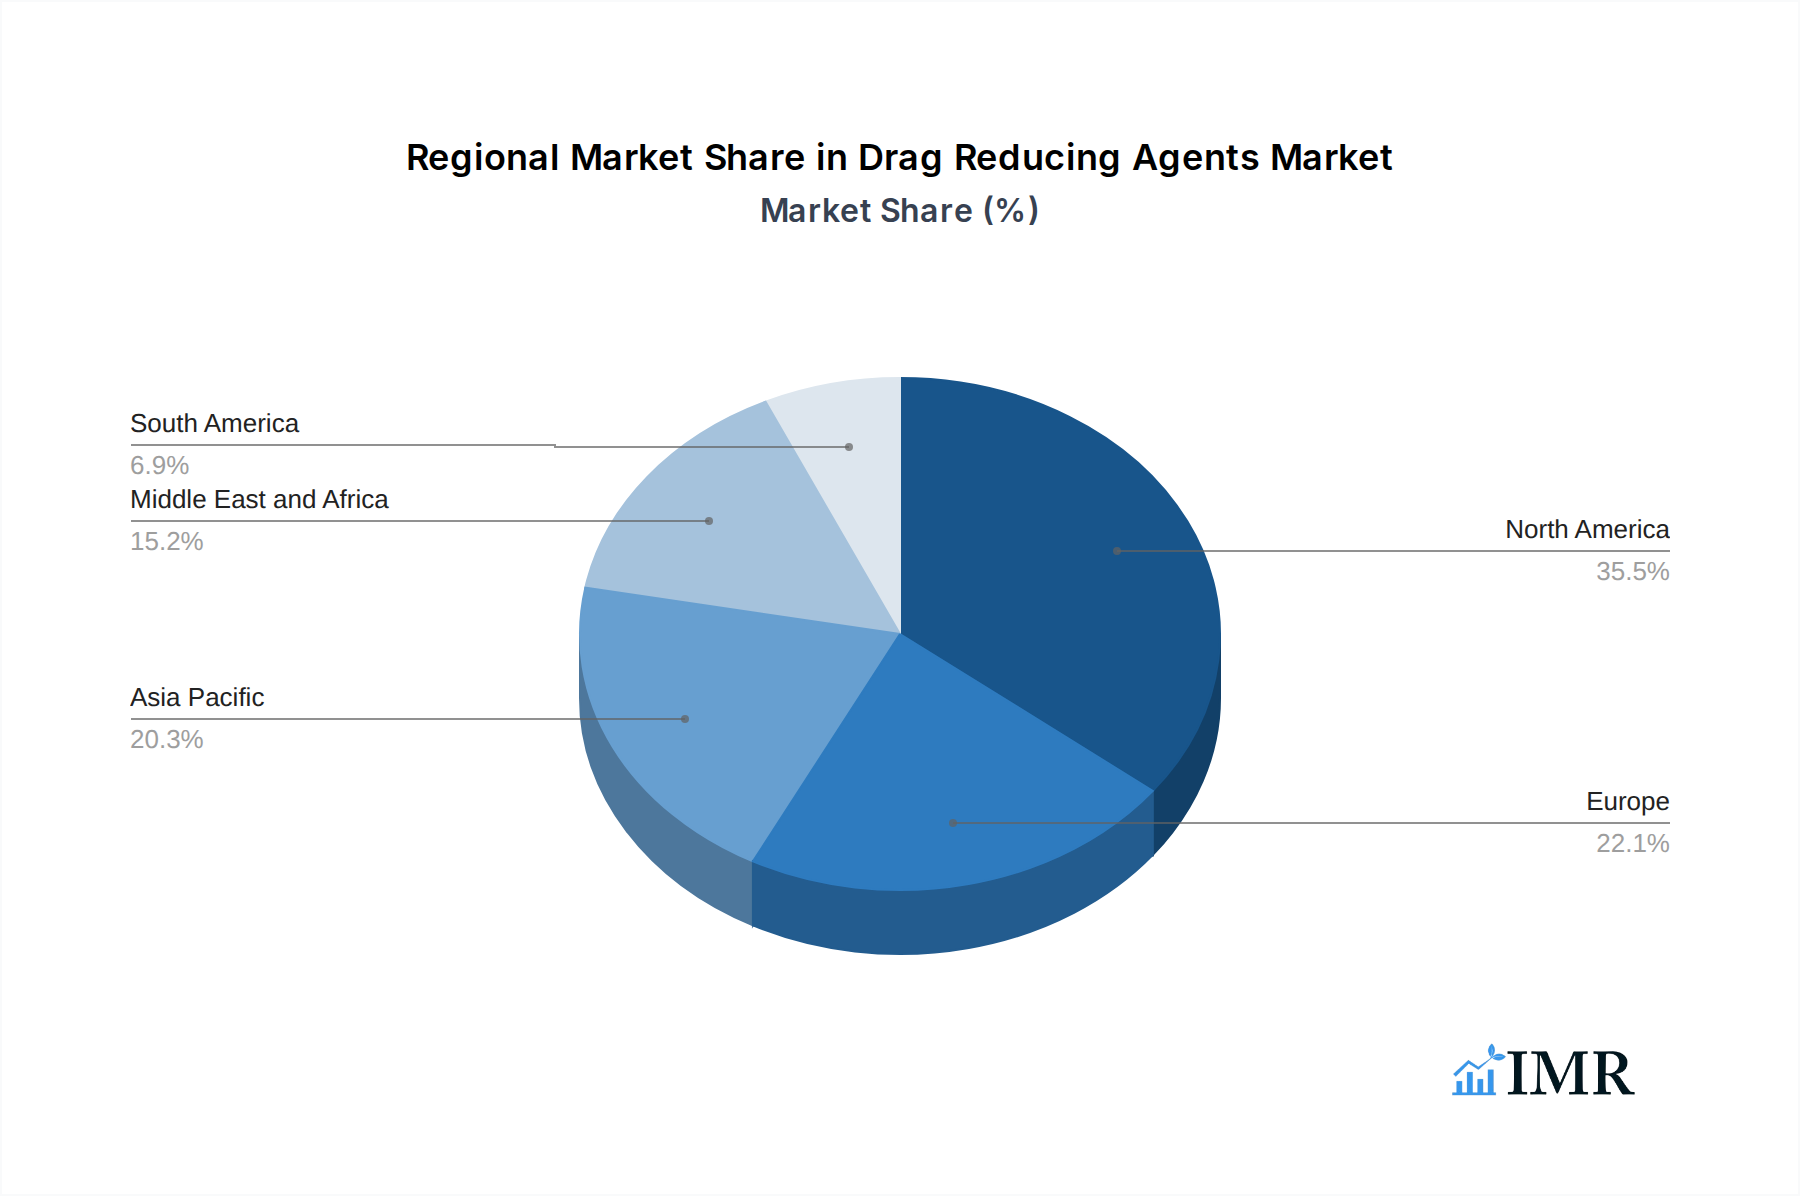
Drag Reducing Agents Market Regional Market Share
Geographic Coverage of Drag Reducing Agents Market
Drag Reducing Agents Market REPORT HIGHLIGHTS
| Aspects | Details |
|---|---|
| Study Period | 2020-2034 |
| Base Year | 2025 |
| Estimated Year | 2026 |
| Forecast Period | 2026-2034 |
| Historical Period | 2020-2025 |
| Growth Rate | CAGR of 5.7% from 2020-2034 |
| Segmentation |
|
Table of Contents
- 1. Introduction
- 1.1. Research Scope
- 1.2. Market Segmentation
- 1.3. Research Objective
- 1.4. Definitions and Assumptions
- 2. Executive Summary
- 2.1. Market Snapshot
- 3. Market Dynamics
- 3.1. Market Drivers
- 3.2. Market Restrains
- 3.3. Market Trends
- 3.4. Market Opportunities
- 4. Market Factor Analysis
- 4.1. Porters Five Forces
- 4.1.1. Bargaining Power of Suppliers
- 4.1.2. Bargaining Power of Buyers
- 4.1.3. Threat of New Entrants
- 4.1.4. Threat of Substitutes
- 4.1.5. Competitive Rivalry
- 4.2. PESTEL analysis
- 4.3. BCG Analysis
- 4.3.1. Stars (High Growth, High Market Share)
- 4.3.2. Cash Cows (Low Growth, High Market Share)
- 4.3.3. Question Mark (High Growth, Low Market Share)
- 4.3.4. Dogs (Low Growth, Low Market Share)
- 4.4. Ansoff Matrix Analysis
- 4.5. Supply Chain Analysis
- 4.6. Regulatory Landscape
- 4.7. Current Market Potential and Opportunity Assessment (TAM–SAM–SOM Framework)
- 4.8. IMR Analyst Note
- 4.1. Porters Five Forces
- 5. Market Analysis, Insights and Forecast 2021-2033
- 5.1. Market Analysis, Insights and Forecast - by Application
- 5.1.1. Low- and Medium-phase Crude Oil
- 5.1.2. Heavy/Asphaltic Crude
- 5.1.3. Multiphase Fluid
- 5.1.4. Refined Products
- 5.1.5. Other Applications
- 5.2. Market Analysis, Insights and Forecast - by Region
- 5.2.1. Asia Pacific
- 5.2.2. North America
- 5.2.3. Europe
- 5.2.4. South America
- 5.2.5. Middle East and Africa
- 5.1. Market Analysis, Insights and Forecast - by Application
- 6. Global Drag Reducing Agents Market Analysis, Insights and Forecast, 2021-2033
- 6.1. Market Analysis, Insights and Forecast - by Application
- 6.1.1. Low- and Medium-phase Crude Oil
- 6.1.2. Heavy/Asphaltic Crude
- 6.1.3. Multiphase Fluid
- 6.1.4. Refined Products
- 6.1.5. Other Applications
- 6.1. Market Analysis, Insights and Forecast - by Application
- 7. Asia Pacific Drag Reducing Agents Market Analysis, Insights and Forecast, 2020-2032
- 7.1. Market Analysis, Insights and Forecast - by Application
- 7.1.1. Low- and Medium-phase Crude Oil
- 7.1.2. Heavy/Asphaltic Crude
- 7.1.3. Multiphase Fluid
- 7.1.4. Refined Products
- 7.1.5. Other Applications
- 7.1. Market Analysis, Insights and Forecast - by Application
- 8. North America Drag Reducing Agents Market Analysis, Insights and Forecast, 2020-2032
- 8.1. Market Analysis, Insights and Forecast - by Application
- 8.1.1. Low- and Medium-phase Crude Oil
- 8.1.2. Heavy/Asphaltic Crude
- 8.1.3. Multiphase Fluid
- 8.1.4. Refined Products
- 8.1.5. Other Applications
- 8.1. Market Analysis, Insights and Forecast - by Application
- 9. Europe Drag Reducing Agents Market Analysis, Insights and Forecast, 2020-2032
- 9.1. Market Analysis, Insights and Forecast - by Application
- 9.1.1. Low- and Medium-phase Crude Oil
- 9.1.2. Heavy/Asphaltic Crude
- 9.1.3. Multiphase Fluid
- 9.1.4. Refined Products
- 9.1.5. Other Applications
- 9.1. Market Analysis, Insights and Forecast - by Application
- 10. South America Drag Reducing Agents Market Analysis, Insights and Forecast, 2020-2032
- 10.1. Market Analysis, Insights and Forecast - by Application
- 10.1.1. Low- and Medium-phase Crude Oil
- 10.1.2. Heavy/Asphaltic Crude
- 10.1.3. Multiphase Fluid
- 10.1.4. Refined Products
- 10.1.5. Other Applications
- 10.1. Market Analysis, Insights and Forecast - by Application
- 11. Middle East and Africa Drag Reducing Agents Market Analysis, Insights and Forecast, 2020-2032
- 11.1. Market Analysis, Insights and Forecast - by Application
- 11.1.1. Low- and Medium-phase Crude Oil
- 11.1.2. Heavy/Asphaltic Crude
- 11.1.3. Multiphase Fluid
- 11.1.4. Refined Products
- 11.1.5. Other Applications
- 11.1. Market Analysis, Insights and Forecast - by Application
- 12. Competitive Analysis
- 12.1. Company Profiles
- 12.1.1 Baker Hughes
- 12.1.1.1. Company Overview
- 12.1.1.2. Products
- 12.1.1.3. Company Financials
- 12.1.1.4. SWOT Analysis
- 12.1.2 Dorf Ketal Chemicals India Pvt Ltd
- 12.1.2.1. Company Overview
- 12.1.2.2. Products
- 12.1.2.3. Company Financials
- 12.1.2.4. SWOT Analysis
- 12.1.3 Flowchem
- 12.1.3.1. Company Overview
- 12.1.3.2. Products
- 12.1.3.3. Company Financials
- 12.1.3.4. SWOT Analysis
- 12.1.4 Indian Oil Corp Ltd
- 12.1.4.1. Company Overview
- 12.1.4.2. Products
- 12.1.4.3. Company Financials
- 12.1.4.4. SWOT Analysis
- 12.1.5 Innospec
- 12.1.5.1. Company Overview
- 12.1.5.2. Products
- 12.1.5.3. Company Financials
- 12.1.5.4. SWOT Analysis
- 12.1.6 Jiangyin Huaheng Auxiliary Co Ltd
- 12.1.6.1. Company Overview
- 12.1.6.2. Products
- 12.1.6.3. Company Financials
- 12.1.6.4. SWOT Analysis
- 12.1.7 LiquidPower Specialty Products Inc
- 12.1.7.1. Company Overview
- 12.1.7.2. Products
- 12.1.7.3. Company Financials
- 12.1.7.4. SWOT Analysis
- 12.1.8 NuGenTec
- 12.1.8.1. Company Overview
- 12.1.8.2. Products
- 12.1.8.3. Company Financials
- 12.1.8.4. SWOT Analysis
- 12.1.9 Oil Flux Americas
- 12.1.9.1. Company Overview
- 12.1.9.2. Products
- 12.1.9.3. Company Financials
- 12.1.9.4. SWOT Analysis
- 12.1.10 The Zoranoc Oilfield Chemical*List Not Exhaustive
- 12.1.10.1. Company Overview
- 12.1.10.2. Products
- 12.1.10.3. Company Financials
- 12.1.10.4. SWOT Analysis
- 12.1.1 Baker Hughes
- 12.2. Market Entropy
- 12.2.1 Company's Key Areas Served
- 12.2.2 Recent Developments
- 12.3. Company Market Share Analysis 2025
- 12.3.1 Top 5 Companies Market Share Analysis
- 12.3.2 Top 3 Companies Market Share Analysis
- 12.4. List of Potential Customers
- 13. Research Methodology
List of Figures
- Figure 1: Global Drag Reducing Agents Market Revenue Breakdown (million, %) by Region 2025 & 2033
- Figure 2: Asia Pacific Drag Reducing Agents Market Revenue (million), by Application 2025 & 2033
- Figure 3: Asia Pacific Drag Reducing Agents Market Revenue Share (%), by Application 2025 & 2033
- Figure 4: Asia Pacific Drag Reducing Agents Market Revenue (million), by Country 2025 & 2033
- Figure 5: Asia Pacific Drag Reducing Agents Market Revenue Share (%), by Country 2025 & 2033
- Figure 6: North America Drag Reducing Agents Market Revenue (million), by Application 2025 & 2033
- Figure 7: North America Drag Reducing Agents Market Revenue Share (%), by Application 2025 & 2033
- Figure 8: North America Drag Reducing Agents Market Revenue (million), by Country 2025 & 2033
- Figure 9: North America Drag Reducing Agents Market Revenue Share (%), by Country 2025 & 2033
- Figure 10: Europe Drag Reducing Agents Market Revenue (million), by Application 2025 & 2033
- Figure 11: Europe Drag Reducing Agents Market Revenue Share (%), by Application 2025 & 2033
- Figure 12: Europe Drag Reducing Agents Market Revenue (million), by Country 2025 & 2033
- Figure 13: Europe Drag Reducing Agents Market Revenue Share (%), by Country 2025 & 2033
- Figure 14: South America Drag Reducing Agents Market Revenue (million), by Application 2025 & 2033
- Figure 15: South America Drag Reducing Agents Market Revenue Share (%), by Application 2025 & 2033
- Figure 16: South America Drag Reducing Agents Market Revenue (million), by Country 2025 & 2033
- Figure 17: South America Drag Reducing Agents Market Revenue Share (%), by Country 2025 & 2033
- Figure 18: Middle East and Africa Drag Reducing Agents Market Revenue (million), by Application 2025 & 2033
- Figure 19: Middle East and Africa Drag Reducing Agents Market Revenue Share (%), by Application 2025 & 2033
- Figure 20: Middle East and Africa Drag Reducing Agents Market Revenue (million), by Country 2025 & 2033
- Figure 21: Middle East and Africa Drag Reducing Agents Market Revenue Share (%), by Country 2025 & 2033
List of Tables
- Table 1: Global Drag Reducing Agents Market Revenue million Forecast, by Application 2020 & 2033
- Table 2: Global Drag Reducing Agents Market Revenue million Forecast, by Region 2020 & 2033
- Table 3: Global Drag Reducing Agents Market Revenue million Forecast, by Application 2020 & 2033
- Table 4: Global Drag Reducing Agents Market Revenue million Forecast, by Country 2020 & 2033
- Table 5: China Drag Reducing Agents Market Revenue (million) Forecast, by Application 2020 & 2033
- Table 6: India Drag Reducing Agents Market Revenue (million) Forecast, by Application 2020 & 2033
- Table 7: Japan Drag Reducing Agents Market Revenue (million) Forecast, by Application 2020 & 2033
- Table 8: South Korea Drag Reducing Agents Market Revenue (million) Forecast, by Application 2020 & 2033
- Table 9: Rest of Asia Pacific Drag Reducing Agents Market Revenue (million) Forecast, by Application 2020 & 2033
- Table 10: Global Drag Reducing Agents Market Revenue million Forecast, by Application 2020 & 2033
- Table 11: Global Drag Reducing Agents Market Revenue million Forecast, by Country 2020 & 2033
- Table 12: United States Drag Reducing Agents Market Revenue (million) Forecast, by Application 2020 & 2033
- Table 13: Canada Drag Reducing Agents Market Revenue (million) Forecast, by Application 2020 & 2033
- Table 14: Mexico Drag Reducing Agents Market Revenue (million) Forecast, by Application 2020 & 2033
- Table 15: Global Drag Reducing Agents Market Revenue million Forecast, by Application 2020 & 2033
- Table 16: Global Drag Reducing Agents Market Revenue million Forecast, by Country 2020 & 2033
- Table 17: Germany Drag Reducing Agents Market Revenue (million) Forecast, by Application 2020 & 2033
- Table 18: United Kingdom Drag Reducing Agents Market Revenue (million) Forecast, by Application 2020 & 2033
- Table 19: France Drag Reducing Agents Market Revenue (million) Forecast, by Application 2020 & 2033
- Table 20: Italy Drag Reducing Agents Market Revenue (million) Forecast, by Application 2020 & 2033
- Table 21: Rest of Europe Drag Reducing Agents Market Revenue (million) Forecast, by Application 2020 & 2033
- Table 22: Global Drag Reducing Agents Market Revenue million Forecast, by Application 2020 & 2033
- Table 23: Global Drag Reducing Agents Market Revenue million Forecast, by Country 2020 & 2033
- Table 24: Brazil Drag Reducing Agents Market Revenue (million) Forecast, by Application 2020 & 2033
- Table 25: Argentina Drag Reducing Agents Market Revenue (million) Forecast, by Application 2020 & 2033
- Table 26: Rest of South America Drag Reducing Agents Market Revenue (million) Forecast, by Application 2020 & 2033
- Table 27: Global Drag Reducing Agents Market Revenue million Forecast, by Application 2020 & 2033
- Table 28: Global Drag Reducing Agents Market Revenue million Forecast, by Country 2020 & 2033
- Table 29: South Africa Drag Reducing Agents Market Revenue (million) Forecast, by Application 2020 & 2033
- Table 30: Saudi Arabia Drag Reducing Agents Market Revenue (million) Forecast, by Application 2020 & 2033
- Table 31: Rest of Middle East and Africa Drag Reducing Agents Market Revenue (million) Forecast, by Application 2020 & 2033
Frequently Asked Questions
1. What is the projected Compound Annual Growth Rate (CAGR) of the Drag Reducing Agents Market?
The projected CAGR is approximately 5.7%.
2. Which companies are prominent players in the Drag Reducing Agents Market?
Key companies in the market include Baker Hughes, Dorf Ketal Chemicals India Pvt Ltd, Flowchem, Indian Oil Corp Ltd, Innospec, Jiangyin Huaheng Auxiliary Co Ltd, LiquidPower Specialty Products Inc, NuGenTec, Oil Flux Americas, The Zoranoc Oilfield Chemical*List Not Exhaustive.
3. What are the main segments of the Drag Reducing Agents Market?
The market segments include Application.
4. Can you provide details about the market size?
The market size is estimated to be USD 749.5 million as of 2022.
5. What are some drivers contributing to market growth?
Increasing Demand from Refineries; Other Drivers.
6. What are the notable trends driving market growth?
Crude Oil has a Substantial Market Share.
7. Are there any restraints impacting market growth?
Increasing Demand from Refineries; Other Drivers.
8. Can you provide examples of recent developments in the market?
August 2022 : Baker Hughes announced an agreement to acquire Quest Integrity a subsidiary of Team, Inc, in the development and delivery of technology-enabled asset inspection and reliability management solutions for the pipeline, refinery, petrochemical, and power generation industries. Baker Hughes pipeline inspection services identify, describe, locate, and size abnormalities in a pipeline's wall that may need the use of drag reducers to decrease frictional pressure drops in a pipeline or conduit during fluid flow.
9. What pricing options are available for accessing the report?
Pricing options include single-user, multi-user, and enterprise licenses priced at USD 4750, USD 5250, and USD 8750 respectively.
10. Is the market size provided in terms of value or volume?
The market size is provided in terms of value, measured in million.
11. Are there any specific market keywords associated with the report?
Yes, the market keyword associated with the report is "Drag Reducing Agents Market," which aids in identifying and referencing the specific market segment covered.
12. How do I determine which pricing option suits my needs best?
The pricing options vary based on user requirements and access needs. Individual users may opt for single-user licenses, while businesses requiring broader access may choose multi-user or enterprise licenses for cost-effective access to the report.
13. Are there any additional resources or data provided in the Drag Reducing Agents Market report?
While the report offers comprehensive insights, it's advisable to review the specific contents or supplementary materials provided to ascertain if additional resources or data are available.
14. How can I stay updated on further developments or reports in the Drag Reducing Agents Market?
To stay informed about further developments, trends, and reports in the Drag Reducing Agents Market, consider subscribing to industry newsletters, following relevant companies and organizations, or regularly checking reputable industry news sources and publications.
Methodology
Step 1 - Identification of Relevant Samples Size from Population Database


Step 2 - Approaches for Defining Global Market Size (Value, Volume* & Price*)

Note*: In applicable scenarios
Step 3 - Data Sources
Primary Research
- Web Analytics
- Survey Reports
- Research Institute
- Latest Research Reports
- Opinion Leaders
Secondary Research
- Annual Reports
- White Paper
- Latest Press Release
- Industry Association
- Paid Database
- Investor Presentations

Step 4 - Data Triangulation
Involves using different sources of information in order to increase the validity of a study
These sources are likely to be stakeholders in a program - participants, other researchers, program staff, other community members, and so on.
Then we put all data in single framework & apply various statistical tools to find out the dynamic on the market.
During the analysis stage, feedback from the stakeholder groups would be compared to determine areas of agreement as well as areas of divergence