

Key Insights
The global N-Methyl Pyrrolidone (NMP) market is poised for significant expansion, projected to reach a substantial $1.03 billion by 2025. This growth trajectory is fueled by a robust Compound Annual Growth Rate (CAGR) of over 4.00%, indicating sustained demand and evolving market dynamics. The primary drivers of this expansion are the increasing utilization of NMP across diverse industrial applications, particularly within the burgeoning electronics sector, where it serves as a critical solvent in semiconductor manufacturing and lithium-ion battery production. Furthermore, the pharmaceutical industry's reliance on NMP as a versatile solvent for drug synthesis and formulation, coupled with its application in paints, coatings, and agrochemicals, contributes significantly to its market dominance. Emerging economies, especially in the Asia Pacific region, are anticipated to lead this growth due to rapid industrialization and increasing investments in advanced manufacturing. The demand for high-purity NMP is expected to rise as stringent quality standards become more prevalent across end-user industries.
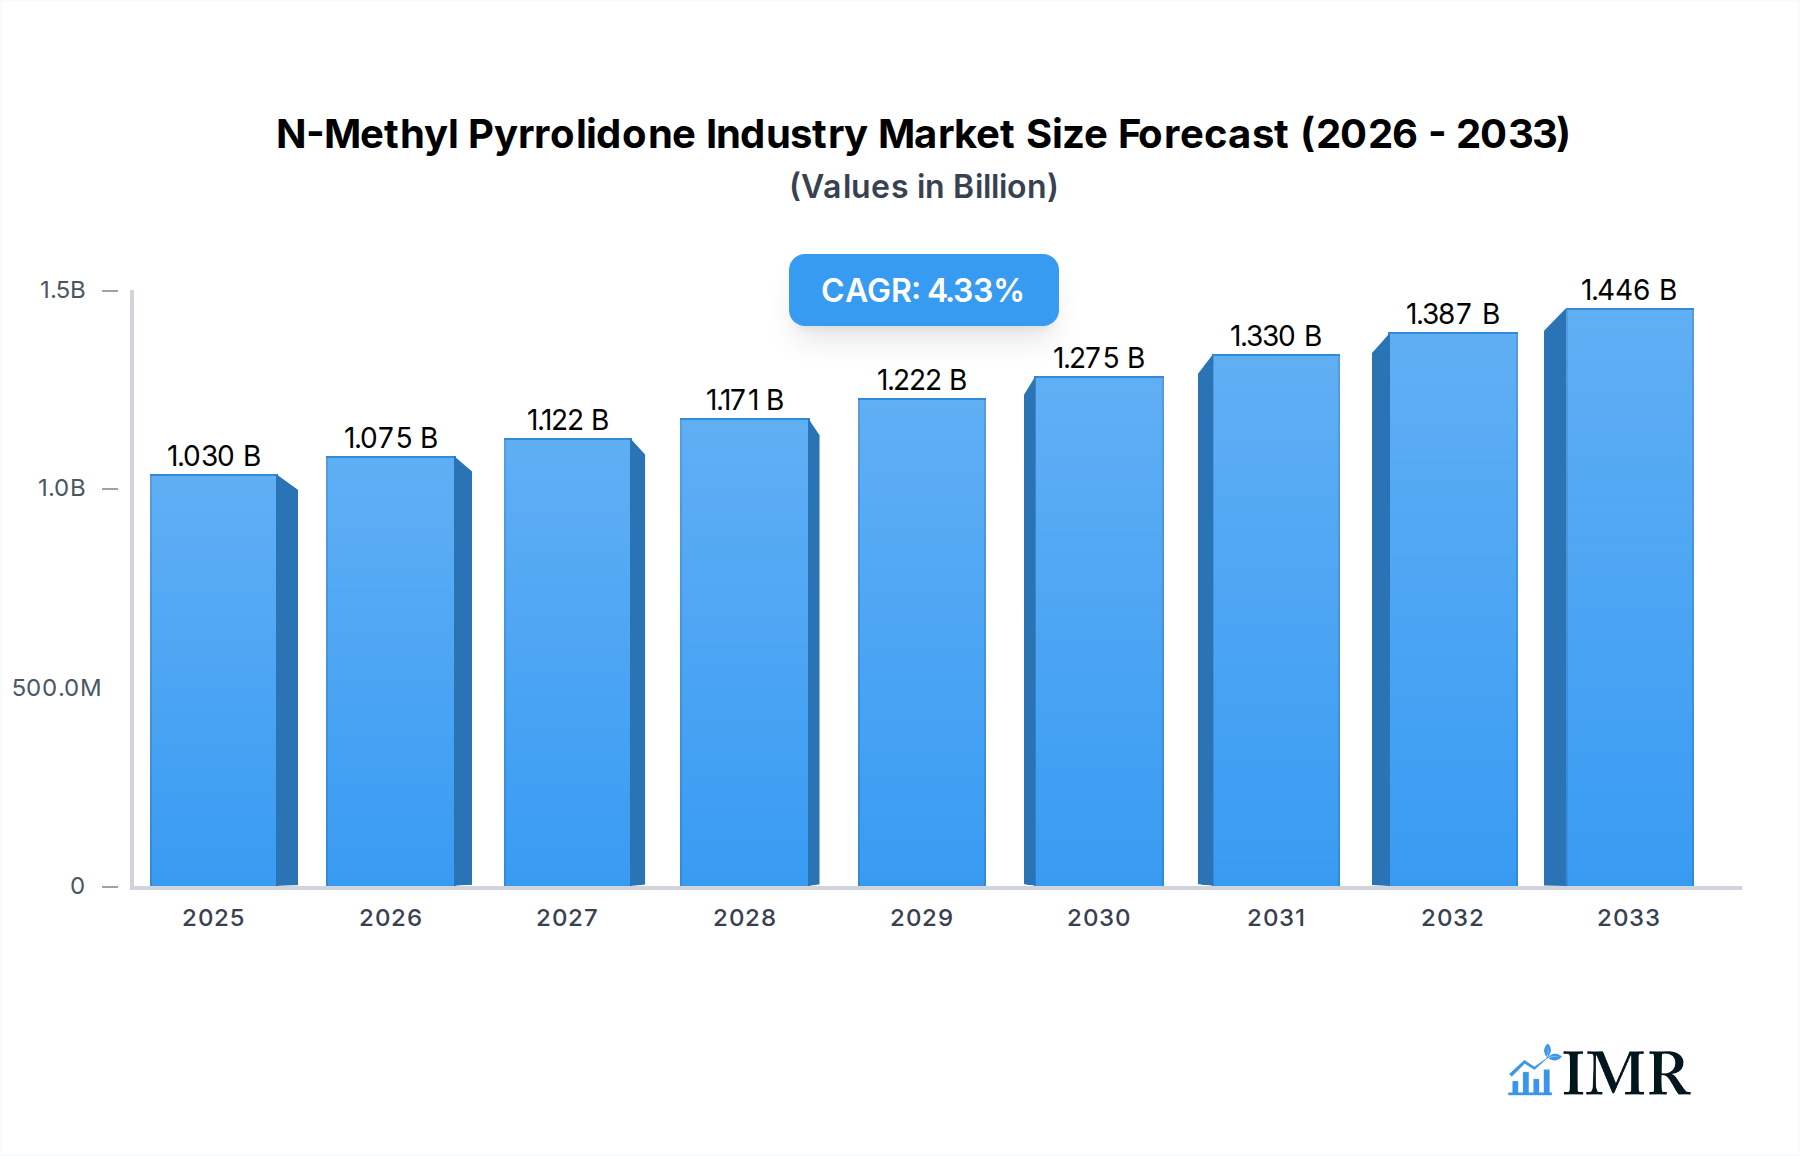
N-Methyl Pyrrolidone Industry Market Size (In Billion)
While the NMP market exhibits strong growth prospects, certain factors may present challenges. Stringent environmental regulations regarding volatile organic compounds (VOCs) in some regions could necessitate greater investment in eco-friendly alternatives or advanced emission control technologies for NMP production and usage. However, the inherent efficacy and cost-effectiveness of NMP in many critical applications are likely to mitigate these restraints. Technological advancements in NMP production, focusing on sustainable processes and enhanced purity, will be crucial for manufacturers to maintain a competitive edge. The market is characterized by the presence of established global players and a growing number of regional manufacturers, leading to a competitive landscape. Strategic collaborations and R&D initiatives focused on developing novel applications and improving product sustainability will be key differentiators for companies aiming to capture a larger market share in the coming years. The forecast period, from 2025 to 2033, is expected to witness continued innovation and market evolution.

N-Methyl Pyrrolidone Industry Company Market Share
N-Methyl Pyrrolidone (NMP) Market Research Report: Global Industry Analysis, Size, Share, Growth, Trends, Forecast 2025-2033
Unlock critical insights into the global N-Methyl Pyrrolidone (NMP) market with this comprehensive report. Spanning from 2019 to 2033, with a detailed focus on the 2025 base year and forecast period of 2025-2033, this research delivers in-depth analysis of market dynamics, growth trends, regional dominance, product landscapes, and key players. Discover parent and child market segments, leverage high-traffic keywords like "NMP solvent," "NMP applications," "NMP market size," "NMP industry trends," and "NMP forecast," and gain a strategic advantage in the evolving NMP landscape. All quantitative values are presented in Million units for immediate strategic application.
N-Methyl Pyrrolidone Industry Market Dynamics & Structure
The N-Methyl Pyrrolidone (NMP) industry is characterized by a moderate market concentration, with several key players holding significant market share. Technological innovation is a primary driver, particularly in enhancing NMP recovery and recycling processes to meet stringent environmental regulations and sustainability goals. Regulatory frameworks, especially concerning VOC emissions and worker safety, play a crucial role in shaping production standards and market access. The competitive landscape includes direct substitutes like dimethyl sulfoxide (DMSO) and gamma-butyrolactone (GBL) for specific applications, necessitating continuous product development and cost optimization. End-user demographics are diverse, ranging from large-scale industrial consumers in electronics and petrochemicals to specialized pharmaceutical and agrochemical producers. Mergers and acquisitions (M&A) trends are observed as companies seek to expand their geographical reach, diversify product portfolios, and achieve economies of scale. For instance, the March 2024 announcement by Ganzhou Zhongneng Industrial Co. Ltd regarding its expansion project, including a significant NMP production capacity, highlights ongoing investment and consolidation within the sector. Barriers to innovation often stem from high capital expenditure requirements for new production facilities and the lengthy process of regulatory approval for novel NMP-based formulations.
- Market Concentration: Moderate, with leading global chemical manufacturers.
- Key Innovation Drivers: NMP recovery technologies, sustainable production methods, specialized NMP grades.
- Regulatory Impact: Environmental protection agencies and occupational safety standards influence production and application.
- Competitive Substitutes: DMSO, GBL, and other polar aprotic solvents.
- M&A Trends: Focus on capacity expansion and vertical integration.
N-Methyl Pyrrolidone Industry Growth Trends & Insights
The global N-Methyl Pyrrolidone (NMP) market is poised for robust growth, driven by its indispensable role as a high-performance solvent and reagent across a multitude of burgeoning industries. Analyzing market size evolution reveals a steady upward trajectory, projected to reach an estimated $XX,XXX Million by 2033, with a Compound Annual Growth Rate (CAGR) of approximately X.X% during the forecast period (2025-2033). This expansion is underpinned by increasing adoption rates in critical sectors such as lithium-ion battery manufacturing, where NMP is vital for electrode processing, and the pharmaceutical industry for drug synthesis and formulation. Technological disruptions, including advancements in NMP synthesis and purification, are enhancing its efficiency and environmental profile, further stimulating demand. Consumer behavior shifts towards sustainable solutions are also indirectly benefiting NMP, as efficient recovery and recycling systems are increasingly integrated into its lifecycle, mitigating environmental concerns. The market penetration of NMP is expected to deepen, particularly in emerging economies as industrialization accelerates. Growth in the electronics sector, driven by the demand for advanced semiconductors and display technologies, directly translates to higher NMP consumption for cleaning and processing. The Paints and Coatings segment continues to be a significant contributor, with NMP's superior solvency power enabling the development of high-performance coatings. In the Oil and Gas industry, NMP is utilized in gas sweetening and lubricant production. The Agrochemicals sector leverages NMP for pesticide and herbicide formulations. The "Other Applications" segment, encompassing areas like textile processing and industrial cleaning, also presents steady growth potential. Overall, the confluence of technological advancements, expanding end-user applications, and a growing emphasis on sustainable chemical solutions will propel the NMP market forward.
Dominant Regions, Countries, or Segments in N-Methyl Pyrrolidone Industry
Asia Pacific currently stands as the dominant region in the N-Methyl Pyrrolidone (NMP) market, fueled by robust industrial expansion, particularly in China, South Korea, and Japan. This region accounts for an estimated XX.X% of the global NMP market share, driven by its pivotal role in the electronics manufacturing supply chain, which heavily relies on NMP for semiconductor and display production. Economic policies fostering manufacturing growth, coupled with significant infrastructure development, have further cemented Asia Pacific's leading position.
Key Drivers of Dominance in Asia Pacific:
- Electronics Manufacturing Hub: The concentration of semiconductor fabrication plants and advanced display panel manufacturers necessitates substantial NMP consumption for critical cleaning and processing steps.
- Growing Automotive Sector: Increasing electric vehicle (EV) production, particularly in China, is a major catalyst for NMP demand in lithium-ion battery electrode manufacturing.
- Pharmaceutical and Agrochemical Growth: Rapid advancements and expanding production capabilities in these sectors within Asia Pacific contribute significantly to NMP consumption.
- Favorable Government Initiatives: Supportive industrial policies and investments in chemical manufacturing infrastructure within countries like China provide a conducive environment for NMP production and consumption.
While Asia Pacific leads, North America and Europe are also significant markets, driven by their advanced pharmaceutical, automotive, and specialty chemical sectors. The United States, a major player in pharmaceuticals and advanced materials, contributes substantially to NMP demand. European countries, with their strong emphasis on sustainable manufacturing and high-performance coatings, also represent a considerable market.
The Electronics segment, followed closely by Oil and Gas and Pharmaceuticals, emerges as a leading application driving market growth. The increasing sophistication of electronic components and the widespread adoption of digital technologies globally are directly translating into higher demand for NMP.
- Electronics: Essential for semiconductor cleaning, photoresist stripping, and display manufacturing. Estimated market share of XX.X% in 2025.
- Oil and Gas: Used in natural gas purification (sweetening) and extraction processes. Significant market share of XX.X%.
- Pharmaceuticals: Crucial solvent in drug synthesis, purification, and formulation. Market share of XX.X%.
- Paints and Coatings: Valued for its excellent solvency and low evaporation rate, used in high-performance coatings. Market share of XX.X%.
- Agrochemicals: Employed in the formulation of pesticides and herbicides. Market share of XX.X%.
- Other Applications: Including textile processing, industrial cleaning, and polymer production. Market share of XX.X%.
N-Methyl Pyrrolidone Industry Product Landscape
The N-Methyl Pyrrolidone (NMP) product landscape is defined by its high purity grades and specialized formulations catering to exacting industry standards. Key product innovations focus on enhancing NMP's solvency power, reducing its boiling point for specific applications, and developing eco-friendlier production processes. Performance metrics emphasize exceptional solvency for a wide range of polymers, low volatility, high thermal and chemical stability, and excellent biodegradability for recycled NMP. Unique selling propositions include its effectiveness in challenging applications like the removal of tough residues in semiconductor manufacturing and its role in producing high-performance materials for the automotive and aerospace industries. Technological advancements are continuously improving the efficiency of NMP synthesis and purification, leading to products with reduced impurity profiles critical for sensitive electronic and pharmaceutical applications.
Key Drivers, Barriers & Challenges in N-Methyl Pyrrolidone Industry
The N-Methyl Pyrrolidone (NMP) industry is propelled by several key drivers. The burgeoning demand for lithium-ion batteries in electric vehicles and consumer electronics is a primary growth accelerator, as NMP is essential for electrode slurry preparation. Advancements in semiconductor manufacturing and the increasing complexity of microchips necessitate high-purity NMP for sophisticated cleaning and etching processes. Growth in the pharmaceutical sector, driven by new drug discoveries and increased healthcare spending, fuels the demand for NMP as a critical solvent in synthesis and formulation. Furthermore, the ongoing development of high-performance coatings and paints, particularly in the automotive and construction sectors, leverages NMP's superior solvency properties.
However, the industry faces significant barriers and challenges. Stringent environmental regulations regarding volatile organic compounds (VOCs) and potential health impacts necessitate significant investment in emission control and worker safety measures. The increasing focus on sustainability is driving demand for NMP recycling and recovery solutions, requiring technological innovation and infrastructure development. Volatility in raw material prices, particularly butane and ammonia, can impact production costs and market pricing. Competition from alternative solvents, though often less versatile, poses a challenge in specific applications. Supply chain disruptions, as witnessed in recent global events, can affect the availability and cost of key feedstocks.
Emerging Opportunities in N-Methyl Pyrrolidone Industry
Emerging opportunities in the N-Methyl Pyrrolidone (NMP) industry are primarily centered around the circular economy and advanced material development. The increasing emphasis on sustainability is creating a significant market for advanced NMP recycling and purification technologies, enabling closed-loop systems and reducing waste. The rapid growth of the electric vehicle market continues to drive demand for battery-grade NMP, presenting opportunities for enhanced production capacity and higher purity offerings. Furthermore, the development of new applications for NMP in areas such as advanced composites, membranes for water treatment, and biodegradable plastics offers untapped market potential. Evolving consumer preferences for eco-friendly products are also pushing manufacturers to explore bio-based NMP alternatives, opening up new avenues for research and development.
Growth Accelerators in the N-Methyl Pyrrolidone Industry Industry
The N-Methyl Pyrrolidone (NMP) industry's long-term growth is significantly accelerated by technological breakthroughs in NMP synthesis and recovery. Innovations that enhance the efficiency and cost-effectiveness of NMP production, along with advanced recycling techniques that minimize environmental impact, are crucial. Strategic partnerships between NMP manufacturers, end-users, and technology providers are fostering collaborative efforts to develop tailored solutions and expand market reach. Market expansion strategies, particularly targeting high-growth regions and emerging applications like advanced battery technologies and specialty chemicals, are vital catalysts. The increasing regulatory push towards greener chemistry and circular economy principles also acts as a significant growth accelerator, incentivizing the development and adoption of sustainable NMP solutions.
Key Players Shaping the N-Methyl Pyrrolidone Industry Market
- Prasol Chemicals Limited
- Santa Cruz Biotechnology Inc
- Puyang Guangming Chemical Co Ltd
- Tokyo Chemical Industry Co Ltd
- Hefei TNJ Chemical Industry Co Ltd
- BALAJI AMINES
- Mitsubishi Chemical Corporation
- BYN Chemical Co Ltd
- Ashland
- Binzhou City Zhanhua District Ruian Chemical Co Ltd
- BASF SE
- Ganzhou Zhongneng Industrial Co Ltd
- Eastman Chemical Company
- Shandong Qingyun Changxin Chemical Science-Tech Co Ltd
- LyondellBasell Industries Holdings BV
List Not Exhaustive
Notable Milestones in N-Methyl Pyrrolidone Industry Sector
- March 2024: Ganzhou Municipal Administration for Industry and Commerce announced the planned acceptance of the environmental impact assessment file for Ganzhou Zhongneng Industrial Co. Ltd, including the planned 150,000-ton NMP, 30,000-ton GBL, and 20,000-ton 2P expansion project. The company is expected to build a 50,000-ton NMP synthetic production line and a 50,000-ton NMP recovery refining production line.
- August 2022: BASF SE announced the production of more specialty pyrrolidones in North America owing to the growing demand for digital inks, coatings, automotive, and agricultural products.
In-Depth N-Methyl Pyrrolidone Industry Market Outlook
The N-Methyl Pyrrolidone (NMP) industry outlook is exceptionally positive, fueled by its critical role in high-growth sectors like electric vehicles and advanced electronics. The market's future potential is intrinsically linked to innovations in battery technology, where NMP remains a cornerstone solvent for cathode manufacturing, and the continued miniaturization and increased complexity of semiconductor devices. Strategic opportunities lie in the development of high-purity, specialized NMP grades and the expansion of advanced NMP recycling infrastructure globally. Collaboration between industry stakeholders to address regulatory landscapes and promote sustainable practices will be paramount. The growing emphasis on circular economy principles will further drive demand for efficient NMP recovery systems, positioning NMP as a key enabler of sustainable industrial processes and a vital component in the transition towards a greener, more technologically advanced future.
N-Methyl Pyrrolidone Industry Segmentation
-
1. Application
- 1.1. Oil and Gas
- 1.2. Pharmaceuticals
- 1.3. Paints and Coatings
- 1.4. Electronics
- 1.5. Agrochemicals
- 1.6. Other Applications
N-Methyl Pyrrolidone Industry Segmentation By Geography
-
1. Asia Pacific
- 1.1. China
- 1.2. India
- 1.3. Japan
- 1.4. South Korea
- 1.5. Malaysia
- 1.6. Thailand
- 1.7. Indonesia
- 1.8. Vietnam
- 1.9. Rest of Asia Pacific
-
2. North America
- 2.1. United States
- 2.2. Canada
- 2.3. Mexico
-
3. Europe
- 3.1. Germany
- 3.2. United Kingdom
- 3.3. Italy
- 3.4. France
- 3.5. Spain
- 3.6. Nordic Countries
- 3.7. Russia
- 3.8. Rest of Europe
-
4. South America
- 4.1. Brazil
- 4.2. Argentina
- 4.3. Colombia
- 4.4. Rest of South America
-
5. Middle East and Africa
- 5.1. Saudi Arabia
- 5.2. Qatar
- 5.3. United Arab Emirates
- 5.4. Nigeria
- 5.5. South Africa
- 5.6. Rest of MEA

N-Methyl Pyrrolidone Industry Regional Market Share
Geographic Coverage of N-Methyl Pyrrolidone Industry
N-Methyl Pyrrolidone Industry REPORT HIGHLIGHTS
| Aspects | Details |
|---|---|
| Study Period | 2020-2034 |
| Base Year | 2025 |
| Estimated Year | 2026 |
| Forecast Period | 2026-2034 |
| Historical Period | 2020-2025 |
| Growth Rate | CAGR of > 4.00% from 2020-2034 |
| Segmentation |
|
Table of Contents
- 1. Introduction
- 1.1. Research Scope
- 1.2. Market Segmentation
- 1.3. Research Objective
- 1.4. Definitions and Assumptions
- 2. Executive Summary
- 2.1. Market Snapshot
- 3. Market Dynamics
- 3.1. Market Drivers
- 3.2. Market Restrains
- 3.3. Market Trends
- 3.4. Market Opportunities
- 4. Market Factor Analysis
- 4.1. Porters Five Forces
- 4.1.1. Bargaining Power of Suppliers
- 4.1.2. Bargaining Power of Buyers
- 4.1.3. Threat of New Entrants
- 4.1.4. Threat of Substitutes
- 4.1.5. Competitive Rivalry
- 4.2. PESTEL analysis
- 4.3. BCG Analysis
- 4.3.1. Stars (High Growth, High Market Share)
- 4.3.2. Cash Cows (Low Growth, High Market Share)
- 4.3.3. Question Mark (High Growth, Low Market Share)
- 4.3.4. Dogs (Low Growth, Low Market Share)
- 4.4. Ansoff Matrix Analysis
- 4.5. Supply Chain Analysis
- 4.6. Regulatory Landscape
- 4.7. Current Market Potential and Opportunity Assessment (TAM–SAM–SOM Framework)
- 4.8. IMR Analyst Note
- 4.1. Porters Five Forces
- 5. Market Analysis, Insights and Forecast 2021-2033
- 5.1. Market Analysis, Insights and Forecast - by Application
- 5.1.1. Oil and Gas
- 5.1.2. Pharmaceuticals
- 5.1.3. Paints and Coatings
- 5.1.4. Electronics
- 5.1.5. Agrochemicals
- 5.1.6. Other Applications
- 5.2. Market Analysis, Insights and Forecast - by Region
- 5.2.1. Asia Pacific
- 5.2.2. North America
- 5.2.3. Europe
- 5.2.4. South America
- 5.2.5. Middle East and Africa
- 5.1. Market Analysis, Insights and Forecast - by Application
- 6. Global N-Methyl Pyrrolidone Industry Analysis, Insights and Forecast, 2021-2033
- 6.1. Market Analysis, Insights and Forecast - by Application
- 6.1.1. Oil and Gas
- 6.1.2. Pharmaceuticals
- 6.1.3. Paints and Coatings
- 6.1.4. Electronics
- 6.1.5. Agrochemicals
- 6.1.6. Other Applications
- 6.1. Market Analysis, Insights and Forecast - by Application
- 7. Asia Pacific N-Methyl Pyrrolidone Industry Analysis, Insights and Forecast, 2020-2032
- 7.1. Market Analysis, Insights and Forecast - by Application
- 7.1.1. Oil and Gas
- 7.1.2. Pharmaceuticals
- 7.1.3. Paints and Coatings
- 7.1.4. Electronics
- 7.1.5. Agrochemicals
- 7.1.6. Other Applications
- 7.1. Market Analysis, Insights and Forecast - by Application
- 8. North America N-Methyl Pyrrolidone Industry Analysis, Insights and Forecast, 2020-2032
- 8.1. Market Analysis, Insights and Forecast - by Application
- 8.1.1. Oil and Gas
- 8.1.2. Pharmaceuticals
- 8.1.3. Paints and Coatings
- 8.1.4. Electronics
- 8.1.5. Agrochemicals
- 8.1.6. Other Applications
- 8.1. Market Analysis, Insights and Forecast - by Application
- 9. Europe N-Methyl Pyrrolidone Industry Analysis, Insights and Forecast, 2020-2032
- 9.1. Market Analysis, Insights and Forecast - by Application
- 9.1.1. Oil and Gas
- 9.1.2. Pharmaceuticals
- 9.1.3. Paints and Coatings
- 9.1.4. Electronics
- 9.1.5. Agrochemicals
- 9.1.6. Other Applications
- 9.1. Market Analysis, Insights and Forecast - by Application
- 10. South America N-Methyl Pyrrolidone Industry Analysis, Insights and Forecast, 2020-2032
- 10.1. Market Analysis, Insights and Forecast - by Application
- 10.1.1. Oil and Gas
- 10.1.2. Pharmaceuticals
- 10.1.3. Paints and Coatings
- 10.1.4. Electronics
- 10.1.5. Agrochemicals
- 10.1.6. Other Applications
- 10.1. Market Analysis, Insights and Forecast - by Application
- 11. Middle East and Africa N-Methyl Pyrrolidone Industry Analysis, Insights and Forecast, 2020-2032
- 11.1. Market Analysis, Insights and Forecast - by Application
- 11.1.1. Oil and Gas
- 11.1.2. Pharmaceuticals
- 11.1.3. Paints and Coatings
- 11.1.4. Electronics
- 11.1.5. Agrochemicals
- 11.1.6. Other Applications
- 11.1. Market Analysis, Insights and Forecast - by Application
- 12. Competitive Analysis
- 12.1. Company Profiles
- 12.1.1 Prasol Chemicals Limited
- 12.1.1.1. Company Overview
- 12.1.1.2. Products
- 12.1.1.3. Company Financials
- 12.1.1.4. SWOT Analysis
- 12.1.2 Santa Cruz Biotechnology Inc
- 12.1.2.1. Company Overview
- 12.1.2.2. Products
- 12.1.2.3. Company Financials
- 12.1.2.4. SWOT Analysis
- 12.1.3 Puyang Guangming Chemical Co Ltd
- 12.1.3.1. Company Overview
- 12.1.3.2. Products
- 12.1.3.3. Company Financials
- 12.1.3.4. SWOT Analysis
- 12.1.4 Tokyo Chemical Industry Co Ltd*List Not Exhaustive
- 12.1.4.1. Company Overview
- 12.1.4.2. Products
- 12.1.4.3. Company Financials
- 12.1.4.4. SWOT Analysis
- 12.1.5 Hefei TNJ Chemical Industry Co Ltd
- 12.1.5.1. Company Overview
- 12.1.5.2. Products
- 12.1.5.3. Company Financials
- 12.1.5.4. SWOT Analysis
- 12.1.6 BALAJI AMINES
- 12.1.6.1. Company Overview
- 12.1.6.2. Products
- 12.1.6.3. Company Financials
- 12.1.6.4. SWOT Analysis
- 12.1.7 Mitsubishi Chemical Corporation
- 12.1.7.1. Company Overview
- 12.1.7.2. Products
- 12.1.7.3. Company Financials
- 12.1.7.4. SWOT Analysis
- 12.1.8 BYN Chemical Co Ltd
- 12.1.8.1. Company Overview
- 12.1.8.2. Products
- 12.1.8.3. Company Financials
- 12.1.8.4. SWOT Analysis
- 12.1.9 Ashland
- 12.1.9.1. Company Overview
- 12.1.9.2. Products
- 12.1.9.3. Company Financials
- 12.1.9.4. SWOT Analysis
- 12.1.10 Binzhou City Zhanhua District Ruian Chemical Co Ltd
- 12.1.10.1. Company Overview
- 12.1.10.2. Products
- 12.1.10.3. Company Financials
- 12.1.10.4. SWOT Analysis
- 12.1.11 BASF SE
- 12.1.11.1. Company Overview
- 12.1.11.2. Products
- 12.1.11.3. Company Financials
- 12.1.11.4. SWOT Analysis
- 12.1.12 Ganzhou Zhongneng Industrial Co Ltd
- 12.1.12.1. Company Overview
- 12.1.12.2. Products
- 12.1.12.3. Company Financials
- 12.1.12.4. SWOT Analysis
- 12.1.13 Eastman Chemical Company
- 12.1.13.1. Company Overview
- 12.1.13.2. Products
- 12.1.13.3. Company Financials
- 12.1.13.4. SWOT Analysis
- 12.1.14 Shandong Qingyun Changxin Chemical Science-Tech Co Ltd
- 12.1.14.1. Company Overview
- 12.1.14.2. Products
- 12.1.14.3. Company Financials
- 12.1.14.4. SWOT Analysis
- 12.1.15 LyondellBasell Industries Holdings BV
- 12.1.15.1. Company Overview
- 12.1.15.2. Products
- 12.1.15.3. Company Financials
- 12.1.15.4. SWOT Analysis
- 12.1.1 Prasol Chemicals Limited
- 12.2. Market Entropy
- 12.2.1 Company's Key Areas Served
- 12.2.2 Recent Developments
- 12.3. Company Market Share Analysis 2025
- 12.3.1 Top 5 Companies Market Share Analysis
- 12.3.2 Top 3 Companies Market Share Analysis
- 12.4. List of Potential Customers
- 13. Research Methodology
List of Figures
- Figure 1: Global N-Methyl Pyrrolidone Industry Revenue Breakdown (Million, %) by Region 2025 & 2033
- Figure 2: Global N-Methyl Pyrrolidone Industry Volume Breakdown (K Tons, %) by Region 2025 & 2033
- Figure 3: Asia Pacific N-Methyl Pyrrolidone Industry Revenue (Million), by Application 2025 & 2033
- Figure 4: Asia Pacific N-Methyl Pyrrolidone Industry Volume (K Tons), by Application 2025 & 2033
- Figure 5: Asia Pacific N-Methyl Pyrrolidone Industry Revenue Share (%), by Application 2025 & 2033
- Figure 6: Asia Pacific N-Methyl Pyrrolidone Industry Volume Share (%), by Application 2025 & 2033
- Figure 7: Asia Pacific N-Methyl Pyrrolidone Industry Revenue (Million), by Country 2025 & 2033
- Figure 8: Asia Pacific N-Methyl Pyrrolidone Industry Volume (K Tons), by Country 2025 & 2033
- Figure 9: Asia Pacific N-Methyl Pyrrolidone Industry Revenue Share (%), by Country 2025 & 2033
- Figure 10: Asia Pacific N-Methyl Pyrrolidone Industry Volume Share (%), by Country 2025 & 2033
- Figure 11: North America N-Methyl Pyrrolidone Industry Revenue (Million), by Application 2025 & 2033
- Figure 12: North America N-Methyl Pyrrolidone Industry Volume (K Tons), by Application 2025 & 2033
- Figure 13: North America N-Methyl Pyrrolidone Industry Revenue Share (%), by Application 2025 & 2033
- Figure 14: North America N-Methyl Pyrrolidone Industry Volume Share (%), by Application 2025 & 2033
- Figure 15: North America N-Methyl Pyrrolidone Industry Revenue (Million), by Country 2025 & 2033
- Figure 16: North America N-Methyl Pyrrolidone Industry Volume (K Tons), by Country 2025 & 2033
- Figure 17: North America N-Methyl Pyrrolidone Industry Revenue Share (%), by Country 2025 & 2033
- Figure 18: North America N-Methyl Pyrrolidone Industry Volume Share (%), by Country 2025 & 2033
- Figure 19: Europe N-Methyl Pyrrolidone Industry Revenue (Million), by Application 2025 & 2033
- Figure 20: Europe N-Methyl Pyrrolidone Industry Volume (K Tons), by Application 2025 & 2033
- Figure 21: Europe N-Methyl Pyrrolidone Industry Revenue Share (%), by Application 2025 & 2033
- Figure 22: Europe N-Methyl Pyrrolidone Industry Volume Share (%), by Application 2025 & 2033
- Figure 23: Europe N-Methyl Pyrrolidone Industry Revenue (Million), by Country 2025 & 2033
- Figure 24: Europe N-Methyl Pyrrolidone Industry Volume (K Tons), by Country 2025 & 2033
- Figure 25: Europe N-Methyl Pyrrolidone Industry Revenue Share (%), by Country 2025 & 2033
- Figure 26: Europe N-Methyl Pyrrolidone Industry Volume Share (%), by Country 2025 & 2033
- Figure 27: South America N-Methyl Pyrrolidone Industry Revenue (Million), by Application 2025 & 2033
- Figure 28: South America N-Methyl Pyrrolidone Industry Volume (K Tons), by Application 2025 & 2033
- Figure 29: South America N-Methyl Pyrrolidone Industry Revenue Share (%), by Application 2025 & 2033
- Figure 30: South America N-Methyl Pyrrolidone Industry Volume Share (%), by Application 2025 & 2033
- Figure 31: South America N-Methyl Pyrrolidone Industry Revenue (Million), by Country 2025 & 2033
- Figure 32: South America N-Methyl Pyrrolidone Industry Volume (K Tons), by Country 2025 & 2033
- Figure 33: South America N-Methyl Pyrrolidone Industry Revenue Share (%), by Country 2025 & 2033
- Figure 34: South America N-Methyl Pyrrolidone Industry Volume Share (%), by Country 2025 & 2033
- Figure 35: Middle East and Africa N-Methyl Pyrrolidone Industry Revenue (Million), by Application 2025 & 2033
- Figure 36: Middle East and Africa N-Methyl Pyrrolidone Industry Volume (K Tons), by Application 2025 & 2033
- Figure 37: Middle East and Africa N-Methyl Pyrrolidone Industry Revenue Share (%), by Application 2025 & 2033
- Figure 38: Middle East and Africa N-Methyl Pyrrolidone Industry Volume Share (%), by Application 2025 & 2033
- Figure 39: Middle East and Africa N-Methyl Pyrrolidone Industry Revenue (Million), by Country 2025 & 2033
- Figure 40: Middle East and Africa N-Methyl Pyrrolidone Industry Volume (K Tons), by Country 2025 & 2033
- Figure 41: Middle East and Africa N-Methyl Pyrrolidone Industry Revenue Share (%), by Country 2025 & 2033
- Figure 42: Middle East and Africa N-Methyl Pyrrolidone Industry Volume Share (%), by Country 2025 & 2033
List of Tables
- Table 1: Global N-Methyl Pyrrolidone Industry Revenue Million Forecast, by Application 2020 & 2033
- Table 2: Global N-Methyl Pyrrolidone Industry Volume K Tons Forecast, by Application 2020 & 2033
- Table 3: Global N-Methyl Pyrrolidone Industry Revenue Million Forecast, by Region 2020 & 2033
- Table 4: Global N-Methyl Pyrrolidone Industry Volume K Tons Forecast, by Region 2020 & 2033
- Table 5: Global N-Methyl Pyrrolidone Industry Revenue Million Forecast, by Application 2020 & 2033
- Table 6: Global N-Methyl Pyrrolidone Industry Volume K Tons Forecast, by Application 2020 & 2033
- Table 7: Global N-Methyl Pyrrolidone Industry Revenue Million Forecast, by Country 2020 & 2033
- Table 8: Global N-Methyl Pyrrolidone Industry Volume K Tons Forecast, by Country 2020 & 2033
- Table 9: China N-Methyl Pyrrolidone Industry Revenue (Million) Forecast, by Application 2020 & 2033
- Table 10: China N-Methyl Pyrrolidone Industry Volume (K Tons) Forecast, by Application 2020 & 2033
- Table 11: India N-Methyl Pyrrolidone Industry Revenue (Million) Forecast, by Application 2020 & 2033
- Table 12: India N-Methyl Pyrrolidone Industry Volume (K Tons) Forecast, by Application 2020 & 2033
- Table 13: Japan N-Methyl Pyrrolidone Industry Revenue (Million) Forecast, by Application 2020 & 2033
- Table 14: Japan N-Methyl Pyrrolidone Industry Volume (K Tons) Forecast, by Application 2020 & 2033
- Table 15: South Korea N-Methyl Pyrrolidone Industry Revenue (Million) Forecast, by Application 2020 & 2033
- Table 16: South Korea N-Methyl Pyrrolidone Industry Volume (K Tons) Forecast, by Application 2020 & 2033
- Table 17: Malaysia N-Methyl Pyrrolidone Industry Revenue (Million) Forecast, by Application 2020 & 2033
- Table 18: Malaysia N-Methyl Pyrrolidone Industry Volume (K Tons) Forecast, by Application 2020 & 2033
- Table 19: Thailand N-Methyl Pyrrolidone Industry Revenue (Million) Forecast, by Application 2020 & 2033
- Table 20: Thailand N-Methyl Pyrrolidone Industry Volume (K Tons) Forecast, by Application 2020 & 2033
- Table 21: Indonesia N-Methyl Pyrrolidone Industry Revenue (Million) Forecast, by Application 2020 & 2033
- Table 22: Indonesia N-Methyl Pyrrolidone Industry Volume (K Tons) Forecast, by Application 2020 & 2033
- Table 23: Vietnam N-Methyl Pyrrolidone Industry Revenue (Million) Forecast, by Application 2020 & 2033
- Table 24: Vietnam N-Methyl Pyrrolidone Industry Volume (K Tons) Forecast, by Application 2020 & 2033
- Table 25: Rest of Asia Pacific N-Methyl Pyrrolidone Industry Revenue (Million) Forecast, by Application 2020 & 2033
- Table 26: Rest of Asia Pacific N-Methyl Pyrrolidone Industry Volume (K Tons) Forecast, by Application 2020 & 2033
- Table 27: Global N-Methyl Pyrrolidone Industry Revenue Million Forecast, by Application 2020 & 2033
- Table 28: Global N-Methyl Pyrrolidone Industry Volume K Tons Forecast, by Application 2020 & 2033
- Table 29: Global N-Methyl Pyrrolidone Industry Revenue Million Forecast, by Country 2020 & 2033
- Table 30: Global N-Methyl Pyrrolidone Industry Volume K Tons Forecast, by Country 2020 & 2033
- Table 31: United States N-Methyl Pyrrolidone Industry Revenue (Million) Forecast, by Application 2020 & 2033
- Table 32: United States N-Methyl Pyrrolidone Industry Volume (K Tons) Forecast, by Application 2020 & 2033
- Table 33: Canada N-Methyl Pyrrolidone Industry Revenue (Million) Forecast, by Application 2020 & 2033
- Table 34: Canada N-Methyl Pyrrolidone Industry Volume (K Tons) Forecast, by Application 2020 & 2033
- Table 35: Mexico N-Methyl Pyrrolidone Industry Revenue (Million) Forecast, by Application 2020 & 2033
- Table 36: Mexico N-Methyl Pyrrolidone Industry Volume (K Tons) Forecast, by Application 2020 & 2033
- Table 37: Global N-Methyl Pyrrolidone Industry Revenue Million Forecast, by Application 2020 & 2033
- Table 38: Global N-Methyl Pyrrolidone Industry Volume K Tons Forecast, by Application 2020 & 2033
- Table 39: Global N-Methyl Pyrrolidone Industry Revenue Million Forecast, by Country 2020 & 2033
- Table 40: Global N-Methyl Pyrrolidone Industry Volume K Tons Forecast, by Country 2020 & 2033
- Table 41: Germany N-Methyl Pyrrolidone Industry Revenue (Million) Forecast, by Application 2020 & 2033
- Table 42: Germany N-Methyl Pyrrolidone Industry Volume (K Tons) Forecast, by Application 2020 & 2033
- Table 43: United Kingdom N-Methyl Pyrrolidone Industry Revenue (Million) Forecast, by Application 2020 & 2033
- Table 44: United Kingdom N-Methyl Pyrrolidone Industry Volume (K Tons) Forecast, by Application 2020 & 2033
- Table 45: Italy N-Methyl Pyrrolidone Industry Revenue (Million) Forecast, by Application 2020 & 2033
- Table 46: Italy N-Methyl Pyrrolidone Industry Volume (K Tons) Forecast, by Application 2020 & 2033
- Table 47: France N-Methyl Pyrrolidone Industry Revenue (Million) Forecast, by Application 2020 & 2033
- Table 48: France N-Methyl Pyrrolidone Industry Volume (K Tons) Forecast, by Application 2020 & 2033
- Table 49: Spain N-Methyl Pyrrolidone Industry Revenue (Million) Forecast, by Application 2020 & 2033
- Table 50: Spain N-Methyl Pyrrolidone Industry Volume (K Tons) Forecast, by Application 2020 & 2033
- Table 51: Nordic Countries N-Methyl Pyrrolidone Industry Revenue (Million) Forecast, by Application 2020 & 2033
- Table 52: Nordic Countries N-Methyl Pyrrolidone Industry Volume (K Tons) Forecast, by Application 2020 & 2033
- Table 53: Russia N-Methyl Pyrrolidone Industry Revenue (Million) Forecast, by Application 2020 & 2033
- Table 54: Russia N-Methyl Pyrrolidone Industry Volume (K Tons) Forecast, by Application 2020 & 2033
- Table 55: Rest of Europe N-Methyl Pyrrolidone Industry Revenue (Million) Forecast, by Application 2020 & 2033
- Table 56: Rest of Europe N-Methyl Pyrrolidone Industry Volume (K Tons) Forecast, by Application 2020 & 2033
- Table 57: Global N-Methyl Pyrrolidone Industry Revenue Million Forecast, by Application 2020 & 2033
- Table 58: Global N-Methyl Pyrrolidone Industry Volume K Tons Forecast, by Application 2020 & 2033
- Table 59: Global N-Methyl Pyrrolidone Industry Revenue Million Forecast, by Country 2020 & 2033
- Table 60: Global N-Methyl Pyrrolidone Industry Volume K Tons Forecast, by Country 2020 & 2033
- Table 61: Brazil N-Methyl Pyrrolidone Industry Revenue (Million) Forecast, by Application 2020 & 2033
- Table 62: Brazil N-Methyl Pyrrolidone Industry Volume (K Tons) Forecast, by Application 2020 & 2033
- Table 63: Argentina N-Methyl Pyrrolidone Industry Revenue (Million) Forecast, by Application 2020 & 2033
- Table 64: Argentina N-Methyl Pyrrolidone Industry Volume (K Tons) Forecast, by Application 2020 & 2033
- Table 65: Colombia N-Methyl Pyrrolidone Industry Revenue (Million) Forecast, by Application 2020 & 2033
- Table 66: Colombia N-Methyl Pyrrolidone Industry Volume (K Tons) Forecast, by Application 2020 & 2033
- Table 67: Rest of South America N-Methyl Pyrrolidone Industry Revenue (Million) Forecast, by Application 2020 & 2033
- Table 68: Rest of South America N-Methyl Pyrrolidone Industry Volume (K Tons) Forecast, by Application 2020 & 2033
- Table 69: Global N-Methyl Pyrrolidone Industry Revenue Million Forecast, by Application 2020 & 2033
- Table 70: Global N-Methyl Pyrrolidone Industry Volume K Tons Forecast, by Application 2020 & 2033
- Table 71: Global N-Methyl Pyrrolidone Industry Revenue Million Forecast, by Country 2020 & 2033
- Table 72: Global N-Methyl Pyrrolidone Industry Volume K Tons Forecast, by Country 2020 & 2033
- Table 73: Saudi Arabia N-Methyl Pyrrolidone Industry Revenue (Million) Forecast, by Application 2020 & 2033
- Table 74: Saudi Arabia N-Methyl Pyrrolidone Industry Volume (K Tons) Forecast, by Application 2020 & 2033
- Table 75: Qatar N-Methyl Pyrrolidone Industry Revenue (Million) Forecast, by Application 2020 & 2033
- Table 76: Qatar N-Methyl Pyrrolidone Industry Volume (K Tons) Forecast, by Application 2020 & 2033
- Table 77: United Arab Emirates N-Methyl Pyrrolidone Industry Revenue (Million) Forecast, by Application 2020 & 2033
- Table 78: United Arab Emirates N-Methyl Pyrrolidone Industry Volume (K Tons) Forecast, by Application 2020 & 2033
- Table 79: Nigeria N-Methyl Pyrrolidone Industry Revenue (Million) Forecast, by Application 2020 & 2033
- Table 80: Nigeria N-Methyl Pyrrolidone Industry Volume (K Tons) Forecast, by Application 2020 & 2033
- Table 81: South Africa N-Methyl Pyrrolidone Industry Revenue (Million) Forecast, by Application 2020 & 2033
- Table 82: South Africa N-Methyl Pyrrolidone Industry Volume (K Tons) Forecast, by Application 2020 & 2033
- Table 83: Rest of MEA N-Methyl Pyrrolidone Industry Revenue (Million) Forecast, by Application 2020 & 2033
- Table 84: Rest of MEA N-Methyl Pyrrolidone Industry Volume (K Tons) Forecast, by Application 2020 & 2033
Frequently Asked Questions
1. What is the projected Compound Annual Growth Rate (CAGR) of the N-Methyl Pyrrolidone Industry?
The projected CAGR is approximately > 4.00%.
2. Which companies are prominent players in the N-Methyl Pyrrolidone Industry?
Key companies in the market include Prasol Chemicals Limited, Santa Cruz Biotechnology Inc, Puyang Guangming Chemical Co Ltd, Tokyo Chemical Industry Co Ltd*List Not Exhaustive, Hefei TNJ Chemical Industry Co Ltd, BALAJI AMINES, Mitsubishi Chemical Corporation, BYN Chemical Co Ltd, Ashland, Binzhou City Zhanhua District Ruian Chemical Co Ltd, BASF SE, Ganzhou Zhongneng Industrial Co Ltd, Eastman Chemical Company, Shandong Qingyun Changxin Chemical Science-Tech Co Ltd, LyondellBasell Industries Holdings BV.
3. What are the main segments of the N-Methyl Pyrrolidone Industry?
The market segments include Application.
4. Can you provide details about the market size?
The market size is estimated to be USD 1.03 Million as of 2022.
5. What are some drivers contributing to market growth?
Growing Demand From the Electronics Industry; Increasing Usage in the Pharmaceutical Industry.
6. What are the notable trends driving market growth?
Increasing Demand from Electronics Segment.
7. Are there any restraints impacting market growth?
N-methyl Pyrrolidone Hazards and Its Greener Alternatives.
8. Can you provide examples of recent developments in the market?
March 2024: Ganzhou Municipal Administration for Industry and Commerce announced the planned acceptance of the environmental impact assessment file for Ganzhou Zhongneng Industrial Co. Ltd, including the planned 150,000-ton NMP, 30,000-ton GBL, and 20,000-ton 2P expansion project. The company is expected to build a 50,000-ton NMP synthetic production line and a 50,000-ton NMP recovery refining production line.
9. What pricing options are available for accessing the report?
Pricing options include single-user, multi-user, and enterprise licenses priced at USD 4750, USD 5250, and USD 8750 respectively.
10. Is the market size provided in terms of value or volume?
The market size is provided in terms of value, measured in Million and volume, measured in K Tons.
11. Are there any specific market keywords associated with the report?
Yes, the market keyword associated with the report is "N-Methyl Pyrrolidone Industry," which aids in identifying and referencing the specific market segment covered.
12. How do I determine which pricing option suits my needs best?
The pricing options vary based on user requirements and access needs. Individual users may opt for single-user licenses, while businesses requiring broader access may choose multi-user or enterprise licenses for cost-effective access to the report.
13. Are there any additional resources or data provided in the N-Methyl Pyrrolidone Industry report?
While the report offers comprehensive insights, it's advisable to review the specific contents or supplementary materials provided to ascertain if additional resources or data are available.
14. How can I stay updated on further developments or reports in the N-Methyl Pyrrolidone Industry?
To stay informed about further developments, trends, and reports in the N-Methyl Pyrrolidone Industry, consider subscribing to industry newsletters, following relevant companies and organizations, or regularly checking reputable industry news sources and publications.
Methodology
Step 1 - Identification of Relevant Samples Size from Population Database


Step 2 - Approaches for Defining Global Market Size (Value, Volume* & Price*)

Note*: In applicable scenarios
Step 3 - Data Sources
Primary Research
- Web Analytics
- Survey Reports
- Research Institute
- Latest Research Reports
- Opinion Leaders
Secondary Research
- Annual Reports
- White Paper
- Latest Press Release
- Industry Association
- Paid Database
- Investor Presentations

Step 4 - Data Triangulation
Involves using different sources of information in order to increase the validity of a study
These sources are likely to be stakeholders in a program - participants, other researchers, program staff, other community members, and so on.
Then we put all data in single framework & apply various statistical tools to find out the dynamic on the market.
During the analysis stage, feedback from the stakeholder groups would be compared to determine areas of agreement as well as areas of divergence