

Key Insights
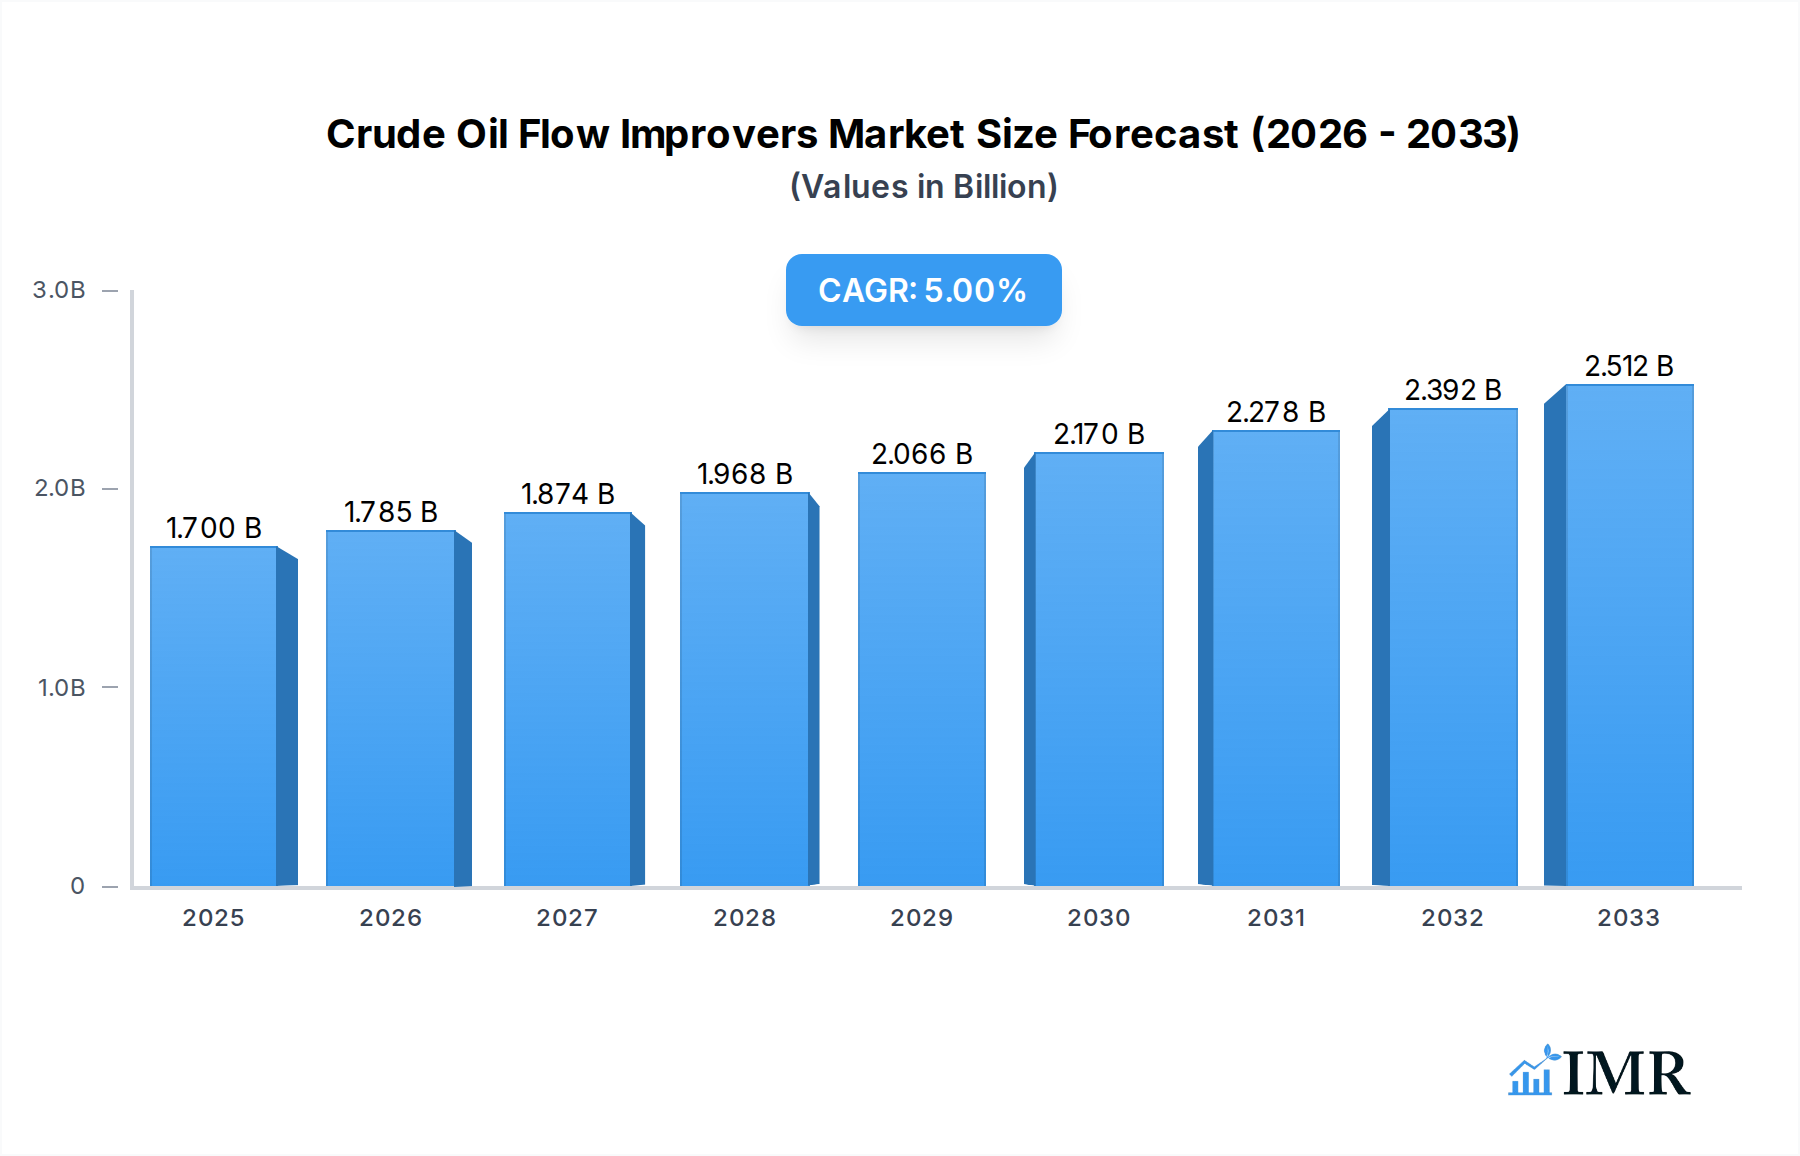
The global Crude Oil Flow Improvers Market is poised for significant expansion, projected to reach $1.7 Billion by 2025, with an impressive Compound Annual Growth Rate (CAGR) of 5.00% during the forecast period of 2025-2033. This robust growth is primarily propelled by the increasing demand for efficient crude oil extraction and transportation, driven by the relentless need for energy globally. Key growth drivers include the escalating complexities in upstream operations, the need to optimize pipeline throughput, and the imperative to reduce operational costs and environmental impact. As the world continues to rely on fossil fuels, enhancing the flow of crude oil through various stages of its lifecycle becomes paramount for maintaining production levels and ensuring economic viability, thereby fueling the demand for these specialized chemical solutions.

Crude Oil Flow Improvers Market Market Size (In Billion)
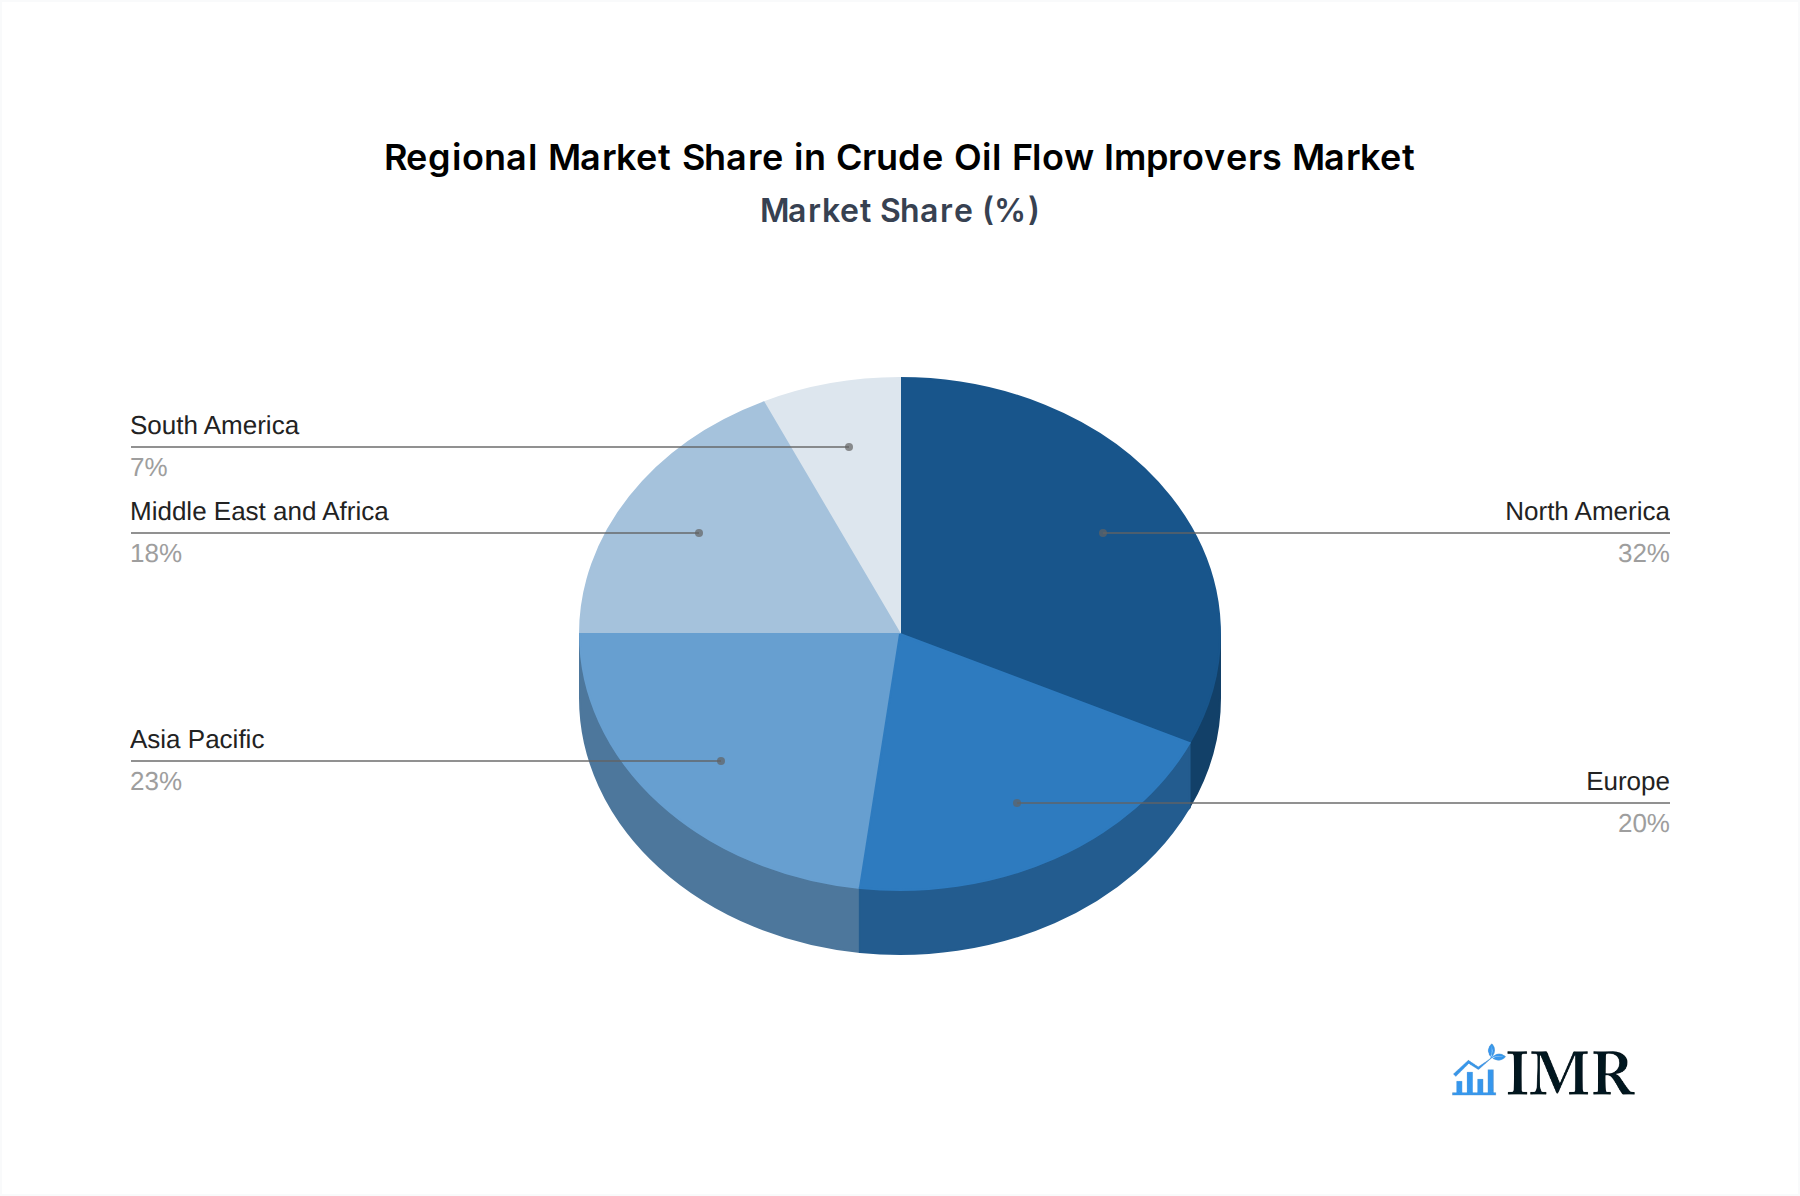
The market is segmented by improver type and application, offering diverse opportunities for key players. Paraffin and Asphaltene Inhibitors, along with Scale and Corrosion Inhibitors, are expected to witness substantial adoption due to the challenging geological formations and aging infrastructure encountered in oil fields. Drag Reducing Agents are also crucial for enhancing pipeline efficiency. Geographically, North America and the Middle East and Africa are anticipated to dominate the market, owing to their significant crude oil reserves and extensive exploration and production activities. However, the Asia Pacific region presents a rapidly growing market, driven by increasing energy consumption and ongoing investments in oil and gas infrastructure. Despite the positive outlook, challenges such as fluctuating crude oil prices, stringent environmental regulations, and the growing shift towards renewable energy sources pose potential restraints to market growth. Nonetheless, the ongoing innovation in chemical formulations and the persistent need for enhanced oil recovery and efficient logistics are expected to sustain the market's upward trajectory.
Crude Oil Flow Improvers Market Company Market Share
Unlock the future of upstream and midstream operations with our in-depth analysis of the Crude Oil Flow Improvers Market. This comprehensive report provides a critical examination of the global market, essential for stakeholders seeking to capitalize on evolving production and transportation demands. Covering the Study Period: 2019–2033, with a Base Year: 2025 and Forecast Period: 2025–2033, this report delivers unparalleled insights into market dynamics, growth trends, regional dominance, product landscapes, and key players.
The Global Crude Oil Flow Improvers Market is projected to reach XX Billion USD by 2025, with a projected Compound Annual Growth Rate (CAGR) of XX% during the forecast period. This robust growth is fueled by the increasing need for enhanced oil recovery, efficient pipeline transportation, and cost-effective processing in the face of complex extraction environments and fluctuating commodity prices.
Our analysis delves into both the Parent Market: Oilfield Chemicals and the specialized Child Market: Crude Oil Flow Improvers, providing a nuanced understanding of their interconnectedness and individual growth trajectories. We explore the critical role of flow improvers in optimizing production efficiency, minimizing operational downtime, and ensuring the safe and economic transport of crude oil.
Key segments analyzed include:
This report features a detailed examination of leading companies including: Dorf Ketal, PRODUCTION CHEMICAL GROUP, Baker Hughes, Alberta Treating Chemicals Limited, Croda International Plc, Ashland, BASF SE, Dow, Oil Flux, Halliburton, The Zoranoc Oilfield Chemical, Schlumberger Limited, Innospec.
- Improver Type: Paraffin & Asphaltene Inhibitors, Drag Reducing Agents, Scale & Corrosion Inhibitors, Hydrate & Hydrogen Sulfide Inhibitors, Others (Demulsifiers, Biocides, etc.)
- Application: Extraction, Pipelines & Transportation, Processing, Others
Crude Oil Flow Improvers Market Market Dynamics & Structure
The crude oil flow improvers market is characterized by a moderately concentrated structure, with key players like Baker Hughes, Schlumberger, and Halliburton holding significant market shares. Technological innovation is a primary driver, with ongoing research and development focused on creating more effective and environmentally friendly formulations for paraffin and asphaltene inhibition, drag reduction, and hydrate control. Regulatory frameworks, particularly those concerning environmental impact and chemical handling, influence product development and adoption. Competitive product substitutes, such as enhanced pumping systems and pipeline modifications, exist but often involve higher capital investment. End-user demographics are shifting towards operators seeking optimized production from mature fields and efficient handling of unconventional crudes. Merger and acquisition (M&A) trends, such as the acquisition of specialized chemical companies by larger oilfield service providers, are shaping the competitive landscape.
- Market Concentration: Moderate to high in North America and the Middle East due to the presence of major oilfield service companies.
- Technological Innovation Drivers: Development of high-performance additives for extreme temperatures and pressures, focus on biodegradable and low-toxicity solutions.
- Regulatory Frameworks: Increasing scrutiny on chemical usage and discharge, driving demand for compliant and sustainable flow improvers.
- Competitive Product Substitutes: Mechanical solutions (e.g., pigging, pumping stations) and process modifications.
- End-User Demographics: Growing demand from independent producers and national oil companies in emerging markets.
- M&A Trends: Consolidation within the oilfield chemical sector to broaden product portfolios and expand geographical reach.
Crude Oil Flow Improvers Market Growth Trends & Insights
The Crude Oil Flow Improvers Market is on a robust growth trajectory, propelled by the incessant demand for optimizing oil production and transportation efficiency across the globe. The market size, estimated at XX Billion USD in 2024, is anticipated to expand significantly, reaching an estimated XX Billion USD by 2025. This growth is underpinned by an accelerating adoption rate of advanced flow improvers, driven by their proven ability to mitigate operational challenges such as wax deposition, asphaltene precipitation, and hydrate formation. Technological disruptions, including the development of nanotechnology-based flow improvers and the integration of AI in chemical application optimization, are further augmenting market penetration. Consumer behavior shifts are evident, with an increasing preference for cost-effective, high-performance solutions that minimize environmental impact and reduce operational downtime. The CAGR of XX% projected for the forecast period highlights the sustained momentum of this market.
- Market Size Evolution: Witnessing consistent expansion driven by upstream production and midstream efficiency demands.
- Adoption Rates: Steadily increasing as operators recognize the economic and operational benefits of flow improvers.
- Technological Disruptions: Innovations in additive chemistry and application methods are key growth catalysts.
- Consumer Behavior Shifts: Growing emphasis on sustainability, cost-efficiency, and integrated chemical solutions.
- Market Penetration: Higher in mature oil-producing regions and expanding into new frontiers with challenging operating conditions.
Dominant Regions, Countries, or Segments in Crude Oil Flow Improvers Market
The North America region, particularly the United States and Canada, is a dominant force in the Crude Oil Flow Improvers Market. This dominance is largely driven by the extensive Pipelines & Transportation application segment, which is crucial for moving vast quantities of crude oil from production sites to refineries and export terminals. The region's mature oil industry, coupled with the significant production of unconventional resources like shale oil, necessitates the widespread use of flow improvers, especially Drag Reducing Agents (DRAs), to maintain efficient pipeline throughput and minimize energy consumption. Economic policies that support domestic energy production and infrastructure development further bolster demand.
Key drivers for North America's dominance include:
- Extensive Pipeline Network: A vast and aging pipeline infrastructure requires continuous maintenance and flow optimization.
- Shale Oil Production: The complex nature of shale oil extraction and transportation, often involving waxy crudes, creates a strong demand for paraffin inhibitors and DRAs.
- Technological Advancement: High levels of R&D investment in flow improver technologies by major oilfield service companies headquartered in the region.
- Market Share: North America accounts for an estimated XX% of the global crude oil flow improvers market.
- Growth Potential: Continued investment in energy infrastructure and the exploration of new oil reserves will sustain strong growth.
While North America leads, other regions like the Middle East (driven by Extraction and Processing applications for Scale & Corrosion Inhibitors) and Asia Pacific (experiencing rapid growth due to increasing energy demand and developing infrastructure, particularly for Pipelines & Transportation) are also significant contributors. The Improver Type segment of Drag Reducing Agents is experiencing substantial growth globally due to its critical role in pipeline efficiency.
Crude Oil Flow Improvers Market Product Landscape
The product landscape for crude oil flow improvers is defined by continuous innovation aimed at enhancing performance and addressing specific operational challenges. Key product types include highly effective paraffin and asphaltene inhibitors designed to prevent deposition and maintain fluid mobility in varying temperatures. Drag Reducing Agents (DRAs) are crucial for increasing pipeline throughput and reducing pumping energy consumption. Scale and corrosion inhibitors are essential for protecting infrastructure integrity by preventing mineral buildup and metal degradation. Hydrate and hydrogen sulfide inhibitors play a vital role in ensuring safety and preventing blockages in cold environments and sour crude applications. Emerging products are also focusing on multi-functional chemistries, offering combined benefits to reduce the number of chemical treatments required.
Key Drivers, Barriers & Challenges in Crude Oil Flow Improvers Market
Key Drivers: The primary forces propelling the Crude Oil Flow Improvers Market are the escalating global demand for crude oil, the need for enhanced oil recovery from mature fields, and the critical importance of efficient and cost-effective pipeline transportation. Technological advancements in chemical formulations, offering improved performance and environmental profiles, are significant catalysts. Favorable economic policies supporting oil and gas exploration and production also contribute to market growth.
Barriers & Challenges: Supply chain disruptions and the volatility of raw material prices pose significant challenges. Stringent environmental regulations concerning the use and disposal of chemicals can act as a barrier, necessitating the development of greener alternatives. Intense competition among established players and the emergence of new entrants can lead to price pressures. The capital-intensive nature of some flow improvement technologies and the long lead times for R&D and product qualification also present hurdles.
Emerging Opportunities in Crude Oil Flow Improvers Market
Emerging opportunities lie in the development of advanced, environmentally friendly flow improvers, particularly biodegradable formulations and those derived from sustainable sources. Untapped markets in regions with burgeoning oil and gas exploration, such as parts of Africa and South America, present significant growth potential. Innovative applications, including the use of smart chemicals that can adapt to changing wellbore conditions or real-time pipeline monitoring, are poised to capture market attention. Furthermore, the increasing focus on digitalization and data analytics in the oil and gas industry creates opportunities for integrated chemical management solutions that optimize the performance of flow improvers.
Growth Accelerators in the Crude Oil Flow Improvers Market Industry
Long-term growth in the Crude Oil Flow Improvers Market is being significantly accelerated by groundbreaking technological breakthroughs in additive chemistry, leading to more potent and specialized solutions. Strategic partnerships between chemical manufacturers, oilfield service companies, and research institutions are fostering collaborative innovation and faster market penetration of new products. Market expansion strategies targeting unconventional oil plays and deepwater exploration projects, which often present more complex flow challenges, are further driving growth. The continuous pursuit of operational efficiency and cost reduction by E&P companies globally remains a paramount accelerator for the adoption of effective flow improvers.
Key Players Shaping the Crude Oil Flow Improvers Market Market
- Dorf Ketal
- PRODUCTION CHEMICAL GROUP
- Baker Hughes
- Alberta Treating Chemicals Limited
- Croda International Plc
- Ashland
- BASF SE
- Dow
- Oil Flux
- Halliburton
- The Zoranoc Oilfield Chemical
- Schlumberger Limited
- Innospec
Notable Milestones in Crude Oil Flow Improvers Market Sector
- 2019/03: Baker Hughes introduces a new generation of drag-reducing agents for challenging pipeline applications.
- 2020/07: BASF SE launches an innovative paraffin inhibitor with enhanced low-temperature performance.
- 2021/11: Halliburton acquires a specialized chemical company to expand its flow assurance portfolio.
- 2022/05: Schlumberger Limited announces advancements in its hydrate inhibition technologies for deepwater operations.
- 2023/01: Croda International Plc highlights its commitment to sustainable chemical solutions in the oilfield sector.
In-Depth Crude Oil Flow Improvers Market Market Outlook
The future outlook for the Crude Oil Flow Improvers Market is exceptionally positive, driven by a confluence of sustained global energy demand and ongoing innovation. Growth accelerators like technological breakthroughs in environmentally benign chemistries and strategic alliances will continue to shape market expansion. The increasing focus on optimizing production from existing and maturing fields, coupled with the development of challenging new frontiers, ensures a consistent demand for advanced flow assurance solutions. Strategic opportunities abound in emerging economies and in the development of integrated digital platforms for chemical management, promising sustained growth and significant returns for stakeholders in this vital sector of the oil and gas industry.
Crude Oil Flow Improvers Market Segmentation
-
1. Improver Type
- 1.1. Paraffin & Asphaltene Inhibitors
- 1.2. Drag Reducing Agents
- 1.3. Scale & Corrosion Inhibitors
- 1.4. Hydrate & Hydrogen Sulfide Inhibitors
- 1.5. Others (Demulsifiers, Biocides, etc.,)
-
2. Application
- 2.1. Extraction
- 2.2. Pipelines & Transportation
- 2.3. Processing
- 2.4. Others
Crude Oil Flow Improvers Market Segmentation By Geography
-
1. Asia Pacific
- 1.1. China
- 1.2. India
- 1.3. Japan
- 1.4. South Korea
- 1.5. Rest of Asia Pacific
-
2. North America
- 2.1. United States
- 2.2. Canada
- 2.3. Mexico
-
3. Europe
- 3.1. Germany
- 3.2. United Kingdom
- 3.3. Italy
- 3.4. France
- 3.5. Rest of Europe
-
4. South America
- 4.1. Brazil
- 4.2. Argentina
- 4.3. Rest of South America
-
5. Middle East and Africa
- 5.1. Saudi Arabia
- 5.2. South Africa
- 5.3. Rest of Middle East and Africa
Crude Oil Flow Improvers Market Regional Market Share
Geographic Coverage of Crude Oil Flow Improvers Market
Crude Oil Flow Improvers Market REPORT HIGHLIGHTS
| Aspects | Details |
|---|---|
| Study Period | 2020-2034 |
| Base Year | 2025 |
| Estimated Year | 2026 |
| Forecast Period | 2026-2034 |
| Historical Period | 2020-2025 |
| Growth Rate | CAGR of 5.00% from 2020-2034 |
| Segmentation |
|
Table of Contents
- 1. Introduction
- 1.1. Research Scope
- 1.2. Market Segmentation
- 1.3. Research Objective
- 1.4. Definitions and Assumptions
- 2. Executive Summary
- 2.1. Market Snapshot
- 3. Market Dynamics
- 3.1. Market Drivers
- 3.2. Market Restrains
- 3.3. Market Trends
- 3.4. Market Opportunities
- 4. Market Factor Analysis
- 4.1. Porters Five Forces
- 4.1.1. Bargaining Power of Suppliers
- 4.1.2. Bargaining Power of Buyers
- 4.1.3. Threat of New Entrants
- 4.1.4. Threat of Substitutes
- 4.1.5. Competitive Rivalry
- 4.2. PESTEL analysis
- 4.3. BCG Analysis
- 4.3.1. Stars (High Growth, High Market Share)
- 4.3.2. Cash Cows (Low Growth, High Market Share)
- 4.3.3. Question Mark (High Growth, Low Market Share)
- 4.3.4. Dogs (Low Growth, Low Market Share)
- 4.4. Ansoff Matrix Analysis
- 4.5. Supply Chain Analysis
- 4.6. Regulatory Landscape
- 4.7. Current Market Potential and Opportunity Assessment (TAM–SAM–SOM Framework)
- 4.8. IMR Analyst Note
- 4.1. Porters Five Forces
- 5. Market Analysis, Insights and Forecast 2021-2033
- 5.1. Market Analysis, Insights and Forecast - by Improver Type
- 5.1.1. Paraffin & Asphaltene Inhibitors
- 5.1.2. Drag Reducing Agents
- 5.1.3. Scale & Corrosion Inhibitors
- 5.1.4. Hydrate & Hydrogen Sulfide Inhibitors
- 5.1.5. Others (Demulsifiers, Biocides, etc.,)
- 5.2. Market Analysis, Insights and Forecast - by Application
- 5.2.1. Extraction
- 5.2.2. Pipelines & Transportation
- 5.2.3. Processing
- 5.2.4. Others
- 5.3. Market Analysis, Insights and Forecast - by Region
- 5.3.1. Asia Pacific
- 5.3.2. North America
- 5.3.3. Europe
- 5.3.4. South America
- 5.3.5. Middle East and Africa
- 5.1. Market Analysis, Insights and Forecast - by Improver Type
- 6. Global Crude Oil Flow Improvers Market Analysis, Insights and Forecast, 2021-2033
- 6.1. Market Analysis, Insights and Forecast - by Improver Type
- 6.1.1. Paraffin & Asphaltene Inhibitors
- 6.1.2. Drag Reducing Agents
- 6.1.3. Scale & Corrosion Inhibitors
- 6.1.4. Hydrate & Hydrogen Sulfide Inhibitors
- 6.1.5. Others (Demulsifiers, Biocides, etc.,)
- 6.2. Market Analysis, Insights and Forecast - by Application
- 6.2.1. Extraction
- 6.2.2. Pipelines & Transportation
- 6.2.3. Processing
- 6.2.4. Others
- 6.1. Market Analysis, Insights and Forecast - by Improver Type
- 7. Asia Pacific Crude Oil Flow Improvers Market Analysis, Insights and Forecast, 2020-2032
- 7.1. Market Analysis, Insights and Forecast - by Improver Type
- 7.1.1. Paraffin & Asphaltene Inhibitors
- 7.1.2. Drag Reducing Agents
- 7.1.3. Scale & Corrosion Inhibitors
- 7.1.4. Hydrate & Hydrogen Sulfide Inhibitors
- 7.1.5. Others (Demulsifiers, Biocides, etc.,)
- 7.2. Market Analysis, Insights and Forecast - by Application
- 7.2.1. Extraction
- 7.2.2. Pipelines & Transportation
- 7.2.3. Processing
- 7.2.4. Others
- 7.1. Market Analysis, Insights and Forecast - by Improver Type
- 8. North America Crude Oil Flow Improvers Market Analysis, Insights and Forecast, 2020-2032
- 8.1. Market Analysis, Insights and Forecast - by Improver Type
- 8.1.1. Paraffin & Asphaltene Inhibitors
- 8.1.2. Drag Reducing Agents
- 8.1.3. Scale & Corrosion Inhibitors
- 8.1.4. Hydrate & Hydrogen Sulfide Inhibitors
- 8.1.5. Others (Demulsifiers, Biocides, etc.,)
- 8.2. Market Analysis, Insights and Forecast - by Application
- 8.2.1. Extraction
- 8.2.2. Pipelines & Transportation
- 8.2.3. Processing
- 8.2.4. Others
- 8.1. Market Analysis, Insights and Forecast - by Improver Type
- 9. Europe Crude Oil Flow Improvers Market Analysis, Insights and Forecast, 2020-2032
- 9.1. Market Analysis, Insights and Forecast - by Improver Type
- 9.1.1. Paraffin & Asphaltene Inhibitors
- 9.1.2. Drag Reducing Agents
- 9.1.3. Scale & Corrosion Inhibitors
- 9.1.4. Hydrate & Hydrogen Sulfide Inhibitors
- 9.1.5. Others (Demulsifiers, Biocides, etc.,)
- 9.2. Market Analysis, Insights and Forecast - by Application
- 9.2.1. Extraction
- 9.2.2. Pipelines & Transportation
- 9.2.3. Processing
- 9.2.4. Others
- 9.1. Market Analysis, Insights and Forecast - by Improver Type
- 10. South America Crude Oil Flow Improvers Market Analysis, Insights and Forecast, 2020-2032
- 10.1. Market Analysis, Insights and Forecast - by Improver Type
- 10.1.1. Paraffin & Asphaltene Inhibitors
- 10.1.2. Drag Reducing Agents
- 10.1.3. Scale & Corrosion Inhibitors
- 10.1.4. Hydrate & Hydrogen Sulfide Inhibitors
- 10.1.5. Others (Demulsifiers, Biocides, etc.,)
- 10.2. Market Analysis, Insights and Forecast - by Application
- 10.2.1. Extraction
- 10.2.2. Pipelines & Transportation
- 10.2.3. Processing
- 10.2.4. Others
- 10.1. Market Analysis, Insights and Forecast - by Improver Type
- 11. Middle East and Africa Crude Oil Flow Improvers Market Analysis, Insights and Forecast, 2020-2032
- 11.1. Market Analysis, Insights and Forecast - by Improver Type
- 11.1.1. Paraffin & Asphaltene Inhibitors
- 11.1.2. Drag Reducing Agents
- 11.1.3. Scale & Corrosion Inhibitors
- 11.1.4. Hydrate & Hydrogen Sulfide Inhibitors
- 11.1.5. Others (Demulsifiers, Biocides, etc.,)
- 11.2. Market Analysis, Insights and Forecast - by Application
- 11.2.1. Extraction
- 11.2.2. Pipelines & Transportation
- 11.2.3. Processing
- 11.2.4. Others
- 11.1. Market Analysis, Insights and Forecast - by Improver Type
- 12. Competitive Analysis
- 12.1. Company Profiles
- 12.1.1 Dorf Ketal
- 12.1.1.1. Company Overview
- 12.1.1.2. Products
- 12.1.1.3. Company Financials
- 12.1.1.4. SWOT Analysis
- 12.1.2 PRODUCTION CHEMICAL GROUP
- 12.1.2.1. Company Overview
- 12.1.2.2. Products
- 12.1.2.3. Company Financials
- 12.1.2.4. SWOT Analysis
- 12.1.3 Baker Hughes
- 12.1.3.1. Company Overview
- 12.1.3.2. Products
- 12.1.3.3. Company Financials
- 12.1.3.4. SWOT Analysis
- 12.1.4 Alberta Treating Chemicals Limited
- 12.1.4.1. Company Overview
- 12.1.4.2. Products
- 12.1.4.3. Company Financials
- 12.1.4.4. SWOT Analysis
- 12.1.5 Croda International Plc
- 12.1.5.1. Company Overview
- 12.1.5.2. Products
- 12.1.5.3. Company Financials
- 12.1.5.4. SWOT Analysis
- 12.1.6 Ashland
- 12.1.6.1. Company Overview
- 12.1.6.2. Products
- 12.1.6.3. Company Financials
- 12.1.6.4. SWOT Analysis
- 12.1.7 BASF SE
- 12.1.7.1. Company Overview
- 12.1.7.2. Products
- 12.1.7.3. Company Financials
- 12.1.7.4. SWOT Analysis
- 12.1.8 Dow
- 12.1.8.1. Company Overview
- 12.1.8.2. Products
- 12.1.8.3. Company Financials
- 12.1.8.4. SWOT Analysis
- 12.1.9 Oil Flux
- 12.1.9.1. Company Overview
- 12.1.9.2. Products
- 12.1.9.3. Company Financials
- 12.1.9.4. SWOT Analysis
- 12.1.10 Halliburton
- 12.1.10.1. Company Overview
- 12.1.10.2. Products
- 12.1.10.3. Company Financials
- 12.1.10.4. SWOT Analysis
- 12.1.11 The Zoranoc Oilfield Chemical
- 12.1.11.1. Company Overview
- 12.1.11.2. Products
- 12.1.11.3. Company Financials
- 12.1.11.4. SWOT Analysis
- 12.1.12 Schlumberger Limited
- 12.1.12.1. Company Overview
- 12.1.12.2. Products
- 12.1.12.3. Company Financials
- 12.1.12.4. SWOT Analysis
- 12.1.13 Innospec
- 12.1.13.1. Company Overview
- 12.1.13.2. Products
- 12.1.13.3. Company Financials
- 12.1.13.4. SWOT Analysis
- 12.1.1 Dorf Ketal
- 12.2. Market Entropy
- 12.2.1 Company's Key Areas Served
- 12.2.2 Recent Developments
- 12.3. Company Market Share Analysis 2025
- 12.3.1 Top 5 Companies Market Share Analysis
- 12.3.2 Top 3 Companies Market Share Analysis
- 12.4. List of Potential Customers
- 13. Research Methodology
List of Figures
- Figure 1: Global Crude Oil Flow Improvers Market Revenue Breakdown (Billion, %) by Region 2025 & 2033
- Figure 2: Global Crude Oil Flow Improvers Market Volume Breakdown (K Tons, %) by Region 2025 & 2033
- Figure 3: Asia Pacific Crude Oil Flow Improvers Market Revenue (Billion), by Improver Type 2025 & 2033
- Figure 4: Asia Pacific Crude Oil Flow Improvers Market Volume (K Tons), by Improver Type 2025 & 2033
- Figure 5: Asia Pacific Crude Oil Flow Improvers Market Revenue Share (%), by Improver Type 2025 & 2033
- Figure 6: Asia Pacific Crude Oil Flow Improvers Market Volume Share (%), by Improver Type 2025 & 2033
- Figure 7: Asia Pacific Crude Oil Flow Improvers Market Revenue (Billion), by Application 2025 & 2033
- Figure 8: Asia Pacific Crude Oil Flow Improvers Market Volume (K Tons), by Application 2025 & 2033
- Figure 9: Asia Pacific Crude Oil Flow Improvers Market Revenue Share (%), by Application 2025 & 2033
- Figure 10: Asia Pacific Crude Oil Flow Improvers Market Volume Share (%), by Application 2025 & 2033
- Figure 11: Asia Pacific Crude Oil Flow Improvers Market Revenue (Billion), by Country 2025 & 2033
- Figure 12: Asia Pacific Crude Oil Flow Improvers Market Volume (K Tons), by Country 2025 & 2033
- Figure 13: Asia Pacific Crude Oil Flow Improvers Market Revenue Share (%), by Country 2025 & 2033
- Figure 14: Asia Pacific Crude Oil Flow Improvers Market Volume Share (%), by Country 2025 & 2033
- Figure 15: North America Crude Oil Flow Improvers Market Revenue (Billion), by Improver Type 2025 & 2033
- Figure 16: North America Crude Oil Flow Improvers Market Volume (K Tons), by Improver Type 2025 & 2033
- Figure 17: North America Crude Oil Flow Improvers Market Revenue Share (%), by Improver Type 2025 & 2033
- Figure 18: North America Crude Oil Flow Improvers Market Volume Share (%), by Improver Type 2025 & 2033
- Figure 19: North America Crude Oil Flow Improvers Market Revenue (Billion), by Application 2025 & 2033
- Figure 20: North America Crude Oil Flow Improvers Market Volume (K Tons), by Application 2025 & 2033
- Figure 21: North America Crude Oil Flow Improvers Market Revenue Share (%), by Application 2025 & 2033
- Figure 22: North America Crude Oil Flow Improvers Market Volume Share (%), by Application 2025 & 2033
- Figure 23: North America Crude Oil Flow Improvers Market Revenue (Billion), by Country 2025 & 2033
- Figure 24: North America Crude Oil Flow Improvers Market Volume (K Tons), by Country 2025 & 2033
- Figure 25: North America Crude Oil Flow Improvers Market Revenue Share (%), by Country 2025 & 2033
- Figure 26: North America Crude Oil Flow Improvers Market Volume Share (%), by Country 2025 & 2033
- Figure 27: Europe Crude Oil Flow Improvers Market Revenue (Billion), by Improver Type 2025 & 2033
- Figure 28: Europe Crude Oil Flow Improvers Market Volume (K Tons), by Improver Type 2025 & 2033
- Figure 29: Europe Crude Oil Flow Improvers Market Revenue Share (%), by Improver Type 2025 & 2033
- Figure 30: Europe Crude Oil Flow Improvers Market Volume Share (%), by Improver Type 2025 & 2033
- Figure 31: Europe Crude Oil Flow Improvers Market Revenue (Billion), by Application 2025 & 2033
- Figure 32: Europe Crude Oil Flow Improvers Market Volume (K Tons), by Application 2025 & 2033
- Figure 33: Europe Crude Oil Flow Improvers Market Revenue Share (%), by Application 2025 & 2033
- Figure 34: Europe Crude Oil Flow Improvers Market Volume Share (%), by Application 2025 & 2033
- Figure 35: Europe Crude Oil Flow Improvers Market Revenue (Billion), by Country 2025 & 2033
- Figure 36: Europe Crude Oil Flow Improvers Market Volume (K Tons), by Country 2025 & 2033
- Figure 37: Europe Crude Oil Flow Improvers Market Revenue Share (%), by Country 2025 & 2033
- Figure 38: Europe Crude Oil Flow Improvers Market Volume Share (%), by Country 2025 & 2033
- Figure 39: South America Crude Oil Flow Improvers Market Revenue (Billion), by Improver Type 2025 & 2033
- Figure 40: South America Crude Oil Flow Improvers Market Volume (K Tons), by Improver Type 2025 & 2033
- Figure 41: South America Crude Oil Flow Improvers Market Revenue Share (%), by Improver Type 2025 & 2033
- Figure 42: South America Crude Oil Flow Improvers Market Volume Share (%), by Improver Type 2025 & 2033
- Figure 43: South America Crude Oil Flow Improvers Market Revenue (Billion), by Application 2025 & 2033
- Figure 44: South America Crude Oil Flow Improvers Market Volume (K Tons), by Application 2025 & 2033
- Figure 45: South America Crude Oil Flow Improvers Market Revenue Share (%), by Application 2025 & 2033
- Figure 46: South America Crude Oil Flow Improvers Market Volume Share (%), by Application 2025 & 2033
- Figure 47: South America Crude Oil Flow Improvers Market Revenue (Billion), by Country 2025 & 2033
- Figure 48: South America Crude Oil Flow Improvers Market Volume (K Tons), by Country 2025 & 2033
- Figure 49: South America Crude Oil Flow Improvers Market Revenue Share (%), by Country 2025 & 2033
- Figure 50: South America Crude Oil Flow Improvers Market Volume Share (%), by Country 2025 & 2033
- Figure 51: Middle East and Africa Crude Oil Flow Improvers Market Revenue (Billion), by Improver Type 2025 & 2033
- Figure 52: Middle East and Africa Crude Oil Flow Improvers Market Volume (K Tons), by Improver Type 2025 & 2033
- Figure 53: Middle East and Africa Crude Oil Flow Improvers Market Revenue Share (%), by Improver Type 2025 & 2033
- Figure 54: Middle East and Africa Crude Oil Flow Improvers Market Volume Share (%), by Improver Type 2025 & 2033
- Figure 55: Middle East and Africa Crude Oil Flow Improvers Market Revenue (Billion), by Application 2025 & 2033
- Figure 56: Middle East and Africa Crude Oil Flow Improvers Market Volume (K Tons), by Application 2025 & 2033
- Figure 57: Middle East and Africa Crude Oil Flow Improvers Market Revenue Share (%), by Application 2025 & 2033
- Figure 58: Middle East and Africa Crude Oil Flow Improvers Market Volume Share (%), by Application 2025 & 2033
- Figure 59: Middle East and Africa Crude Oil Flow Improvers Market Revenue (Billion), by Country 2025 & 2033
- Figure 60: Middle East and Africa Crude Oil Flow Improvers Market Volume (K Tons), by Country 2025 & 2033
- Figure 61: Middle East and Africa Crude Oil Flow Improvers Market Revenue Share (%), by Country 2025 & 2033
- Figure 62: Middle East and Africa Crude Oil Flow Improvers Market Volume Share (%), by Country 2025 & 2033
List of Tables
- Table 1: Global Crude Oil Flow Improvers Market Revenue Billion Forecast, by Improver Type 2020 & 2033
- Table 2: Global Crude Oil Flow Improvers Market Volume K Tons Forecast, by Improver Type 2020 & 2033
- Table 3: Global Crude Oil Flow Improvers Market Revenue Billion Forecast, by Application 2020 & 2033
- Table 4: Global Crude Oil Flow Improvers Market Volume K Tons Forecast, by Application 2020 & 2033
- Table 5: Global Crude Oil Flow Improvers Market Revenue Billion Forecast, by Region 2020 & 2033
- Table 6: Global Crude Oil Flow Improvers Market Volume K Tons Forecast, by Region 2020 & 2033
- Table 7: Global Crude Oil Flow Improvers Market Revenue Billion Forecast, by Improver Type 2020 & 2033
- Table 8: Global Crude Oil Flow Improvers Market Volume K Tons Forecast, by Improver Type 2020 & 2033
- Table 9: Global Crude Oil Flow Improvers Market Revenue Billion Forecast, by Application 2020 & 2033
- Table 10: Global Crude Oil Flow Improvers Market Volume K Tons Forecast, by Application 2020 & 2033
- Table 11: Global Crude Oil Flow Improvers Market Revenue Billion Forecast, by Country 2020 & 2033
- Table 12: Global Crude Oil Flow Improvers Market Volume K Tons Forecast, by Country 2020 & 2033
- Table 13: China Crude Oil Flow Improvers Market Revenue (Billion) Forecast, by Application 2020 & 2033
- Table 14: China Crude Oil Flow Improvers Market Volume (K Tons) Forecast, by Application 2020 & 2033
- Table 15: India Crude Oil Flow Improvers Market Revenue (Billion) Forecast, by Application 2020 & 2033
- Table 16: India Crude Oil Flow Improvers Market Volume (K Tons) Forecast, by Application 2020 & 2033
- Table 17: Japan Crude Oil Flow Improvers Market Revenue (Billion) Forecast, by Application 2020 & 2033
- Table 18: Japan Crude Oil Flow Improvers Market Volume (K Tons) Forecast, by Application 2020 & 2033
- Table 19: South Korea Crude Oil Flow Improvers Market Revenue (Billion) Forecast, by Application 2020 & 2033
- Table 20: South Korea Crude Oil Flow Improvers Market Volume (K Tons) Forecast, by Application 2020 & 2033
- Table 21: Rest of Asia Pacific Crude Oil Flow Improvers Market Revenue (Billion) Forecast, by Application 2020 & 2033
- Table 22: Rest of Asia Pacific Crude Oil Flow Improvers Market Volume (K Tons) Forecast, by Application 2020 & 2033
- Table 23: Global Crude Oil Flow Improvers Market Revenue Billion Forecast, by Improver Type 2020 & 2033
- Table 24: Global Crude Oil Flow Improvers Market Volume K Tons Forecast, by Improver Type 2020 & 2033
- Table 25: Global Crude Oil Flow Improvers Market Revenue Billion Forecast, by Application 2020 & 2033
- Table 26: Global Crude Oil Flow Improvers Market Volume K Tons Forecast, by Application 2020 & 2033
- Table 27: Global Crude Oil Flow Improvers Market Revenue Billion Forecast, by Country 2020 & 2033
- Table 28: Global Crude Oil Flow Improvers Market Volume K Tons Forecast, by Country 2020 & 2033
- Table 29: United States Crude Oil Flow Improvers Market Revenue (Billion) Forecast, by Application 2020 & 2033
- Table 30: United States Crude Oil Flow Improvers Market Volume (K Tons) Forecast, by Application 2020 & 2033
- Table 31: Canada Crude Oil Flow Improvers Market Revenue (Billion) Forecast, by Application 2020 & 2033
- Table 32: Canada Crude Oil Flow Improvers Market Volume (K Tons) Forecast, by Application 2020 & 2033
- Table 33: Mexico Crude Oil Flow Improvers Market Revenue (Billion) Forecast, by Application 2020 & 2033
- Table 34: Mexico Crude Oil Flow Improvers Market Volume (K Tons) Forecast, by Application 2020 & 2033
- Table 35: Global Crude Oil Flow Improvers Market Revenue Billion Forecast, by Improver Type 2020 & 2033
- Table 36: Global Crude Oil Flow Improvers Market Volume K Tons Forecast, by Improver Type 2020 & 2033
- Table 37: Global Crude Oil Flow Improvers Market Revenue Billion Forecast, by Application 2020 & 2033
- Table 38: Global Crude Oil Flow Improvers Market Volume K Tons Forecast, by Application 2020 & 2033
- Table 39: Global Crude Oil Flow Improvers Market Revenue Billion Forecast, by Country 2020 & 2033
- Table 40: Global Crude Oil Flow Improvers Market Volume K Tons Forecast, by Country 2020 & 2033
- Table 41: Germany Crude Oil Flow Improvers Market Revenue (Billion) Forecast, by Application 2020 & 2033
- Table 42: Germany Crude Oil Flow Improvers Market Volume (K Tons) Forecast, by Application 2020 & 2033
- Table 43: United Kingdom Crude Oil Flow Improvers Market Revenue (Billion) Forecast, by Application 2020 & 2033
- Table 44: United Kingdom Crude Oil Flow Improvers Market Volume (K Tons) Forecast, by Application 2020 & 2033
- Table 45: Italy Crude Oil Flow Improvers Market Revenue (Billion) Forecast, by Application 2020 & 2033
- Table 46: Italy Crude Oil Flow Improvers Market Volume (K Tons) Forecast, by Application 2020 & 2033
- Table 47: France Crude Oil Flow Improvers Market Revenue (Billion) Forecast, by Application 2020 & 2033
- Table 48: France Crude Oil Flow Improvers Market Volume (K Tons) Forecast, by Application 2020 & 2033
- Table 49: Rest of Europe Crude Oil Flow Improvers Market Revenue (Billion) Forecast, by Application 2020 & 2033
- Table 50: Rest of Europe Crude Oil Flow Improvers Market Volume (K Tons) Forecast, by Application 2020 & 2033
- Table 51: Global Crude Oil Flow Improvers Market Revenue Billion Forecast, by Improver Type 2020 & 2033
- Table 52: Global Crude Oil Flow Improvers Market Volume K Tons Forecast, by Improver Type 2020 & 2033
- Table 53: Global Crude Oil Flow Improvers Market Revenue Billion Forecast, by Application 2020 & 2033
- Table 54: Global Crude Oil Flow Improvers Market Volume K Tons Forecast, by Application 2020 & 2033
- Table 55: Global Crude Oil Flow Improvers Market Revenue Billion Forecast, by Country 2020 & 2033
- Table 56: Global Crude Oil Flow Improvers Market Volume K Tons Forecast, by Country 2020 & 2033
- Table 57: Brazil Crude Oil Flow Improvers Market Revenue (Billion) Forecast, by Application 2020 & 2033
- Table 58: Brazil Crude Oil Flow Improvers Market Volume (K Tons) Forecast, by Application 2020 & 2033
- Table 59: Argentina Crude Oil Flow Improvers Market Revenue (Billion) Forecast, by Application 2020 & 2033
- Table 60: Argentina Crude Oil Flow Improvers Market Volume (K Tons) Forecast, by Application 2020 & 2033
- Table 61: Rest of South America Crude Oil Flow Improvers Market Revenue (Billion) Forecast, by Application 2020 & 2033
- Table 62: Rest of South America Crude Oil Flow Improvers Market Volume (K Tons) Forecast, by Application 2020 & 2033
- Table 63: Global Crude Oil Flow Improvers Market Revenue Billion Forecast, by Improver Type 2020 & 2033
- Table 64: Global Crude Oil Flow Improvers Market Volume K Tons Forecast, by Improver Type 2020 & 2033
- Table 65: Global Crude Oil Flow Improvers Market Revenue Billion Forecast, by Application 2020 & 2033
- Table 66: Global Crude Oil Flow Improvers Market Volume K Tons Forecast, by Application 2020 & 2033
- Table 67: Global Crude Oil Flow Improvers Market Revenue Billion Forecast, by Country 2020 & 2033
- Table 68: Global Crude Oil Flow Improvers Market Volume K Tons Forecast, by Country 2020 & 2033
- Table 69: Saudi Arabia Crude Oil Flow Improvers Market Revenue (Billion) Forecast, by Application 2020 & 2033
- Table 70: Saudi Arabia Crude Oil Flow Improvers Market Volume (K Tons) Forecast, by Application 2020 & 2033
- Table 71: South Africa Crude Oil Flow Improvers Market Revenue (Billion) Forecast, by Application 2020 & 2033
- Table 72: South Africa Crude Oil Flow Improvers Market Volume (K Tons) Forecast, by Application 2020 & 2033
- Table 73: Rest of Middle East and Africa Crude Oil Flow Improvers Market Revenue (Billion) Forecast, by Application 2020 & 2033
- Table 74: Rest of Middle East and Africa Crude Oil Flow Improvers Market Volume (K Tons) Forecast, by Application 2020 & 2033
Frequently Asked Questions
1. What is the projected Compound Annual Growth Rate (CAGR) of the Crude Oil Flow Improvers Market?
The projected CAGR is approximately 5.00%.
2. Which companies are prominent players in the Crude Oil Flow Improvers Market?
Key companies in the market include Dorf Ketal, PRODUCTION CHEMICAL GROUP, Baker Hughes, Alberta Treating Chemicals Limited, Croda International Plc, Ashland, BASF SE, Dow, Oil Flux, Halliburton, The Zoranoc Oilfield Chemical, Schlumberger Limited, Innospec.
3. What are the main segments of the Crude Oil Flow Improvers Market?
The market segments include Improver Type, Application.
4. Can you provide details about the market size?
The market size is estimated to be USD 1.7 Billion as of 2022.
5. What are some drivers contributing to market growth?
; Growing Demand For Paraffin & Asphaltene Inhibitors; Increasing Demand for Petroleum Based Products.
6. What are the notable trends driving market growth?
Growing Demand for Paraffin & Asphaltene Inhibitors.
7. Are there any restraints impacting market growth?
; Stringent Environmental Regulations; Unfavourable Conditions Arising Due to the COVID-19 Outbreak.
8. Can you provide examples of recent developments in the market?
N/A
9. What pricing options are available for accessing the report?
Pricing options include single-user, multi-user, and enterprise licenses priced at USD 3,950, USD 4,950, and USD 6,950 respectively.
10. Is the market size provided in terms of value or volume?
The market size is provided in terms of value, measured in Billion and volume, measured in K Tons.
11. Are there any specific market keywords associated with the report?
Yes, the market keyword associated with the report is "Crude Oil Flow Improvers Market," which aids in identifying and referencing the specific market segment covered.
12. How do I determine which pricing option suits my needs best?
The pricing options vary based on user requirements and access needs. Individual users may opt for single-user licenses, while businesses requiring broader access may choose multi-user or enterprise licenses for cost-effective access to the report.
13. Are there any additional resources or data provided in the Crude Oil Flow Improvers Market report?
While the report offers comprehensive insights, it's advisable to review the specific contents or supplementary materials provided to ascertain if additional resources or data are available.
14. How can I stay updated on further developments or reports in the Crude Oil Flow Improvers Market?
To stay informed about further developments, trends, and reports in the Crude Oil Flow Improvers Market, consider subscribing to industry newsletters, following relevant companies and organizations, or regularly checking reputable industry news sources and publications.
Methodology
Step 1 - Identification of Relevant Samples Size from Population Database


Step 2 - Approaches for Defining Global Market Size (Value, Volume* & Price*)

Note*: In applicable scenarios
Step 3 - Data Sources
Primary Research
- Web Analytics
- Survey Reports
- Research Institute
- Latest Research Reports
- Opinion Leaders
Secondary Research
- Annual Reports
- White Paper
- Latest Press Release
- Industry Association
- Paid Database
- Investor Presentations

Step 4 - Data Triangulation
Involves using different sources of information in order to increase the validity of a study
These sources are likely to be stakeholders in a program - participants, other researchers, program staff, other community members, and so on.
Then we put all data in single framework & apply various statistical tools to find out the dynamic on the market.
During the analysis stage, feedback from the stakeholder groups would be compared to determine areas of agreement as well as areas of divergence