

Key Insights
The global methanol market is poised for steady expansion, projected to reach an estimated $38.74 billion in 2025. This growth will be propelled by an increasing demand for methanol as a key feedstock in the production of various chemicals and its emerging role in the energy sector. Traditional applications, including formaldehyde, acetic acid, and solvents, continue to be significant drivers, catering to industries like construction, automotive, and textiles. However, the market's trajectory is increasingly being shaped by its integration into energy-related applications. Methanol-to-olefin (MTO) processes are gaining traction, especially in regions with abundant natural gas or coal resources, as they offer a viable route to produce olefins, crucial building blocks for plastics. Furthermore, methanol's potential as a clean-burning fuel additive, such as in gasoline blending and as a precursor for dimethyl ether (DME), is gaining momentum. The market is anticipated to grow at a Compound Annual Growth Rate (CAGR) of 2.7% during the forecast period of 2025-2033, indicating sustained but moderate expansion.
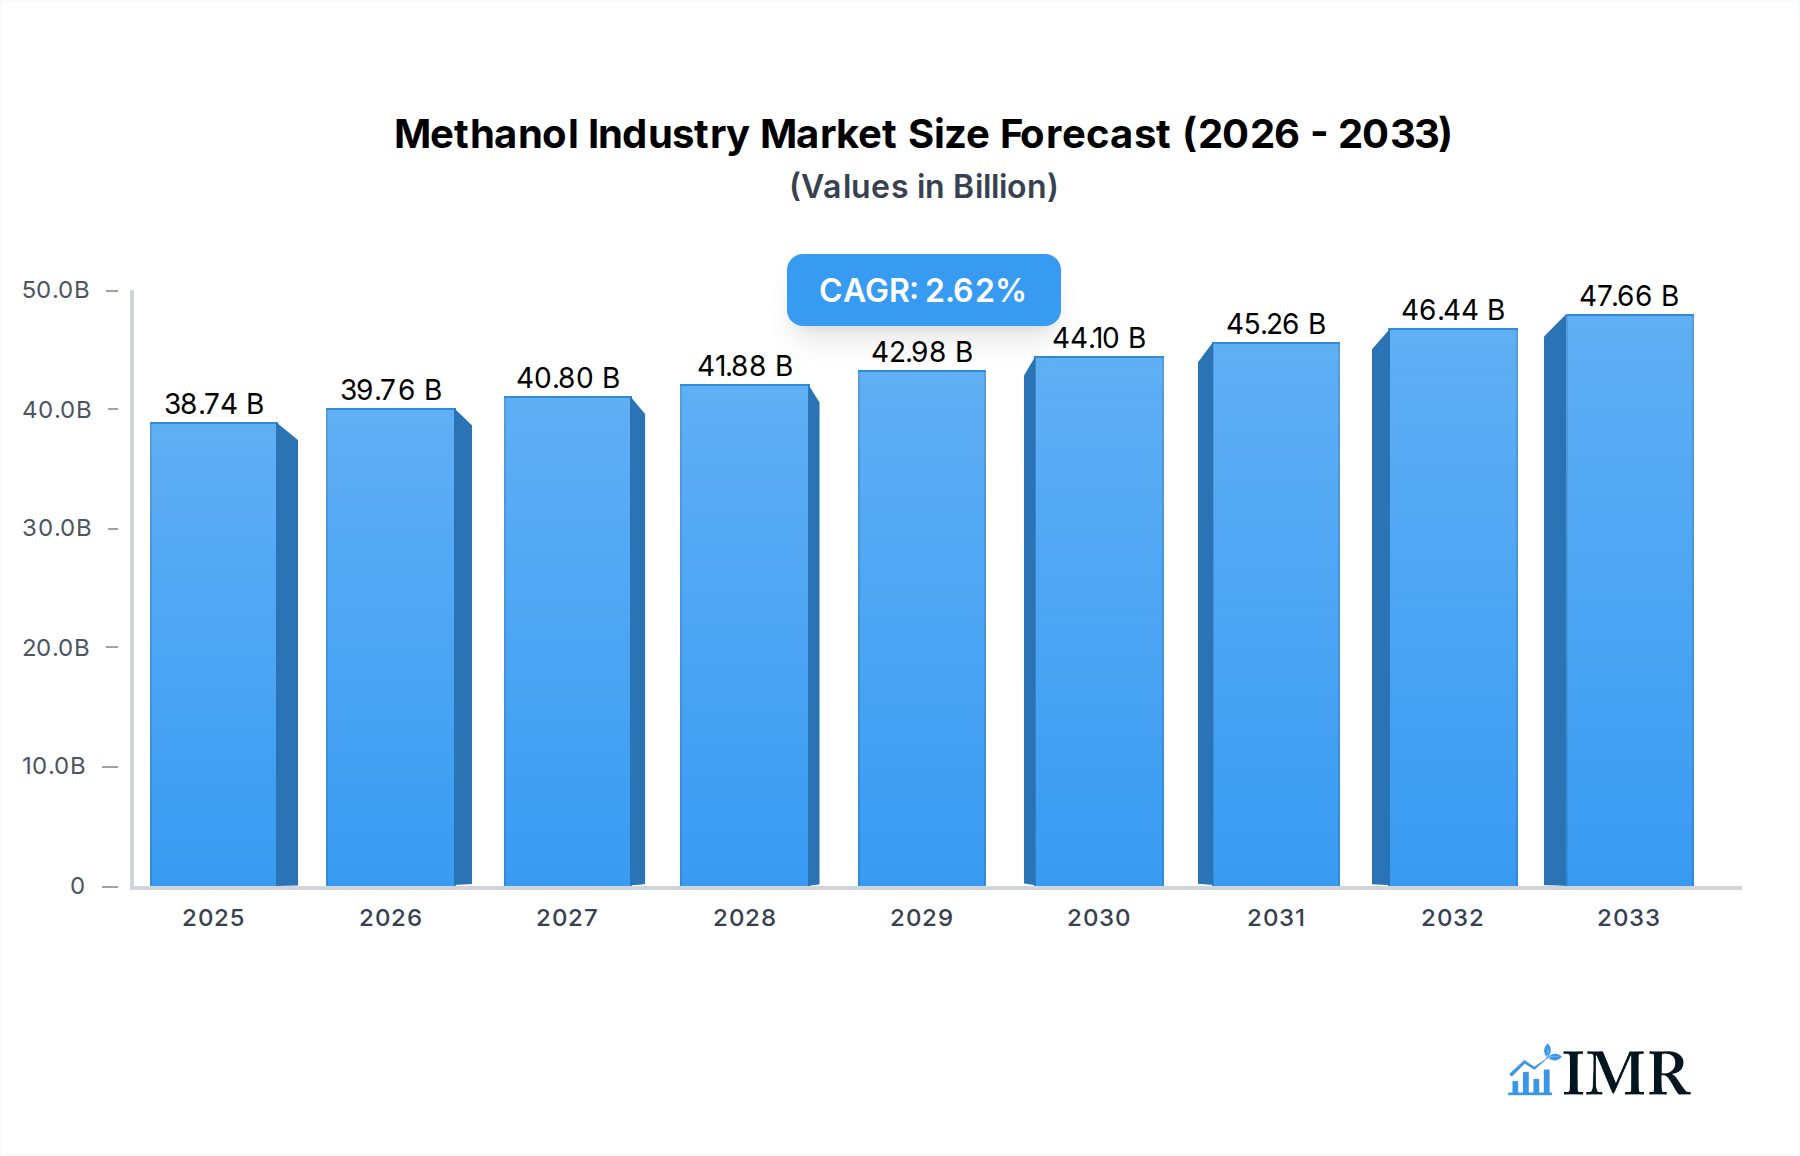
Methanol Industry Market Size (In Billion)
While the market benefits from strong fundamental demand and diversifying applications, it faces certain challenges. Fluctuations in the price of natural gas and coal, the primary feedstocks for methanol production, can impact profitability and investment decisions. Geopolitical factors and supply chain disruptions can also introduce volatility. Additionally, the development and widespread adoption of alternative fuels and feedstocks could present long-term competitive pressures. Despite these challenges, the inherent versatility of methanol, its established production infrastructure, and its increasing importance in both chemical synthesis and energy solutions suggest a resilient market outlook. Key regions such as Asia Pacific, driven by robust industrial activity in China and India, are expected to remain dominant, while North America and Europe are also significant contributors to demand, with growing interest in methanol's role in decarbonization efforts.

Methanol Industry Company Market Share
Methanol Industry Market Analysis: Global Trends, Opportunities, and Key Players (2019-2033)
This comprehensive report provides an in-depth analysis of the global Methanol Industry, covering market dynamics, growth trends, regional dominance, product landscape, key drivers, emerging opportunities, and a detailed outlook for the period of 2019–2033. With a base year of 2025, this report leverages high-traffic keywords such as "global methanol market," "methanol production," "methanol applications," "renewable methanol," "e-methanol," "methanol-to-olefin (MTO)," "acetic acid production," and "formaldehyde industry" to offer unparalleled SEO optimization for industry professionals. The report details parent and child market segments, providing a granular understanding of the entire value chain. All market values are presented in billion units for clarity and ease of understanding.
Methanol Industry Market Dynamics & Structure
The Methanol Industry is characterized by a moderate market concentration, with several key global players dominating production. Technological innovation is a significant driver, particularly in the development of sustainable and renewable methanol, such as e-methanol and biomethanol, influenced by stringent regulatory frameworks and growing environmental consciousness. Competitive product substitutes, while present in certain niche applications, are increasingly challenged by methanol's versatility and expanding use in the energy sector. End-user demographics are diversifying, with a strong shift towards chemical synthesis and a burgeoning demand in the energy transition. Mergers and acquisitions (M&A) are a recurring trend, aimed at expanding production capacity, securing feedstock, and investing in green technologies.
- Market Concentration: Moderate, with significant influence from major chemical and energy companies.
- Technological Innovation: Driven by the pursuit of sustainable production methods (e.g., green hydrogen, CO2 utilization) and advanced applications in MTO and fuel blending.
- Regulatory Frameworks: Increasing influence of environmental regulations and carbon emission targets, fostering the adoption of cleaner methanol production.
- Competitive Product Substitutes: Limited in core chemical applications, but facing competition from alternative fuels in energy-related segments.
- End-User Demographics: Primarily chemical manufacturers, followed by growing demand from the energy sector for cleaner fuel alternatives and MTO processes.
- M&A Trends: Focused on capacity expansion, feedstock security, and investments in sustainable methanol technologies.
Methanol Industry Growth Trends & Insights
The global Methanol Industry is poised for robust growth, projected to reach an estimated $XX billion by 2025, exhibiting a compound annual growth rate (CAGR) of approximately X.X% during the forecast period of 2025–2033. This expansion is significantly fueled by the increasing demand for methanol as a crucial building block in the production of various chemicals, including formaldehyde, acetic acid, and solvents, which form the backbone of numerous downstream industries. The energy sector's growing embrace of methanol as a cleaner fuel alternative and its pivotal role in Methanol-to-Olefin (MTO) processes are also substantial growth accelerators. Adoption rates for sustainable methanol technologies, such as e-methanol produced from renewable energy sources and captured carbon dioxide, are on an upward trajectory, driven by global decarbonization efforts and corporate sustainability goals. Technological disruptions, including advancements in catalytic processes and feedstock diversification, are further enhancing production efficiency and opening new avenues for market penetration. Consumer behavior shifts towards environmentally conscious products and energy solutions are indirectly stimulating demand for green methanol and its derivatives. The market penetration of methanol in traditional chemical applications remains high, while its penetration in emerging energy-related applications is witnessing rapid acceleration.
Dominant Regions, Countries, or Segments in Methanol Industry
The Traditional Chemical segment, particularly the application of methanol in Formaldehyde production, stands as a dominant force in the global Methanol Industry. Formaldehyde, a key intermediate in the manufacturing of resins for plywood, particleboard, and textiles, along with its use in pharmaceuticals and disinfectants, drives significant and consistent demand for methanol. The sheer volume of construction and manufacturing activities globally underpins the sustained growth of this segment. Asia Pacific, led by China, is the leading region in methanol consumption due to its massive manufacturing base and substantial investments in chemical production facilities. Government initiatives promoting industrialization, coupled with the availability of large-scale production capacities, further solidify this region's dominance.
Dominant Segment: Traditional Chemical – Formaldehyde
- Key Drivers: Widespread use in resins, construction materials, automotive components, and consumer goods.
- Market Share: Expected to hold a substantial share of the global methanol market due to its established industrial applications.
- Growth Potential: Steady growth projected, aligned with global industrial output and infrastructure development.
Leading Region: Asia Pacific (especially China)
- Key Drivers: Large industrial manufacturing base, significant downstream chemical production, and government support for the chemical industry.
- Market Share: Accounts for the largest share of global methanol consumption and production.
- Growth Potential: High, driven by ongoing industrial expansion and a growing middle class demanding consumer products.
While Formaldehyde leads, the Energy Related segment is experiencing remarkable growth, particularly Methanol-to-Olefin (MTO). This process converts methanol into light olefins like ethylene and propylene, which are essential precursors for plastics. The burgeoning demand for plastics in packaging, automotive, and consumer goods, especially in emerging economies, is a major catalyst for MTO technology adoption. Countries in the Middle East and Asia are heavily investing in MTO plants due to access to abundant natural gas feedstock, which can be converted into methanol.
- Emerging Dominant Segment: Energy Related – Methanol-to-Olefin (MTO)
- Key Drivers: Increasing demand for plastics and petrochemicals, feedstock flexibility, and strategic investments in Asia and the Middle East.
- Market Share: Rapidly growing and projected to capture a significant share in the coming years.
- Growth Potential: Very high, driven by the global demand for olefins and the economic viability of MTO processes.
Other significant applications within the Traditional Chemical segment include Acetic Acid, used in the production of VAM, PTA, and solvents, and Solvents, finding applications across paints, coatings, and cleaning agents. In the Energy Related segment, Methyl Tert-butyl Ether (MTBE), although facing regulatory scrutiny in some regions due to environmental concerns, remains a significant gasoline additive. Gasoline Blending and Dimethyl Ether (DME) as a clean fuel alternative are also gaining traction. The production of Biodiesel using methanol is another developing area, contributing to the renewable energy landscape.
Methanol Industry Product Landscape
The Methanol Industry product landscape is defined by its foundational role as a chemical intermediate and its evolving applications in sustainable energy. Traditional applications, such as formaldehyde, acetic acid, and various solvents, remain robust pillars of demand. However, significant innovation is occurring in the production and utilization of sustainable methanol, including e-methanol produced from renewable electricity and captured CO2, and biomethanol derived from biomass. These green alternatives offer a lower carbon footprint, catering to increasing environmental regulations and corporate sustainability mandates. Technological advancements in catalysis are enhancing the efficiency of methanol production and its conversion into higher-value products, such as olefins via MTO processes, and clean fuels like DME. The performance metrics are increasingly scrutinized through the lens of environmental impact and lifecycle assessment.
Key Drivers, Barriers & Challenges in Methanol Industry
Key Drivers:
- Growing Demand for Petrochemicals: Methanol is a primary feedstock for numerous petrochemicals, including formaldehyde, acetic acid, and olefins via MTO.
- Energy Transition & Renewable Fuels: Increasing interest in methanol as a cleaner fuel for shipping, transportation, and power generation, especially renewable and e-methanol.
- Government Policies & Regulations: Favorable policies promoting sustainable chemicals and emission reduction targets are driving the adoption of green methanol.
- Technological Advancements: Innovations in production efficiency, CO2 capture, and renewable energy integration are making methanol production more sustainable and cost-effective.
Key Barriers & Challenges:
- Feedstock Price Volatility: Fluctuations in natural gas prices, a primary feedstock, directly impact methanol production costs.
- Infrastructure Development: The establishment of robust infrastructure for methanol bunkering and distribution for fuel applications requires significant investment.
- Environmental Concerns & Regulations: While driving demand for green methanol, stringent regulations on traditional production methods and emissions can pose compliance challenges.
- Competition from Alternative Feedstocks: Other petrochemical feedstocks can compete with methanol in certain downstream applications.
- Supply Chain Disruptions: Geopolitical events and logistical challenges can impact the global supply and price of methanol.
Emerging Opportunities in Methanol Industry
Emerging opportunities within the Methanol Industry are predominantly centered around the burgeoning demand for sustainable and green methanol. The development and scaling-up of e-methanol production, utilizing renewable electricity and captured carbon dioxide, present a significant avenue for growth, catering to the shipping and aviation industries' decarbonization efforts. Similarly, advancements in biomethanol production from waste streams and agricultural residues offer another sustainable pathway. The potential for methanol as a hydrogen carrier is also an exciting prospect, facilitating the transport and storage of green hydrogen. Furthermore, the expanding use of methanol in Methanol-to-Olefin (MTO) processes in regions with abundant natural gas or coal reserves continues to offer growth potential, particularly in Asia. Untapped markets in regions with strong renewable energy potential are ripe for investment in green methanol production facilities.
Growth Accelerators in the Methanol Industry Industry
Several catalysts are accelerating long-term growth in the Methanol Industry. The global push towards decarbonization and the establishment of ambitious emission reduction targets are paramount, driving significant investment in renewable methanol production technologies. Strategic partnerships between chemical producers, energy companies, and technology providers are crucial for developing and commercializing these sustainable solutions. For instance, collaborations focused on green hydrogen production and CO2 capture are vital for e-methanol. Market expansion strategies are increasingly targeting new applications, such as methanol-powered shipping and its use as a stable energy carrier. The increasing cost-competitiveness of renewable energy sources also makes green methanol more economically viable, further accelerating its adoption and driving overall market growth.
Key Players Shaping the Methanol Industry Market
- Lyondellbasell Industries Holdings BV
- Enerkem
- Coogee
- Kingboard Holdings Limited
- Proman
- Celanese Corporation
- Ineos
- Atlantic Methanol
- Ningxia Baofeng Energy Group Co Ltd
- Gujarat State Fertilizers & Chemicals Limited (GSFC)
- ZPCIR
- BASF SE
- SABIC
- Methanex Corporation
- Petroliam Nasional Berhad
- Mitsubishi Gas Chemical Company Inc
- Eni SpA
- Mitsui & Co Ltd
- OCI NV
Notable Milestones in Methanol Industry Sector
- January 2024: Enerkem announced the retirement of its Enerkem Alberta Biofuels (EAB) plant, having successfully achieved its objective of commercial-scale technology demonstration for ethanol and methanol production.
- January 2024: Fairway Methanol, a joint venture between Mitsui & Co. and Celanese Corporation, commenced methanol production utilizing captured carbon dioxide emissions from surrounding plants.
- January 2024: BASF SE and Envision Energy announced a joint development to convert green hydrogen and CO2 into sustainable methanol, with Envision Energy licensing BASF's catalyst technology for larger-scale plants.
- July 2023: A joint venture between Enerkem and Dimeta initiated feasibility studies for two large-scale projects focused on converting waste into renewable and recycled carbon dimethyl ether (DME).
- November 2022: Petronas progressed with the construction of a new methanol facility in Bintulu, Sarawak, Malaysia, set to add 1.75 million tons of production capacity.
- February 2022: Linde expanded its agreement with Celanese Corporation to supply carbon dioxide and hydrogen for methanol production at Celanese's Clear Lake, Texas facility, aiming to reduce its carbon footprint.
In-Depth Methanol Industry Market Outlook
The Methanol Industry is characterized by a dynamic outlook, with sustainable methanol technologies serving as a primary growth accelerator. The increasing global commitment to decarbonization, coupled with favorable government policies and corporate sustainability mandates, is spurring significant investments in renewable and e-methanol production. Strategic partnerships are pivotal in driving innovation and commercialization, particularly in areas like green hydrogen integration and carbon capture. The development of methanol as a clean fuel for shipping and its potential as a hydrogen carrier represent substantial future market opportunities. Furthermore, the expanding applications in Methanol-to-Olefin (MTO) processes, especially in regions with cost-advantaged feedstock, will continue to fuel demand. Overall, the Methanol Industry is on a trajectory of robust growth, driven by environmental imperatives and technological advancements, promising a more sustainable and versatile future for this essential chemical.
Methanol Industry Segmentation
-
1. Application
-
1.1. Traditional Chemical
- 1.1.1. Formaldehyde
- 1.1.2. Acetic Acid
- 1.1.3. Solvent
- 1.1.4. Methylamine
- 1.1.5. Other Traditional Chemicals
-
1.2. Energy Related
- 1.2.1. Methanol-to-olefin (MTO)
- 1.2.2. Methyl Tert-butyl Ether (MTBE)
- 1.2.3. Gasoline Blending
- 1.2.4. Dimethyl Ether (DME)
- 1.2.5. Biodiesel
-
1.1. Traditional Chemical
Methanol Industry Segmentation By Geography
-
1. Asia Pacific
- 1.1. China
- 1.2. India
- 1.3. Japan
- 1.4. South Korea
- 1.5. Southeast Asia
- 1.6. Rest of Asia Pacific
-
2. North America
- 2.1. United States
- 2.2. Canada
- 2.3. Mexico
-
3. Europe
- 3.1. Germany
- 3.2. United Kingdom
- 3.3. Italy
- 3.4. France
- 3.5. Spain
- 3.6. Rest of Europe
-
4. South America
- 4.1. Brazil
- 4.2. Argentina
- 4.3. Colombia
- 4.4. Rest of South America
-
5. Middle East and Africa
- 5.1. Saudi Arabia
- 5.2. South Africa
- 5.3. Nigeria
- 5.4. United Arab Emirates
- 5.5. Rest of Middle East and Africa

Methanol Industry Regional Market Share
Geographic Coverage of Methanol Industry
Methanol Industry REPORT HIGHLIGHTS
| Aspects | Details |
|---|---|
| Study Period | 2020-2034 |
| Base Year | 2025 |
| Estimated Year | 2026 |
| Forecast Period | 2026-2034 |
| Historical Period | 2020-2025 |
| Growth Rate | CAGR of 2.7% from 2020-2034 |
| Segmentation |
|
Table of Contents
- 1. Introduction
- 1.1. Research Scope
- 1.2. Market Segmentation
- 1.3. Research Objective
- 1.4. Definitions and Assumptions
- 2. Executive Summary
- 2.1. Market Snapshot
- 3. Market Dynamics
- 3.1. Market Drivers
- 3.2. Market Restrains
- 3.3. Market Trends
- 3.4. Market Opportunities
- 4. Market Factor Analysis
- 4.1. Porters Five Forces
- 4.1.1. Bargaining Power of Suppliers
- 4.1.2. Bargaining Power of Buyers
- 4.1.3. Threat of New Entrants
- 4.1.4. Threat of Substitutes
- 4.1.5. Competitive Rivalry
- 4.2. PESTEL analysis
- 4.3. BCG Analysis
- 4.3.1. Stars (High Growth, High Market Share)
- 4.3.2. Cash Cows (Low Growth, High Market Share)
- 4.3.3. Question Mark (High Growth, Low Market Share)
- 4.3.4. Dogs (Low Growth, Low Market Share)
- 4.4. Ansoff Matrix Analysis
- 4.5. Supply Chain Analysis
- 4.6. Regulatory Landscape
- 4.7. Current Market Potential and Opportunity Assessment (TAM–SAM–SOM Framework)
- 4.8. IMR Analyst Note
- 4.1. Porters Five Forces
- 5. Market Analysis, Insights and Forecast 2021-2033
- 5.1. Market Analysis, Insights and Forecast - by Application
- 5.1.1. Traditional Chemical
- 5.1.1.1. Formaldehyde
- 5.1.1.2. Acetic Acid
- 5.1.1.3. Solvent
- 5.1.1.4. Methylamine
- 5.1.1.5. Other Traditional Chemicals
- 5.1.2. Energy Related
- 5.1.2.1. Methanol-to-olefin (MTO)
- 5.1.2.2. Methyl Tert-butyl Ether (MTBE)
- 5.1.2.3. Gasoline Blending
- 5.1.2.4. Dimethyl Ether (DME)
- 5.1.2.5. Biodiesel
- 5.1.1. Traditional Chemical
- 5.2. Market Analysis, Insights and Forecast - by Region
- 5.2.1. Asia Pacific
- 5.2.2. North America
- 5.2.3. Europe
- 5.2.4. South America
- 5.2.5. Middle East and Africa
- 5.1. Market Analysis, Insights and Forecast - by Application
- 6. Global Methanol Industry Analysis, Insights and Forecast, 2021-2033
- 6.1. Market Analysis, Insights and Forecast - by Application
- 6.1.1. Traditional Chemical
- 6.1.1.1. Formaldehyde
- 6.1.1.2. Acetic Acid
- 6.1.1.3. Solvent
- 6.1.1.4. Methylamine
- 6.1.1.5. Other Traditional Chemicals
- 6.1.2. Energy Related
- 6.1.2.1. Methanol-to-olefin (MTO)
- 6.1.2.2. Methyl Tert-butyl Ether (MTBE)
- 6.1.2.3. Gasoline Blending
- 6.1.2.4. Dimethyl Ether (DME)
- 6.1.2.5. Biodiesel
- 6.1.1. Traditional Chemical
- 6.1. Market Analysis, Insights and Forecast - by Application
- 7. Asia Pacific Methanol Industry Analysis, Insights and Forecast, 2020-2032
- 7.1. Market Analysis, Insights and Forecast - by Application
- 7.1.1. Traditional Chemical
- 7.1.1.1. Formaldehyde
- 7.1.1.2. Acetic Acid
- 7.1.1.3. Solvent
- 7.1.1.4. Methylamine
- 7.1.1.5. Other Traditional Chemicals
- 7.1.2. Energy Related
- 7.1.2.1. Methanol-to-olefin (MTO)
- 7.1.2.2. Methyl Tert-butyl Ether (MTBE)
- 7.1.2.3. Gasoline Blending
- 7.1.2.4. Dimethyl Ether (DME)
- 7.1.2.5. Biodiesel
- 7.1.1. Traditional Chemical
- 7.1. Market Analysis, Insights and Forecast - by Application
- 8. North America Methanol Industry Analysis, Insights and Forecast, 2020-2032
- 8.1. Market Analysis, Insights and Forecast - by Application
- 8.1.1. Traditional Chemical
- 8.1.1.1. Formaldehyde
- 8.1.1.2. Acetic Acid
- 8.1.1.3. Solvent
- 8.1.1.4. Methylamine
- 8.1.1.5. Other Traditional Chemicals
- 8.1.2. Energy Related
- 8.1.2.1. Methanol-to-olefin (MTO)
- 8.1.2.2. Methyl Tert-butyl Ether (MTBE)
- 8.1.2.3. Gasoline Blending
- 8.1.2.4. Dimethyl Ether (DME)
- 8.1.2.5. Biodiesel
- 8.1.1. Traditional Chemical
- 8.1. Market Analysis, Insights and Forecast - by Application
- 9. Europe Methanol Industry Analysis, Insights and Forecast, 2020-2032
- 9.1. Market Analysis, Insights and Forecast - by Application
- 9.1.1. Traditional Chemical
- 9.1.1.1. Formaldehyde
- 9.1.1.2. Acetic Acid
- 9.1.1.3. Solvent
- 9.1.1.4. Methylamine
- 9.1.1.5. Other Traditional Chemicals
- 9.1.2. Energy Related
- 9.1.2.1. Methanol-to-olefin (MTO)
- 9.1.2.2. Methyl Tert-butyl Ether (MTBE)
- 9.1.2.3. Gasoline Blending
- 9.1.2.4. Dimethyl Ether (DME)
- 9.1.2.5. Biodiesel
- 9.1.1. Traditional Chemical
- 9.1. Market Analysis, Insights and Forecast - by Application
- 10. South America Methanol Industry Analysis, Insights and Forecast, 2020-2032
- 10.1. Market Analysis, Insights and Forecast - by Application
- 10.1.1. Traditional Chemical
- 10.1.1.1. Formaldehyde
- 10.1.1.2. Acetic Acid
- 10.1.1.3. Solvent
- 10.1.1.4. Methylamine
- 10.1.1.5. Other Traditional Chemicals
- 10.1.2. Energy Related
- 10.1.2.1. Methanol-to-olefin (MTO)
- 10.1.2.2. Methyl Tert-butyl Ether (MTBE)
- 10.1.2.3. Gasoline Blending
- 10.1.2.4. Dimethyl Ether (DME)
- 10.1.2.5. Biodiesel
- 10.1.1. Traditional Chemical
- 10.1. Market Analysis, Insights and Forecast - by Application
- 11. Middle East and Africa Methanol Industry Analysis, Insights and Forecast, 2020-2032
- 11.1. Market Analysis, Insights and Forecast - by Application
- 11.1.1. Traditional Chemical
- 11.1.1.1. Formaldehyde
- 11.1.1.2. Acetic Acid
- 11.1.1.3. Solvent
- 11.1.1.4. Methylamine
- 11.1.1.5. Other Traditional Chemicals
- 11.1.2. Energy Related
- 11.1.2.1. Methanol-to-olefin (MTO)
- 11.1.2.2. Methyl Tert-butyl Ether (MTBE)
- 11.1.2.3. Gasoline Blending
- 11.1.2.4. Dimethyl Ether (DME)
- 11.1.2.5. Biodiesel
- 11.1.1. Traditional Chemical
- 11.1. Market Analysis, Insights and Forecast - by Application
- 12. Competitive Analysis
- 12.1. Company Profiles
- 12.1.1 Lyondellbasell Industries Holdings BV
- 12.1.1.1. Company Overview
- 12.1.1.2. Products
- 12.1.1.3. Company Financials
- 12.1.1.4. SWOT Analysis
- 12.1.2 Enerkem
- 12.1.2.1. Company Overview
- 12.1.2.2. Products
- 12.1.2.3. Company Financials
- 12.1.2.4. SWOT Analysis
- 12.1.3 Coogee
- 12.1.3.1. Company Overview
- 12.1.3.2. Products
- 12.1.3.3. Company Financials
- 12.1.3.4. SWOT Analysis
- 12.1.4 Kingboard Holdings Limited
- 12.1.4.1. Company Overview
- 12.1.4.2. Products
- 12.1.4.3. Company Financials
- 12.1.4.4. SWOT Analysis
- 12.1.5 Proman
- 12.1.5.1. Company Overview
- 12.1.5.2. Products
- 12.1.5.3. Company Financials
- 12.1.5.4. SWOT Analysis
- 12.1.6 Celanese Corporation
- 12.1.6.1. Company Overview
- 12.1.6.2. Products
- 12.1.6.3. Company Financials
- 12.1.6.4. SWOT Analysis
- 12.1.7 Ineos
- 12.1.7.1. Company Overview
- 12.1.7.2. Products
- 12.1.7.3. Company Financials
- 12.1.7.4. SWOT Analysis
- 12.1.8 Atlantic Methanol
- 12.1.8.1. Company Overview
- 12.1.8.2. Products
- 12.1.8.3. Company Financials
- 12.1.8.4. SWOT Analysis
- 12.1.9 Ningxia Baofeng Energy Group Co Ltd
- 12.1.9.1. Company Overview
- 12.1.9.2. Products
- 12.1.9.3. Company Financials
- 12.1.9.4. SWOT Analysis
- 12.1.10 Gujarat State Fertilizers & Chemicals Limited (GSFC)
- 12.1.10.1. Company Overview
- 12.1.10.2. Products
- 12.1.10.3. Company Financials
- 12.1.10.4. SWOT Analysis
- 12.1.11 ZPCIR
- 12.1.11.1. Company Overview
- 12.1.11.2. Products
- 12.1.11.3. Company Financials
- 12.1.11.4. SWOT Analysis
- 12.1.12 BASF SE
- 12.1.12.1. Company Overview
- 12.1.12.2. Products
- 12.1.12.3. Company Financials
- 12.1.12.4. SWOT Analysis
- 12.1.13 SABIC
- 12.1.13.1. Company Overview
- 12.1.13.2. Products
- 12.1.13.3. Company Financials
- 12.1.13.4. SWOT Analysis
- 12.1.14 Methanex Corporation
- 12.1.14.1. Company Overview
- 12.1.14.2. Products
- 12.1.14.3. Company Financials
- 12.1.14.4. SWOT Analysis
- 12.1.15 Petroliam Nasional Berhad
- 12.1.15.1. Company Overview
- 12.1.15.2. Products
- 12.1.15.3. Company Financials
- 12.1.15.4. SWOT Analysis
- 12.1.16 Mitsubishi Gas Chemical Company Inc
- 12.1.16.1. Company Overview
- 12.1.16.2. Products
- 12.1.16.3. Company Financials
- 12.1.16.4. SWOT Analysis
- 12.1.17 Eni SpA
- 12.1.17.1. Company Overview
- 12.1.17.2. Products
- 12.1.17.3. Company Financials
- 12.1.17.4. SWOT Analysis
- 12.1.18 Mitsui & Co Ltd
- 12.1.18.1. Company Overview
- 12.1.18.2. Products
- 12.1.18.3. Company Financials
- 12.1.18.4. SWOT Analysis
- 12.1.19 OCI NV
- 12.1.19.1. Company Overview
- 12.1.19.2. Products
- 12.1.19.3. Company Financials
- 12.1.19.4. SWOT Analysis
- 12.1.1 Lyondellbasell Industries Holdings BV
- 12.2. Market Entropy
- 12.2.1 Company's Key Areas Served
- 12.2.2 Recent Developments
- 12.3. Company Market Share Analysis 2025
- 12.3.1 Top 5 Companies Market Share Analysis
- 12.3.2 Top 3 Companies Market Share Analysis
- 12.4. List of Potential Customers
- 13. Research Methodology
List of Figures
- Figure 1: Global Methanol Industry Revenue Breakdown (billion, %) by Region 2025 & 2033
- Figure 2: Global Methanol Industry Volume Breakdown (K Tons, %) by Region 2025 & 2033
- Figure 3: Asia Pacific Methanol Industry Revenue (billion), by Application 2025 & 2033
- Figure 4: Asia Pacific Methanol Industry Volume (K Tons), by Application 2025 & 2033
- Figure 5: Asia Pacific Methanol Industry Revenue Share (%), by Application 2025 & 2033
- Figure 6: Asia Pacific Methanol Industry Volume Share (%), by Application 2025 & 2033
- Figure 7: Asia Pacific Methanol Industry Revenue (billion), by Country 2025 & 2033
- Figure 8: Asia Pacific Methanol Industry Volume (K Tons), by Country 2025 & 2033
- Figure 9: Asia Pacific Methanol Industry Revenue Share (%), by Country 2025 & 2033
- Figure 10: Asia Pacific Methanol Industry Volume Share (%), by Country 2025 & 2033
- Figure 11: North America Methanol Industry Revenue (billion), by Application 2025 & 2033
- Figure 12: North America Methanol Industry Volume (K Tons), by Application 2025 & 2033
- Figure 13: North America Methanol Industry Revenue Share (%), by Application 2025 & 2033
- Figure 14: North America Methanol Industry Volume Share (%), by Application 2025 & 2033
- Figure 15: North America Methanol Industry Revenue (billion), by Country 2025 & 2033
- Figure 16: North America Methanol Industry Volume (K Tons), by Country 2025 & 2033
- Figure 17: North America Methanol Industry Revenue Share (%), by Country 2025 & 2033
- Figure 18: North America Methanol Industry Volume Share (%), by Country 2025 & 2033
- Figure 19: Europe Methanol Industry Revenue (billion), by Application 2025 & 2033
- Figure 20: Europe Methanol Industry Volume (K Tons), by Application 2025 & 2033
- Figure 21: Europe Methanol Industry Revenue Share (%), by Application 2025 & 2033
- Figure 22: Europe Methanol Industry Volume Share (%), by Application 2025 & 2033
- Figure 23: Europe Methanol Industry Revenue (billion), by Country 2025 & 2033
- Figure 24: Europe Methanol Industry Volume (K Tons), by Country 2025 & 2033
- Figure 25: Europe Methanol Industry Revenue Share (%), by Country 2025 & 2033
- Figure 26: Europe Methanol Industry Volume Share (%), by Country 2025 & 2033
- Figure 27: South America Methanol Industry Revenue (billion), by Application 2025 & 2033
- Figure 28: South America Methanol Industry Volume (K Tons), by Application 2025 & 2033
- Figure 29: South America Methanol Industry Revenue Share (%), by Application 2025 & 2033
- Figure 30: South America Methanol Industry Volume Share (%), by Application 2025 & 2033
- Figure 31: South America Methanol Industry Revenue (billion), by Country 2025 & 2033
- Figure 32: South America Methanol Industry Volume (K Tons), by Country 2025 & 2033
- Figure 33: South America Methanol Industry Revenue Share (%), by Country 2025 & 2033
- Figure 34: South America Methanol Industry Volume Share (%), by Country 2025 & 2033
- Figure 35: Middle East and Africa Methanol Industry Revenue (billion), by Application 2025 & 2033
- Figure 36: Middle East and Africa Methanol Industry Volume (K Tons), by Application 2025 & 2033
- Figure 37: Middle East and Africa Methanol Industry Revenue Share (%), by Application 2025 & 2033
- Figure 38: Middle East and Africa Methanol Industry Volume Share (%), by Application 2025 & 2033
- Figure 39: Middle East and Africa Methanol Industry Revenue (billion), by Country 2025 & 2033
- Figure 40: Middle East and Africa Methanol Industry Volume (K Tons), by Country 2025 & 2033
- Figure 41: Middle East and Africa Methanol Industry Revenue Share (%), by Country 2025 & 2033
- Figure 42: Middle East and Africa Methanol Industry Volume Share (%), by Country 2025 & 2033
List of Tables
- Table 1: Global Methanol Industry Revenue billion Forecast, by Application 2020 & 2033
- Table 2: Global Methanol Industry Volume K Tons Forecast, by Application 2020 & 2033
- Table 3: Global Methanol Industry Revenue billion Forecast, by Region 2020 & 2033
- Table 4: Global Methanol Industry Volume K Tons Forecast, by Region 2020 & 2033
- Table 5: Global Methanol Industry Revenue billion Forecast, by Application 2020 & 2033
- Table 6: Global Methanol Industry Volume K Tons Forecast, by Application 2020 & 2033
- Table 7: Global Methanol Industry Revenue billion Forecast, by Country 2020 & 2033
- Table 8: Global Methanol Industry Volume K Tons Forecast, by Country 2020 & 2033
- Table 9: China Methanol Industry Revenue (billion) Forecast, by Application 2020 & 2033
- Table 10: China Methanol Industry Volume (K Tons) Forecast, by Application 2020 & 2033
- Table 11: India Methanol Industry Revenue (billion) Forecast, by Application 2020 & 2033
- Table 12: India Methanol Industry Volume (K Tons) Forecast, by Application 2020 & 2033
- Table 13: Japan Methanol Industry Revenue (billion) Forecast, by Application 2020 & 2033
- Table 14: Japan Methanol Industry Volume (K Tons) Forecast, by Application 2020 & 2033
- Table 15: South Korea Methanol Industry Revenue (billion) Forecast, by Application 2020 & 2033
- Table 16: South Korea Methanol Industry Volume (K Tons) Forecast, by Application 2020 & 2033
- Table 17: Southeast Asia Methanol Industry Revenue (billion) Forecast, by Application 2020 & 2033
- Table 18: Southeast Asia Methanol Industry Volume (K Tons) Forecast, by Application 2020 & 2033
- Table 19: Rest of Asia Pacific Methanol Industry Revenue (billion) Forecast, by Application 2020 & 2033
- Table 20: Rest of Asia Pacific Methanol Industry Volume (K Tons) Forecast, by Application 2020 & 2033
- Table 21: Global Methanol Industry Revenue billion Forecast, by Application 2020 & 2033
- Table 22: Global Methanol Industry Volume K Tons Forecast, by Application 2020 & 2033
- Table 23: Global Methanol Industry Revenue billion Forecast, by Country 2020 & 2033
- Table 24: Global Methanol Industry Volume K Tons Forecast, by Country 2020 & 2033
- Table 25: United States Methanol Industry Revenue (billion) Forecast, by Application 2020 & 2033
- Table 26: United States Methanol Industry Volume (K Tons) Forecast, by Application 2020 & 2033
- Table 27: Canada Methanol Industry Revenue (billion) Forecast, by Application 2020 & 2033
- Table 28: Canada Methanol Industry Volume (K Tons) Forecast, by Application 2020 & 2033
- Table 29: Mexico Methanol Industry Revenue (billion) Forecast, by Application 2020 & 2033
- Table 30: Mexico Methanol Industry Volume (K Tons) Forecast, by Application 2020 & 2033
- Table 31: Global Methanol Industry Revenue billion Forecast, by Application 2020 & 2033
- Table 32: Global Methanol Industry Volume K Tons Forecast, by Application 2020 & 2033
- Table 33: Global Methanol Industry Revenue billion Forecast, by Country 2020 & 2033
- Table 34: Global Methanol Industry Volume K Tons Forecast, by Country 2020 & 2033
- Table 35: Germany Methanol Industry Revenue (billion) Forecast, by Application 2020 & 2033
- Table 36: Germany Methanol Industry Volume (K Tons) Forecast, by Application 2020 & 2033
- Table 37: United Kingdom Methanol Industry Revenue (billion) Forecast, by Application 2020 & 2033
- Table 38: United Kingdom Methanol Industry Volume (K Tons) Forecast, by Application 2020 & 2033
- Table 39: Italy Methanol Industry Revenue (billion) Forecast, by Application 2020 & 2033
- Table 40: Italy Methanol Industry Volume (K Tons) Forecast, by Application 2020 & 2033
- Table 41: France Methanol Industry Revenue (billion) Forecast, by Application 2020 & 2033
- Table 42: France Methanol Industry Volume (K Tons) Forecast, by Application 2020 & 2033
- Table 43: Spain Methanol Industry Revenue (billion) Forecast, by Application 2020 & 2033
- Table 44: Spain Methanol Industry Volume (K Tons) Forecast, by Application 2020 & 2033
- Table 45: Rest of Europe Methanol Industry Revenue (billion) Forecast, by Application 2020 & 2033
- Table 46: Rest of Europe Methanol Industry Volume (K Tons) Forecast, by Application 2020 & 2033
- Table 47: Global Methanol Industry Revenue billion Forecast, by Application 2020 & 2033
- Table 48: Global Methanol Industry Volume K Tons Forecast, by Application 2020 & 2033
- Table 49: Global Methanol Industry Revenue billion Forecast, by Country 2020 & 2033
- Table 50: Global Methanol Industry Volume K Tons Forecast, by Country 2020 & 2033
- Table 51: Brazil Methanol Industry Revenue (billion) Forecast, by Application 2020 & 2033
- Table 52: Brazil Methanol Industry Volume (K Tons) Forecast, by Application 2020 & 2033
- Table 53: Argentina Methanol Industry Revenue (billion) Forecast, by Application 2020 & 2033
- Table 54: Argentina Methanol Industry Volume (K Tons) Forecast, by Application 2020 & 2033
- Table 55: Colombia Methanol Industry Revenue (billion) Forecast, by Application 2020 & 2033
- Table 56: Colombia Methanol Industry Volume (K Tons) Forecast, by Application 2020 & 2033
- Table 57: Rest of South America Methanol Industry Revenue (billion) Forecast, by Application 2020 & 2033
- Table 58: Rest of South America Methanol Industry Volume (K Tons) Forecast, by Application 2020 & 2033
- Table 59: Global Methanol Industry Revenue billion Forecast, by Application 2020 & 2033
- Table 60: Global Methanol Industry Volume K Tons Forecast, by Application 2020 & 2033
- Table 61: Global Methanol Industry Revenue billion Forecast, by Country 2020 & 2033
- Table 62: Global Methanol Industry Volume K Tons Forecast, by Country 2020 & 2033
- Table 63: Saudi Arabia Methanol Industry Revenue (billion) Forecast, by Application 2020 & 2033
- Table 64: Saudi Arabia Methanol Industry Volume (K Tons) Forecast, by Application 2020 & 2033
- Table 65: South Africa Methanol Industry Revenue (billion) Forecast, by Application 2020 & 2033
- Table 66: South Africa Methanol Industry Volume (K Tons) Forecast, by Application 2020 & 2033
- Table 67: Nigeria Methanol Industry Revenue (billion) Forecast, by Application 2020 & 2033
- Table 68: Nigeria Methanol Industry Volume (K Tons) Forecast, by Application 2020 & 2033
- Table 69: United Arab Emirates Methanol Industry Revenue (billion) Forecast, by Application 2020 & 2033
- Table 70: United Arab Emirates Methanol Industry Volume (K Tons) Forecast, by Application 2020 & 2033
- Table 71: Rest of Middle East and Africa Methanol Industry Revenue (billion) Forecast, by Application 2020 & 2033
- Table 72: Rest of Middle East and Africa Methanol Industry Volume (K Tons) Forecast, by Application 2020 & 2033
Frequently Asked Questions
1. What is the projected Compound Annual Growth Rate (CAGR) of the Methanol Industry?
The projected CAGR is approximately 2.7%.
2. Which companies are prominent players in the Methanol Industry?
Key companies in the market include Lyondellbasell Industries Holdings BV, Enerkem, Coogee, Kingboard Holdings Limited, Proman, Celanese Corporation, Ineos, Atlantic Methanol, Ningxia Baofeng Energy Group Co Ltd, Gujarat State Fertilizers & Chemicals Limited (GSFC), ZPCIR, BASF SE, SABIC, Methanex Corporation, Petroliam Nasional Berhad, Mitsubishi Gas Chemical Company Inc, Eni SpA, Mitsui & Co Ltd, OCI NV.
3. What are the main segments of the Methanol Industry?
The market segments include Application.
4. Can you provide details about the market size?
The market size is estimated to be USD 38.74 billion as of 2022.
5. What are some drivers contributing to market growth?
Expanding Petrochemical Sector in China. United States. and Other Asia-Pacific Countries; Rising Demand for Methanol-based Fuel; Increasing Utilization of Methanol in the Production of Olefins.
6. What are the notable trends driving market growth?
Energy-related Applications to Dominate the Market.
7. Are there any restraints impacting market growth?
Usage of Ethanol Fuel or Bioethanol in Comparison to Methanol; Hazardous Impacts on Health.
8. Can you provide examples of recent developments in the market?
January 2024: Enerkem announced that it will be retiring its Enerkem Alberta Biofuels (EAB) plant in Edmonton. The facility achieved its main objective of completing the commercial scale-up of Enerkem’s industry-leading technology with more than 15,000 hours of operation producing ethanol and methanol.
9. What pricing options are available for accessing the report?
Pricing options include single-user, multi-user, and enterprise licenses priced at USD 4750, USD 5250, and USD 8750 respectively.
10. Is the market size provided in terms of value or volume?
The market size is provided in terms of value, measured in billion and volume, measured in K Tons.
11. Are there any specific market keywords associated with the report?
Yes, the market keyword associated with the report is "Methanol Industry," which aids in identifying and referencing the specific market segment covered.
12. How do I determine which pricing option suits my needs best?
The pricing options vary based on user requirements and access needs. Individual users may opt for single-user licenses, while businesses requiring broader access may choose multi-user or enterprise licenses for cost-effective access to the report.
13. Are there any additional resources or data provided in the Methanol Industry report?
While the report offers comprehensive insights, it's advisable to review the specific contents or supplementary materials provided to ascertain if additional resources or data are available.
14. How can I stay updated on further developments or reports in the Methanol Industry?
To stay informed about further developments, trends, and reports in the Methanol Industry, consider subscribing to industry newsletters, following relevant companies and organizations, or regularly checking reputable industry news sources and publications.
Methodology
Step 1 - Identification of Relevant Samples Size from Population Database


Step 2 - Approaches for Defining Global Market Size (Value, Volume* & Price*)

Note*: In applicable scenarios
Step 3 - Data Sources
Primary Research
- Web Analytics
- Survey Reports
- Research Institute
- Latest Research Reports
- Opinion Leaders
Secondary Research
- Annual Reports
- White Paper
- Latest Press Release
- Industry Association
- Paid Database
- Investor Presentations

Step 4 - Data Triangulation
Involves using different sources of information in order to increase the validity of a study
These sources are likely to be stakeholders in a program - participants, other researchers, program staff, other community members, and so on.
Then we put all data in single framework & apply various statistical tools to find out the dynamic on the market.
During the analysis stage, feedback from the stakeholder groups would be compared to determine areas of agreement as well as areas of divergence