

Key Insights
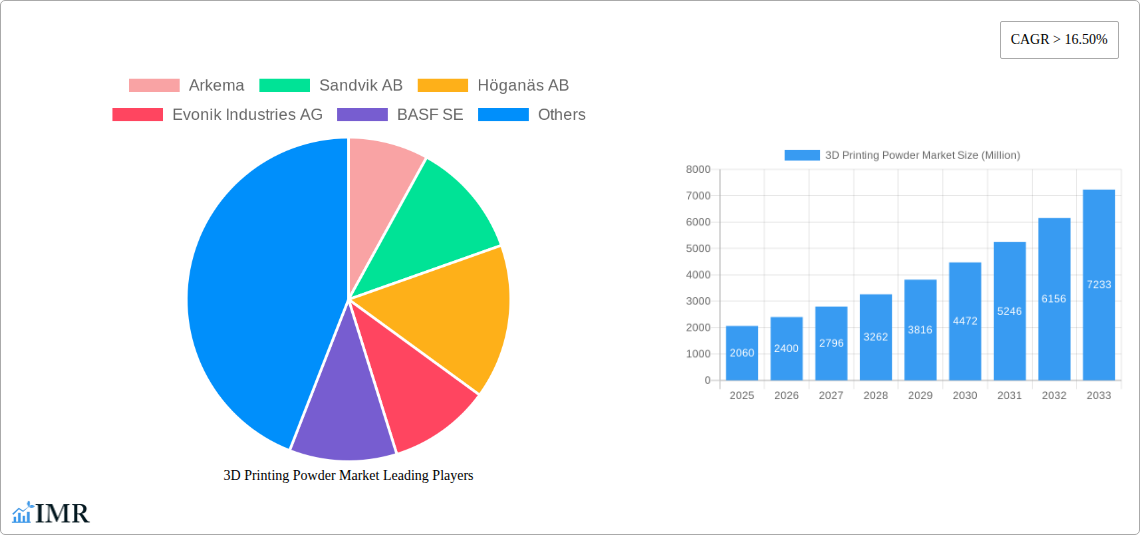
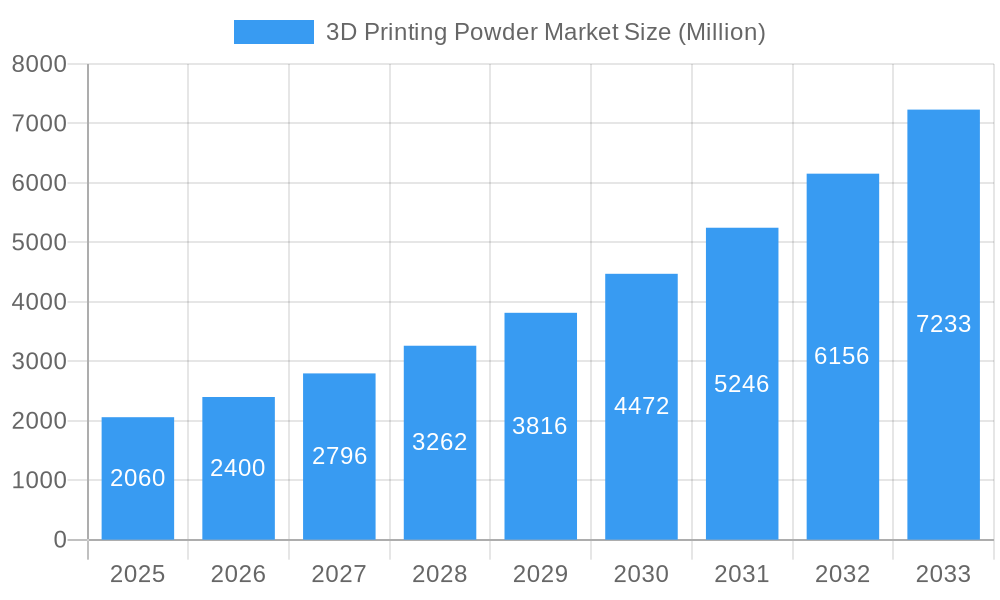
The 3D printing powder market, valued at $2.06 billion in 2025, is experiencing robust growth, projected to expand at a compound annual growth rate (CAGR) exceeding 16.5% from 2025 to 2033. This surge is fueled by several key factors. The increasing adoption of additive manufacturing across diverse sectors, including automotive, aerospace, medical, and architecture, is a primary driver. The demand for lightweight, high-strength components, precisely tailored for specific applications, is pushing the boundaries of traditional manufacturing methods, making 3D printing an increasingly attractive alternative. Furthermore, ongoing advancements in powder technology, leading to improved material properties and printing processes, are contributing to market expansion. Specific material innovations, such as the development of biocompatible powders for medical implants and high-temperature resistant powders for aerospace applications, are significantly shaping market growth. The competitive landscape features both established chemical giants like Arkema, BASF, and Evonik, alongside specialized powder metallurgy companies such as Sandvik and Höganäs. This competition fosters innovation and drives down costs, further propelling market expansion.
3D Printing Powder Market Market Size (In Billion)
However, certain challenges persist. The relatively high cost of 3D printing powder compared to traditional materials, along with concerns regarding powder handling and safety, represent significant restraints. Despite these limitations, the long-term outlook remains positive, driven by continuous technological advancements, decreasing production costs, and the ever-growing need for customized, high-performance components across a wide range of applications. The market segmentation reveals strong demand across various powder types, with metal powders leading the way due to their extensive use in high-value applications. Geographically, North America and Europe currently hold significant market shares, but the Asia-Pacific region, particularly China and India, is poised for rapid growth due to increasing industrialization and investment in advanced manufacturing technologies. The forecast period of 2025-2033 promises substantial market expansion, driven by both technological advancements and the expanding applications of 3D printing across numerous industries.
3D Printing Powder Market Company Market Share
3D Printing Powder Market: A Comprehensive Report (2019-2033)
This in-depth report provides a comprehensive analysis of the 3D printing powder market, encompassing market dynamics, growth trends, regional segmentation, product landscape, key players, and future outlook. The study period covers 2019-2033, with 2025 as the base and estimated year. This report is invaluable for industry professionals, investors, and researchers seeking a detailed understanding of this rapidly evolving market. The report segments the market by powder type (Plastic Powder, Metal Powder, Ceramic Powder, Glass Powder, Other Types), end-user industry (Automotive, Aerospace and Defense, Medical, Architecture, Other End-user Industries), and key geographic regions. The total market size is projected to reach xx Million by 2033.
3D Printing Powder Market Market Dynamics & Structure
This section analyzes the competitive landscape, technological advancements, and regulatory influences shaping the 3D printing powder market. We examine market concentration, identifying key players and their market share, alongside M&A activities within the industry. The report also delves into the impact of technological innovation, exploring both drivers and barriers to adoption. Furthermore, we assess the regulatory framework and its implications, including the presence of substitute products and their competitive impact.
- Market Concentration: The market exhibits a moderately concentrated structure, with key players holding approximately xx% of the market share in 2025. This is expected to slightly decrease to xx% by 2033 due to the entry of new players and increased competition.
- Technological Innovation: Advancements in powder synthesis techniques and material science are driving market growth. However, high R&D costs and the complexity of material characterization present significant barriers to innovation.
- Regulatory Framework: Stringent safety and environmental regulations related to powder handling and disposal are influencing market dynamics, necessitating compliance investments by manufacturers.
- Competitive Product Substitutes: Traditional manufacturing methods remain competitive, particularly for large-scale production runs. However, 3D printing offers advantages in terms of customization and design flexibility.
- M&A Trends: The number of M&A deals in the 3D printing powder market increased from xx in 2019 to xx in 2024, indicating consolidation and strategic expansion by major players.
- End-user Demographics: The automotive and aerospace industries are the primary end-users, accounting for approximately xx% and xx% of the market, respectively, in 2025. However, growth in the medical and consumer goods sectors is expected to increase their respective market share in the forecast period.
3D Printing Powder Market Growth Trends & Insights
This section provides a detailed analysis of the 3D printing powder market's growth trajectory, leveraging data and insights to project market size and adoption rates. We explore technological disruptions, their impact on market dynamics, and shifts in consumer behavior driving market evolution. The analysis covers market size evolution, identifying growth spurts and periods of stagnation, alongside an examination of adoption rates across various end-user industries.
The market exhibited a CAGR of xx% during the historical period (2019-2024) and is projected to grow at a CAGR of xx% during the forecast period (2025-2033). Market penetration is expected to increase significantly, driven by factors such as the rising adoption of additive manufacturing across diverse sectors, falling material costs, and technological innovations. The increased demand for customized products and rapid prototyping capabilities further fuels market growth. Technological disruptions, such as the development of new powder materials with enhanced properties and the introduction of high-speed 3D printing systems, are playing a key role in driving the market. Consumer preference for personalized and on-demand products is also contributing to the growing adoption of 3D printing technologies.
Dominant Regions, Countries, or Segments in 3D Printing Powder Market
This section identifies the leading regions, countries, and segments driving market growth. The analysis delves into the factors contributing to their dominance, considering market share, growth potential, and specific economic and infrastructure-related drivers.
- Leading Region: North America is projected to dominate the market in 2025, holding xx% market share, followed by Europe and Asia-Pacific. This dominance is attributed to the high adoption rate of additive manufacturing technologies within the region’s automotive, aerospace, and medical sectors. High investment in R&D, a robust infrastructure, and supportive government policies are further key drivers.
- Leading Segment (Powder Type): Metal powder is expected to hold the largest segment share in 2025 at xx%, followed by Plastic Powder. The demand for metal powder is driven by its application in various high-value industries, such as aerospace and medical, where high strength and durability are crucial.
- Leading Segment (End-user Industry): The automotive industry currently dominates the end-user segment, accounting for nearly xx% of the total market in 2025. This is mainly due to the increasing need for lightweight and high-performance components in the automotive sector.
3D Printing Powder Market Product Landscape
The 3D printing powder market offers a diverse range of products catering to specific application requirements. These powders vary in material composition, particle size, and flow characteristics, influencing printability and the resulting part properties. Recent product innovations include metal powders with improved surface finish, high-performance plastic powders with enhanced durability, and biocompatible ceramic powders for medical applications. These advancements continuously expand the capabilities and application scope of 3D printing technologies. Furthermore, ongoing research focuses on developing powders with improved strength, reduced porosity, and enhanced functional properties.
Key Drivers, Barriers & Challenges in 3D Printing Powder Market
Key Drivers:
- Technological Advancements: Continuous improvement in powder synthesis techniques, leading to higher quality and performance materials.
- Rising Demand for Customization: 3D printing enables the production of highly customized components, catering to specific needs.
- Growing Adoption in Diverse Industries: 3D printing adoption extends across various sectors, including automotive, aerospace, and healthcare.
Challenges and Restraints:
- High Material Costs: The cost of 3D printing powders remains a significant barrier to broader adoption.
- Supply Chain Disruptions: Geopolitical events and unforeseen circumstances can disrupt the supply chain, affecting powder availability.
- Limited Material Selection: The range of available 3D printing powders is still limited compared to traditional manufacturing materials.
Emerging Opportunities in 3D Printing Powder Market
Emerging opportunities include expansion into new markets (e.g., construction, energy), development of new materials (e.g., biodegradable plastics, high-temperature alloys), and exploration of innovative applications (e.g., personalized medicine, bespoke jewelry). The focus on sustainability is also creating new opportunities for eco-friendly powder materials and closed-loop recycling systems.
Growth Accelerators in the 3D Printing Powder Market Industry
Long-term growth is fueled by ongoing technological advancements in powder synthesis, the development of high-performance materials, and strategic partnerships between powder manufacturers and 3D printer producers. Furthermore, increased investment in research and development, along with expansion into new geographic markets, will further contribute to market growth.
Key Players Shaping the 3D Printing Powder Market Market
- Arkema
- Sandvik AB
- Höganäs AB
- Evonik Industries AG
- BASF SE
- Metalysis
- ERASTEEL
- GKN Powder Metallurgy
- ExOne
Notable Milestones in 3D Printing Powder Market Sector
- 2020: Arkema launched a new range of high-performance plastic powders for 3D printing.
- 2022: Sandvik AB invested significantly in expanding its metal powder production capacity.
- 2023: A major merger between two key players in the metal powder segment reshaped the competitive landscape. (Further details on the specific merger would need to be added here, depending on the actual occurrence.)
- 2024: Several new entrants launched innovative powder materials targeting niche applications.
In-Depth 3D Printing Powder Market Market Outlook
The 3D printing powder market is poised for substantial growth in the coming years, driven by ongoing technological advancements, increasing adoption across diverse industries, and the rise of customized manufacturing. Strategic partnerships, expansion into new markets, and a focus on sustainable solutions will further shape market dynamics. The market offers significant opportunities for both established players and new entrants, providing ample potential for innovation and growth.
3D Printing Powder Market Segmentation
-
1. Powder Type
- 1.1. Plastic Powder
- 1.2. Metal Powder
- 1.3. Ceramic Powder
- 1.4. Glass Powder
- 1.5. Other Types (Composite Powder, etc.)
-
2. End-user Industry
- 2.1. Automotive
- 2.2. Aerospace and Defense
- 2.3. Medical
- 2.4. Architecture
- 2.5. Other En
3D Printing Powder Market Segmentation By Geography
-
1. Asia Pacific
- 1.1. China
- 1.2. India
- 1.3. Japan
- 1.4. South Korea
- 1.5. Rest of Asia Pacific
-
2. North America
- 2.1. United States
- 2.2. Canada
- 2.3. Mexico
-
3. Europe
- 3.1. Germany
- 3.2. United Kingdom
- 3.3. France
- 3.4. Italy
- 3.5. Rest of Europe
-
4. South America
- 4.1. Brazil
- 4.2. Argentina
- 4.3. Rest of South America
-
5. Middle East and Africa
- 5.1. Saudi Arabia
- 5.2. South Africa
- 5.3. Rest of Middle East and Africa
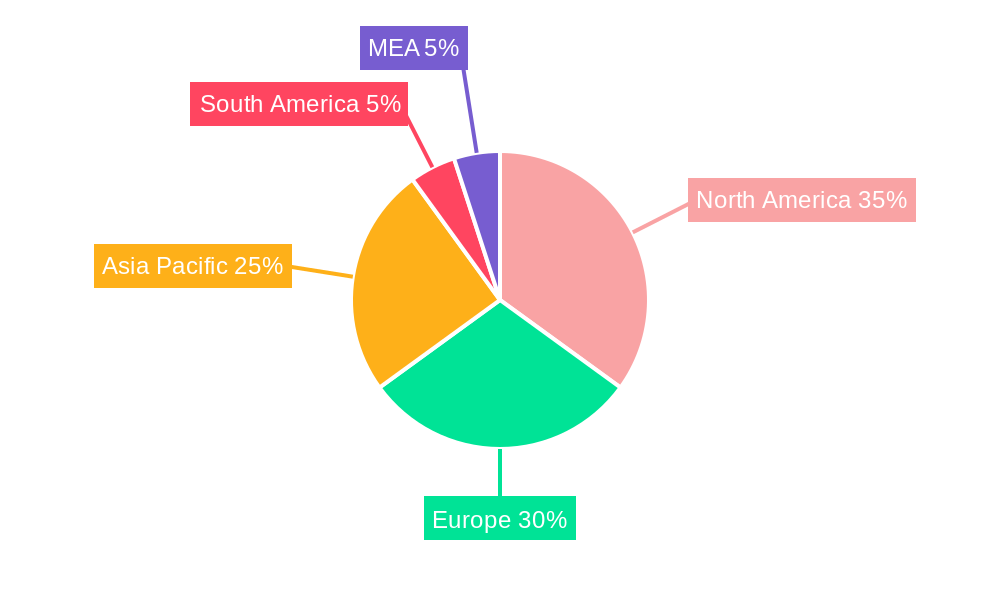
3D Printing Powder Market Regional Market Share
Geographic Coverage of 3D Printing Powder Market
3D Printing Powder Market REPORT HIGHLIGHTS
| Aspects | Details |
|---|---|
| Study Period | 2020-2034 |
| Base Year | 2025 |
| Estimated Year | 2026 |
| Forecast Period | 2026-2034 |
| Historical Period | 2020-2025 |
| Growth Rate | CAGR of > 16.50% from 2020-2034 |
| Segmentation |
|
Table of Contents
- 1. Introduction
- 1.1. Research Scope
- 1.2. Market Segmentation
- 1.3. Research Objective
- 1.4. Definitions and Assumptions
- 2. Executive Summary
- 2.1. Market Snapshot
- 3. Market Dynamics
- 3.1. Market Drivers
- 3.2. Market Restrains
- 3.3. Market Trends
- 3.4. Market Opportunities
- 4. Market Factor Analysis
- 4.1. Porters Five Forces
- 4.1.1. Bargaining Power of Suppliers
- 4.1.2. Bargaining Power of Buyers
- 4.1.3. Threat of New Entrants
- 4.1.4. Threat of Substitutes
- 4.1.5. Competitive Rivalry
- 4.2. PESTEL analysis
- 4.3. BCG Analysis
- 4.3.1. Stars (High Growth, High Market Share)
- 4.3.2. Cash Cows (Low Growth, High Market Share)
- 4.3.3. Question Mark (High Growth, Low Market Share)
- 4.3.4. Dogs (Low Growth, Low Market Share)
- 4.4. Ansoff Matrix Analysis
- 4.5. Supply Chain Analysis
- 4.6. Regulatory Landscape
- 4.7. Current Market Potential and Opportunity Assessment (TAM–SAM–SOM Framework)
- 4.8. IMR Analyst Note
- 4.1. Porters Five Forces
- 5. Market Analysis, Insights and Forecast 2021-2033
- 5.1. Market Analysis, Insights and Forecast - by Powder Type
- 5.1.1. Plastic Powder
- 5.1.2. Metal Powder
- 5.1.3. Ceramic Powder
- 5.1.4. Glass Powder
- 5.1.5. Other Types (Composite Powder, etc.)
- 5.2. Market Analysis, Insights and Forecast - by End-user Industry
- 5.2.1. Automotive
- 5.2.2. Aerospace and Defense
- 5.2.3. Medical
- 5.2.4. Architecture
- 5.2.5. Other En
- 5.3. Market Analysis, Insights and Forecast - by Region
- 5.3.1. Asia Pacific
- 5.3.2. North America
- 5.3.3. Europe
- 5.3.4. South America
- 5.3.5. Middle East and Africa
- 5.1. Market Analysis, Insights and Forecast - by Powder Type
- 6. Global 3D Printing Powder Market Analysis, Insights and Forecast, 2021-2033
- 6.1. Market Analysis, Insights and Forecast - by Powder Type
- 6.1.1. Plastic Powder
- 6.1.2. Metal Powder
- 6.1.3. Ceramic Powder
- 6.1.4. Glass Powder
- 6.1.5. Other Types (Composite Powder, etc.)
- 6.2. Market Analysis, Insights and Forecast - by End-user Industry
- 6.2.1. Automotive
- 6.2.2. Aerospace and Defense
- 6.2.3. Medical
- 6.2.4. Architecture
- 6.2.5. Other En
- 6.1. Market Analysis, Insights and Forecast - by Powder Type
- 7. Asia Pacific 3D Printing Powder Market Analysis, Insights and Forecast, 2020-2032
- 7.1. Market Analysis, Insights and Forecast - by Powder Type
- 7.1.1. Plastic Powder
- 7.1.2. Metal Powder
- 7.1.3. Ceramic Powder
- 7.1.4. Glass Powder
- 7.1.5. Other Types (Composite Powder, etc.)
- 7.2. Market Analysis, Insights and Forecast - by End-user Industry
- 7.2.1. Automotive
- 7.2.2. Aerospace and Defense
- 7.2.3. Medical
- 7.2.4. Architecture
- 7.2.5. Other En
- 7.1. Market Analysis, Insights and Forecast - by Powder Type
- 8. North America 3D Printing Powder Market Analysis, Insights and Forecast, 2020-2032
- 8.1. Market Analysis, Insights and Forecast - by Powder Type
- 8.1.1. Plastic Powder
- 8.1.2. Metal Powder
- 8.1.3. Ceramic Powder
- 8.1.4. Glass Powder
- 8.1.5. Other Types (Composite Powder, etc.)
- 8.2. Market Analysis, Insights and Forecast - by End-user Industry
- 8.2.1. Automotive
- 8.2.2. Aerospace and Defense
- 8.2.3. Medical
- 8.2.4. Architecture
- 8.2.5. Other En
- 8.1. Market Analysis, Insights and Forecast - by Powder Type
- 9. Europe 3D Printing Powder Market Analysis, Insights and Forecast, 2020-2032
- 9.1. Market Analysis, Insights and Forecast - by Powder Type
- 9.1.1. Plastic Powder
- 9.1.2. Metal Powder
- 9.1.3. Ceramic Powder
- 9.1.4. Glass Powder
- 9.1.5. Other Types (Composite Powder, etc.)
- 9.2. Market Analysis, Insights and Forecast - by End-user Industry
- 9.2.1. Automotive
- 9.2.2. Aerospace and Defense
- 9.2.3. Medical
- 9.2.4. Architecture
- 9.2.5. Other En
- 9.1. Market Analysis, Insights and Forecast - by Powder Type
- 10. South America 3D Printing Powder Market Analysis, Insights and Forecast, 2020-2032
- 10.1. Market Analysis, Insights and Forecast - by Powder Type
- 10.1.1. Plastic Powder
- 10.1.2. Metal Powder
- 10.1.3. Ceramic Powder
- 10.1.4. Glass Powder
- 10.1.5. Other Types (Composite Powder, etc.)
- 10.2. Market Analysis, Insights and Forecast - by End-user Industry
- 10.2.1. Automotive
- 10.2.2. Aerospace and Defense
- 10.2.3. Medical
- 10.2.4. Architecture
- 10.2.5. Other En
- 10.1. Market Analysis, Insights and Forecast - by Powder Type
- 11. Middle East and Africa 3D Printing Powder Market Analysis, Insights and Forecast, 2020-2032
- 11.1. Market Analysis, Insights and Forecast - by Powder Type
- 11.1.1. Plastic Powder
- 11.1.2. Metal Powder
- 11.1.3. Ceramic Powder
- 11.1.4. Glass Powder
- 11.1.5. Other Types (Composite Powder, etc.)
- 11.2. Market Analysis, Insights and Forecast - by End-user Industry
- 11.2.1. Automotive
- 11.2.2. Aerospace and Defense
- 11.2.3. Medical
- 11.2.4. Architecture
- 11.2.5. Other En
- 11.1. Market Analysis, Insights and Forecast - by Powder Type
- 12. Competitive Analysis
- 12.1. Company Profiles
- 12.1.1 Arkema
- 12.1.1.1. Company Overview
- 12.1.1.2. Products
- 12.1.1.3. Company Financials
- 12.1.1.4. SWOT Analysis
- 12.1.2 Sandvik AB
- 12.1.2.1. Company Overview
- 12.1.2.2. Products
- 12.1.2.3. Company Financials
- 12.1.2.4. SWOT Analysis
- 12.1.3 Höganäs AB
- 12.1.3.1. Company Overview
- 12.1.3.2. Products
- 12.1.3.3. Company Financials
- 12.1.3.4. SWOT Analysis
- 12.1.4 Evonik Industries AG
- 12.1.4.1. Company Overview
- 12.1.4.2. Products
- 12.1.4.3. Company Financials
- 12.1.4.4. SWOT Analysis
- 12.1.5 BASF SE
- 12.1.5.1. Company Overview
- 12.1.5.2. Products
- 12.1.5.3. Company Financials
- 12.1.5.4. SWOT Analysis
- 12.1.6 Metalysis
- 12.1.6.1. Company Overview
- 12.1.6.2. Products
- 12.1.6.3. Company Financials
- 12.1.6.4. SWOT Analysis
- 12.1.7 ERASTEEL
- 12.1.7.1. Company Overview
- 12.1.7.2. Products
- 12.1.7.3. Company Financials
- 12.1.7.4. SWOT Analysis
- 12.1.8 GKN Powder Metallurgy
- 12.1.8.1. Company Overview
- 12.1.8.2. Products
- 12.1.8.3. Company Financials
- 12.1.8.4. SWOT Analysis
- 12.1.9 ExOne
- 12.1.9.1. Company Overview
- 12.1.9.2. Products
- 12.1.9.3. Company Financials
- 12.1.9.4. SWOT Analysis
- 12.1.1 Arkema
- 12.2. Market Entropy
- 12.2.1 Company's Key Areas Served
- 12.2.2 Recent Developments
- 12.3. Company Market Share Analysis 2025
- 12.3.1 Top 5 Companies Market Share Analysis
- 12.3.2 Top 3 Companies Market Share Analysis
- 12.4. List of Potential Customers
- 13. Research Methodology
List of Figures
- Figure 1: Global 3D Printing Powder Market Revenue Breakdown (Million, %) by Region 2025 & 2033
- Figure 2: Global 3D Printing Powder Market Volume Breakdown (K Tons, %) by Region 2025 & 2033
- Figure 3: Asia Pacific 3D Printing Powder Market Revenue (Million), by Powder Type 2025 & 2033
- Figure 4: Asia Pacific 3D Printing Powder Market Volume (K Tons), by Powder Type 2025 & 2033
- Figure 5: Asia Pacific 3D Printing Powder Market Revenue Share (%), by Powder Type 2025 & 2033
- Figure 6: Asia Pacific 3D Printing Powder Market Volume Share (%), by Powder Type 2025 & 2033
- Figure 7: Asia Pacific 3D Printing Powder Market Revenue (Million), by End-user Industry 2025 & 2033
- Figure 8: Asia Pacific 3D Printing Powder Market Volume (K Tons), by End-user Industry 2025 & 2033
- Figure 9: Asia Pacific 3D Printing Powder Market Revenue Share (%), by End-user Industry 2025 & 2033
- Figure 10: Asia Pacific 3D Printing Powder Market Volume Share (%), by End-user Industry 2025 & 2033
- Figure 11: Asia Pacific 3D Printing Powder Market Revenue (Million), by Country 2025 & 2033
- Figure 12: Asia Pacific 3D Printing Powder Market Volume (K Tons), by Country 2025 & 2033
- Figure 13: Asia Pacific 3D Printing Powder Market Revenue Share (%), by Country 2025 & 2033
- Figure 14: Asia Pacific 3D Printing Powder Market Volume Share (%), by Country 2025 & 2033
- Figure 15: North America 3D Printing Powder Market Revenue (Million), by Powder Type 2025 & 2033
- Figure 16: North America 3D Printing Powder Market Volume (K Tons), by Powder Type 2025 & 2033
- Figure 17: North America 3D Printing Powder Market Revenue Share (%), by Powder Type 2025 & 2033
- Figure 18: North America 3D Printing Powder Market Volume Share (%), by Powder Type 2025 & 2033
- Figure 19: North America 3D Printing Powder Market Revenue (Million), by End-user Industry 2025 & 2033
- Figure 20: North America 3D Printing Powder Market Volume (K Tons), by End-user Industry 2025 & 2033
- Figure 21: North America 3D Printing Powder Market Revenue Share (%), by End-user Industry 2025 & 2033
- Figure 22: North America 3D Printing Powder Market Volume Share (%), by End-user Industry 2025 & 2033
- Figure 23: North America 3D Printing Powder Market Revenue (Million), by Country 2025 & 2033
- Figure 24: North America 3D Printing Powder Market Volume (K Tons), by Country 2025 & 2033
- Figure 25: North America 3D Printing Powder Market Revenue Share (%), by Country 2025 & 2033
- Figure 26: North America 3D Printing Powder Market Volume Share (%), by Country 2025 & 2033
- Figure 27: Europe 3D Printing Powder Market Revenue (Million), by Powder Type 2025 & 2033
- Figure 28: Europe 3D Printing Powder Market Volume (K Tons), by Powder Type 2025 & 2033
- Figure 29: Europe 3D Printing Powder Market Revenue Share (%), by Powder Type 2025 & 2033
- Figure 30: Europe 3D Printing Powder Market Volume Share (%), by Powder Type 2025 & 2033
- Figure 31: Europe 3D Printing Powder Market Revenue (Million), by End-user Industry 2025 & 2033
- Figure 32: Europe 3D Printing Powder Market Volume (K Tons), by End-user Industry 2025 & 2033
- Figure 33: Europe 3D Printing Powder Market Revenue Share (%), by End-user Industry 2025 & 2033
- Figure 34: Europe 3D Printing Powder Market Volume Share (%), by End-user Industry 2025 & 2033
- Figure 35: Europe 3D Printing Powder Market Revenue (Million), by Country 2025 & 2033
- Figure 36: Europe 3D Printing Powder Market Volume (K Tons), by Country 2025 & 2033
- Figure 37: Europe 3D Printing Powder Market Revenue Share (%), by Country 2025 & 2033
- Figure 38: Europe 3D Printing Powder Market Volume Share (%), by Country 2025 & 2033
- Figure 39: South America 3D Printing Powder Market Revenue (Million), by Powder Type 2025 & 2033
- Figure 40: South America 3D Printing Powder Market Volume (K Tons), by Powder Type 2025 & 2033
- Figure 41: South America 3D Printing Powder Market Revenue Share (%), by Powder Type 2025 & 2033
- Figure 42: South America 3D Printing Powder Market Volume Share (%), by Powder Type 2025 & 2033
- Figure 43: South America 3D Printing Powder Market Revenue (Million), by End-user Industry 2025 & 2033
- Figure 44: South America 3D Printing Powder Market Volume (K Tons), by End-user Industry 2025 & 2033
- Figure 45: South America 3D Printing Powder Market Revenue Share (%), by End-user Industry 2025 & 2033
- Figure 46: South America 3D Printing Powder Market Volume Share (%), by End-user Industry 2025 & 2033
- Figure 47: South America 3D Printing Powder Market Revenue (Million), by Country 2025 & 2033
- Figure 48: South America 3D Printing Powder Market Volume (K Tons), by Country 2025 & 2033
- Figure 49: South America 3D Printing Powder Market Revenue Share (%), by Country 2025 & 2033
- Figure 50: South America 3D Printing Powder Market Volume Share (%), by Country 2025 & 2033
- Figure 51: Middle East and Africa 3D Printing Powder Market Revenue (Million), by Powder Type 2025 & 2033
- Figure 52: Middle East and Africa 3D Printing Powder Market Volume (K Tons), by Powder Type 2025 & 2033
- Figure 53: Middle East and Africa 3D Printing Powder Market Revenue Share (%), by Powder Type 2025 & 2033
- Figure 54: Middle East and Africa 3D Printing Powder Market Volume Share (%), by Powder Type 2025 & 2033
- Figure 55: Middle East and Africa 3D Printing Powder Market Revenue (Million), by End-user Industry 2025 & 2033
- Figure 56: Middle East and Africa 3D Printing Powder Market Volume (K Tons), by End-user Industry 2025 & 2033
- Figure 57: Middle East and Africa 3D Printing Powder Market Revenue Share (%), by End-user Industry 2025 & 2033
- Figure 58: Middle East and Africa 3D Printing Powder Market Volume Share (%), by End-user Industry 2025 & 2033
- Figure 59: Middle East and Africa 3D Printing Powder Market Revenue (Million), by Country 2025 & 2033
- Figure 60: Middle East and Africa 3D Printing Powder Market Volume (K Tons), by Country 2025 & 2033
- Figure 61: Middle East and Africa 3D Printing Powder Market Revenue Share (%), by Country 2025 & 2033
- Figure 62: Middle East and Africa 3D Printing Powder Market Volume Share (%), by Country 2025 & 2033
List of Tables
- Table 1: Global 3D Printing Powder Market Revenue Million Forecast, by Powder Type 2020 & 2033
- Table 2: Global 3D Printing Powder Market Volume K Tons Forecast, by Powder Type 2020 & 2033
- Table 3: Global 3D Printing Powder Market Revenue Million Forecast, by End-user Industry 2020 & 2033
- Table 4: Global 3D Printing Powder Market Volume K Tons Forecast, by End-user Industry 2020 & 2033
- Table 5: Global 3D Printing Powder Market Revenue Million Forecast, by Region 2020 & 2033
- Table 6: Global 3D Printing Powder Market Volume K Tons Forecast, by Region 2020 & 2033
- Table 7: Global 3D Printing Powder Market Revenue Million Forecast, by Powder Type 2020 & 2033
- Table 8: Global 3D Printing Powder Market Volume K Tons Forecast, by Powder Type 2020 & 2033
- Table 9: Global 3D Printing Powder Market Revenue Million Forecast, by End-user Industry 2020 & 2033
- Table 10: Global 3D Printing Powder Market Volume K Tons Forecast, by End-user Industry 2020 & 2033
- Table 11: Global 3D Printing Powder Market Revenue Million Forecast, by Country 2020 & 2033
- Table 12: Global 3D Printing Powder Market Volume K Tons Forecast, by Country 2020 & 2033
- Table 13: China 3D Printing Powder Market Revenue (Million) Forecast, by Application 2020 & 2033
- Table 14: China 3D Printing Powder Market Volume (K Tons) Forecast, by Application 2020 & 2033
- Table 15: India 3D Printing Powder Market Revenue (Million) Forecast, by Application 2020 & 2033
- Table 16: India 3D Printing Powder Market Volume (K Tons) Forecast, by Application 2020 & 2033
- Table 17: Japan 3D Printing Powder Market Revenue (Million) Forecast, by Application 2020 & 2033
- Table 18: Japan 3D Printing Powder Market Volume (K Tons) Forecast, by Application 2020 & 2033
- Table 19: South Korea 3D Printing Powder Market Revenue (Million) Forecast, by Application 2020 & 2033
- Table 20: South Korea 3D Printing Powder Market Volume (K Tons) Forecast, by Application 2020 & 2033
- Table 21: Rest of Asia Pacific 3D Printing Powder Market Revenue (Million) Forecast, by Application 2020 & 2033
- Table 22: Rest of Asia Pacific 3D Printing Powder Market Volume (K Tons) Forecast, by Application 2020 & 2033
- Table 23: Global 3D Printing Powder Market Revenue Million Forecast, by Powder Type 2020 & 2033
- Table 24: Global 3D Printing Powder Market Volume K Tons Forecast, by Powder Type 2020 & 2033
- Table 25: Global 3D Printing Powder Market Revenue Million Forecast, by End-user Industry 2020 & 2033
- Table 26: Global 3D Printing Powder Market Volume K Tons Forecast, by End-user Industry 2020 & 2033
- Table 27: Global 3D Printing Powder Market Revenue Million Forecast, by Country 2020 & 2033
- Table 28: Global 3D Printing Powder Market Volume K Tons Forecast, by Country 2020 & 2033
- Table 29: United States 3D Printing Powder Market Revenue (Million) Forecast, by Application 2020 & 2033
- Table 30: United States 3D Printing Powder Market Volume (K Tons) Forecast, by Application 2020 & 2033
- Table 31: Canada 3D Printing Powder Market Revenue (Million) Forecast, by Application 2020 & 2033
- Table 32: Canada 3D Printing Powder Market Volume (K Tons) Forecast, by Application 2020 & 2033
- Table 33: Mexico 3D Printing Powder Market Revenue (Million) Forecast, by Application 2020 & 2033
- Table 34: Mexico 3D Printing Powder Market Volume (K Tons) Forecast, by Application 2020 & 2033
- Table 35: Global 3D Printing Powder Market Revenue Million Forecast, by Powder Type 2020 & 2033
- Table 36: Global 3D Printing Powder Market Volume K Tons Forecast, by Powder Type 2020 & 2033
- Table 37: Global 3D Printing Powder Market Revenue Million Forecast, by End-user Industry 2020 & 2033
- Table 38: Global 3D Printing Powder Market Volume K Tons Forecast, by End-user Industry 2020 & 2033
- Table 39: Global 3D Printing Powder Market Revenue Million Forecast, by Country 2020 & 2033
- Table 40: Global 3D Printing Powder Market Volume K Tons Forecast, by Country 2020 & 2033
- Table 41: Germany 3D Printing Powder Market Revenue (Million) Forecast, by Application 2020 & 2033
- Table 42: Germany 3D Printing Powder Market Volume (K Tons) Forecast, by Application 2020 & 2033
- Table 43: United Kingdom 3D Printing Powder Market Revenue (Million) Forecast, by Application 2020 & 2033
- Table 44: United Kingdom 3D Printing Powder Market Volume (K Tons) Forecast, by Application 2020 & 2033
- Table 45: France 3D Printing Powder Market Revenue (Million) Forecast, by Application 2020 & 2033
- Table 46: France 3D Printing Powder Market Volume (K Tons) Forecast, by Application 2020 & 2033
- Table 47: Italy 3D Printing Powder Market Revenue (Million) Forecast, by Application 2020 & 2033
- Table 48: Italy 3D Printing Powder Market Volume (K Tons) Forecast, by Application 2020 & 2033
- Table 49: Rest of Europe 3D Printing Powder Market Revenue (Million) Forecast, by Application 2020 & 2033
- Table 50: Rest of Europe 3D Printing Powder Market Volume (K Tons) Forecast, by Application 2020 & 2033
- Table 51: Global 3D Printing Powder Market Revenue Million Forecast, by Powder Type 2020 & 2033
- Table 52: Global 3D Printing Powder Market Volume K Tons Forecast, by Powder Type 2020 & 2033
- Table 53: Global 3D Printing Powder Market Revenue Million Forecast, by End-user Industry 2020 & 2033
- Table 54: Global 3D Printing Powder Market Volume K Tons Forecast, by End-user Industry 2020 & 2033
- Table 55: Global 3D Printing Powder Market Revenue Million Forecast, by Country 2020 & 2033
- Table 56: Global 3D Printing Powder Market Volume K Tons Forecast, by Country 2020 & 2033
- Table 57: Brazil 3D Printing Powder Market Revenue (Million) Forecast, by Application 2020 & 2033
- Table 58: Brazil 3D Printing Powder Market Volume (K Tons) Forecast, by Application 2020 & 2033
- Table 59: Argentina 3D Printing Powder Market Revenue (Million) Forecast, by Application 2020 & 2033
- Table 60: Argentina 3D Printing Powder Market Volume (K Tons) Forecast, by Application 2020 & 2033
- Table 61: Rest of South America 3D Printing Powder Market Revenue (Million) Forecast, by Application 2020 & 2033
- Table 62: Rest of South America 3D Printing Powder Market Volume (K Tons) Forecast, by Application 2020 & 2033
- Table 63: Global 3D Printing Powder Market Revenue Million Forecast, by Powder Type 2020 & 2033
- Table 64: Global 3D Printing Powder Market Volume K Tons Forecast, by Powder Type 2020 & 2033
- Table 65: Global 3D Printing Powder Market Revenue Million Forecast, by End-user Industry 2020 & 2033
- Table 66: Global 3D Printing Powder Market Volume K Tons Forecast, by End-user Industry 2020 & 2033
- Table 67: Global 3D Printing Powder Market Revenue Million Forecast, by Country 2020 & 2033
- Table 68: Global 3D Printing Powder Market Volume K Tons Forecast, by Country 2020 & 2033
- Table 69: Saudi Arabia 3D Printing Powder Market Revenue (Million) Forecast, by Application 2020 & 2033
- Table 70: Saudi Arabia 3D Printing Powder Market Volume (K Tons) Forecast, by Application 2020 & 2033
- Table 71: South Africa 3D Printing Powder Market Revenue (Million) Forecast, by Application 2020 & 2033
- Table 72: South Africa 3D Printing Powder Market Volume (K Tons) Forecast, by Application 2020 & 2033
- Table 73: Rest of Middle East and Africa 3D Printing Powder Market Revenue (Million) Forecast, by Application 2020 & 2033
- Table 74: Rest of Middle East and Africa 3D Printing Powder Market Volume (K Tons) Forecast, by Application 2020 & 2033
Frequently Asked Questions
1. What is the projected Compound Annual Growth Rate (CAGR) of the 3D Printing Powder Market?
The projected CAGR is approximately > 16.50%.
2. Which companies are prominent players in the 3D Printing Powder Market?
Key companies in the market include Arkema, Sandvik AB, Höganäs AB, Evonik Industries AG, BASF SE, Metalysis, ERASTEEL, GKN Powder Metallurgy, ExOne.
3. What are the main segments of the 3D Printing Powder Market?
The market segments include Powder Type, End-user Industry.
4. Can you provide details about the market size?
The market size is estimated to be USD 2.06 Million as of 2022.
5. What are some drivers contributing to market growth?
Increasing Applications in Aerospace and Automobile Industries; Growing Demand from Medical Sector; Other Drivers.
6. What are the notable trends driving market growth?
Growing Demand from Automobile Sector.
7. Are there any restraints impacting market growth?
HIgh Material and Post Processing Cost; Hazardous in Nature.
8. Can you provide examples of recent developments in the market?
N/A
9. What pricing options are available for accessing the report?
Pricing options include single-user, multi-user, and enterprise licenses priced at USD 4750, USD 5250, and USD 8750 respectively.
10. Is the market size provided in terms of value or volume?
The market size is provided in terms of value, measured in Million and volume, measured in K Tons.
11. Are there any specific market keywords associated with the report?
Yes, the market keyword associated with the report is "3D Printing Powder Market," which aids in identifying and referencing the specific market segment covered.
12. How do I determine which pricing option suits my needs best?
The pricing options vary based on user requirements and access needs. Individual users may opt for single-user licenses, while businesses requiring broader access may choose multi-user or enterprise licenses for cost-effective access to the report.
13. Are there any additional resources or data provided in the 3D Printing Powder Market report?
While the report offers comprehensive insights, it's advisable to review the specific contents or supplementary materials provided to ascertain if additional resources or data are available.
14. How can I stay updated on further developments or reports in the 3D Printing Powder Market?
To stay informed about further developments, trends, and reports in the 3D Printing Powder Market, consider subscribing to industry newsletters, following relevant companies and organizations, or regularly checking reputable industry news sources and publications.
Methodology
Step 1 - Identification of Relevant Samples Size from Population Database


Step 2 - Approaches for Defining Global Market Size (Value, Volume* & Price*)

Note*: In applicable scenarios
Step 3 - Data Sources
Primary Research
- Web Analytics
- Survey Reports
- Research Institute
- Latest Research Reports
- Opinion Leaders
Secondary Research
- Annual Reports
- White Paper
- Latest Press Release
- Industry Association
- Paid Database
- Investor Presentations

Step 4 - Data Triangulation
Involves using different sources of information in order to increase the validity of a study
These sources are likely to be stakeholders in a program - participants, other researchers, program staff, other community members, and so on.
Then we put all data in single framework & apply various statistical tools to find out the dynamic on the market.
During the analysis stage, feedback from the stakeholder groups would be compared to determine areas of agreement as well as areas of divergence