

Key Insights
The advanced carbon products market, encompassing materials like carbon fibers, graphene, and carbon nanotubes, is experiencing robust growth, projected at a CAGR of 9.82% from 2025 to 2033. This expansion is driven by several key factors. Increasing demand from the aerospace and defense sector, fueled by the need for lightweight yet high-strength materials in aircraft and spacecraft, is a significant contributor. The electronics industry's adoption of advanced carbon materials for enhanced conductivity and thermal management in semiconductors and batteries is another major driver. Furthermore, the automotive industry's push for fuel efficiency and lightweight vehicles is bolstering demand for carbon fibers in automotive components. The burgeoning renewable energy sector also presents significant opportunities, with carbon materials finding applications in solar cells and energy storage solutions. While challenges remain, such as the relatively high cost of production for some advanced carbon materials and the need for further advancements in processing techniques, the overall market outlook remains positive.
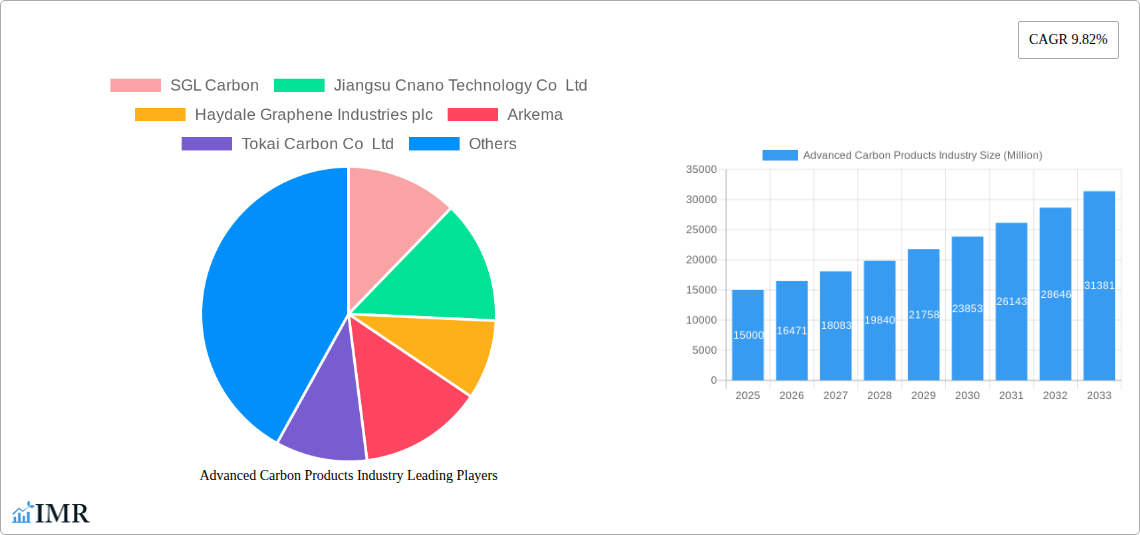
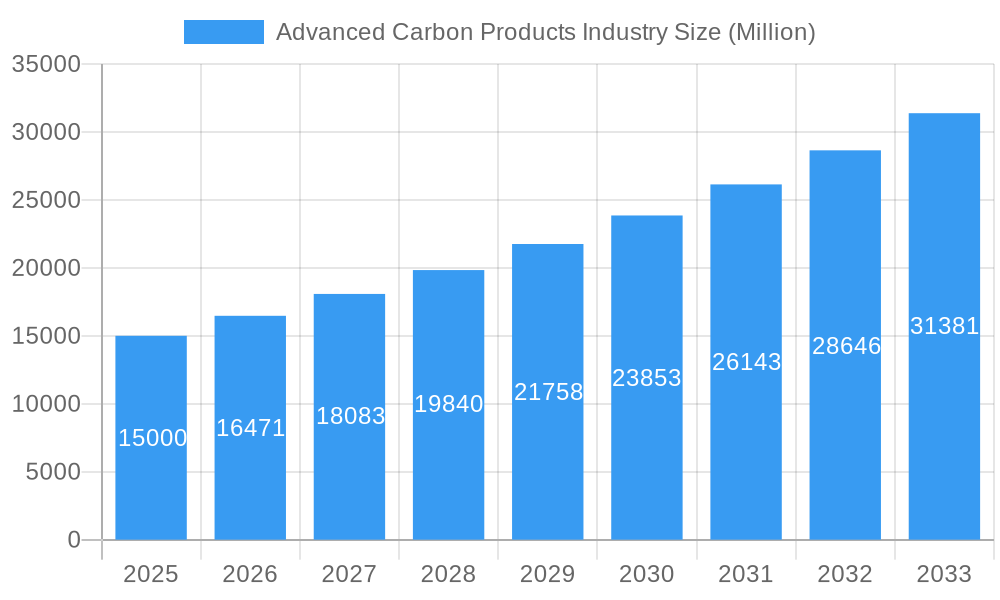
Advanced Carbon Products Industry Market Size (In Billion)
The market segmentation reveals significant variations in growth potential across different product types and applications. Carbon fibers currently dominate the market, followed by special graphite, reflecting their established presence in various industries. However, graphene and carbon nanotubes are poised for substantial growth, driven by ongoing research and development efforts leading to broader adoption in niche applications. Regionally, North America and Asia-Pacific are expected to be the leading markets, with China and the United States holding significant shares. The competitive landscape is highly fragmented, with numerous players ranging from established chemical giants like Arkema and Solvay to specialized carbon material manufacturers. Strategic partnerships, mergers, and acquisitions are anticipated to shape the competitive dynamics in the coming years as companies strive to expand their product portfolios and market reach. The ongoing focus on sustainability and the increasing demand for high-performance materials are likely to further fuel the growth of this dynamic market.
Advanced Carbon Products Industry Company Market Share
Advanced Carbon Products Industry Market Report: 2019-2033
This comprehensive report provides an in-depth analysis of the Advanced Carbon Products industry, encompassing market dynamics, growth trends, regional dominance, product landscape, key players, and future outlook. The study period covers 2019-2033, with 2025 as the base and estimated year, and a forecast period of 2025-2033. The report leverages extensive primary and secondary research to deliver actionable insights for industry professionals, investors, and strategic decision-makers. The total market value is predicted to reach xx Million by 2033.
Advanced Carbon Products Industry Market Dynamics & Structure
The Advanced Carbon Products market is characterized by a moderately concentrated landscape, with key players like SGL Carbon, Tokai Carbon, and GrafTech International holding significant market share. Technological innovation, particularly in graphene and carbon nanotubes, is a primary growth driver, while stringent environmental regulations are shaping manufacturing processes. The industry faces competition from alternative materials, such as composites and polymers, but the unique properties of advanced carbon products – high strength-to-weight ratio, electrical conductivity, and thermal stability – ensure continued demand. Mergers and acquisitions (M&A) activity has been moderate, with strategic alliances focusing on expanding product portfolios and geographical reach.
- Market Concentration: Moderately concentrated, with top 5 players holding approximately xx% market share in 2025.
- Technological Innovation: Graphene and CNT development driving significant advancements in performance and applications.
- Regulatory Framework: Increasingly stringent environmental regulations impacting manufacturing and disposal practices.
- Competitive Substitutes: Composites and polymers present competitive challenges in specific applications.
- End-User Demographics: Aerospace & Defense, automotive, and electronics are major end-use segments.
- M&A Trends: Moderate M&A activity, primarily focused on strategic acquisitions and technology integration. xx M&A deals were recorded between 2019 and 2024.
Advanced Carbon Products Industry Growth Trends & Insights
The Advanced Carbon Products market exhibits robust growth, driven by increasing demand across diverse sectors. The market size expanded from xx Million in 2019 to xx Million in 2024, demonstrating a CAGR of xx%. This growth is fueled by the adoption of advanced carbon materials in lightweighting initiatives in the automotive and aerospace industries, the increasing use of carbon nanotubes in electronics, and the rising popularity of graphene-enhanced products. Technological advancements, such as improved production methods and functionalization techniques, are further propelling market expansion. Consumer preference for sustainable and high-performance materials also contributes to market growth. Market penetration rates vary significantly across different product types and applications, with carbon fibers exhibiting the highest penetration in aerospace and automotive sectors.
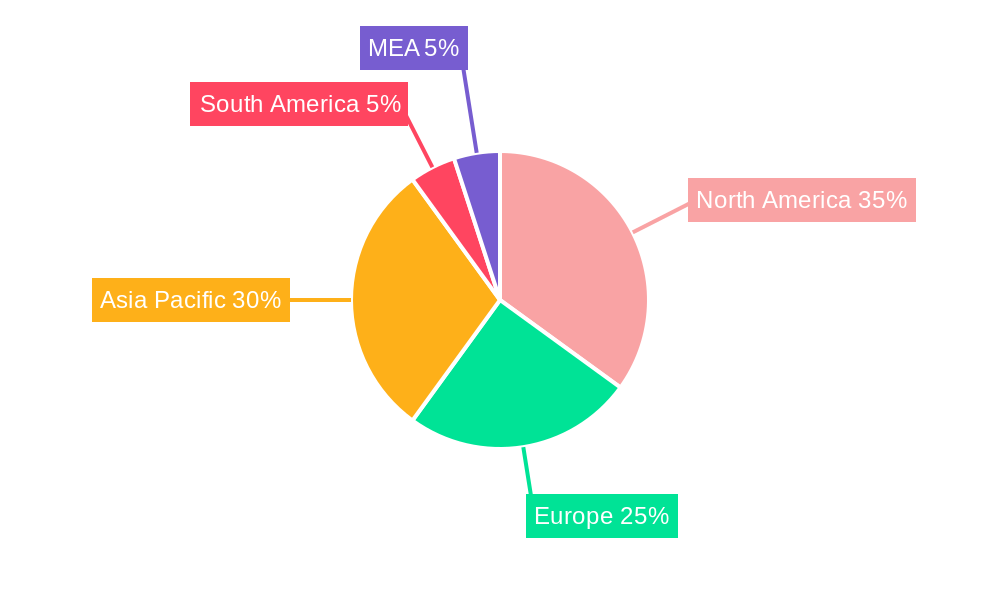
Dominant Regions, Countries, or Segments in Advanced Carbon Products Industry
North America and Asia-Pacific currently dominate the Advanced Carbon Products market, driven by strong demand from automotive, aerospace, and electronics sectors in these regions. Within product types, carbon fibers hold the largest market share due to established applications and mature manufacturing capabilities. The special graphite segment is also experiencing strong growth, fueled by its application in high-temperature and high-performance applications.
- Leading Region: North America and Asia-Pacific (market share approximately xx% and xx% respectively in 2025).
- Key Country Drivers: USA, China, Japan, and Germany.
- Dominant Product Type: Carbon Fibers (Market share xx% in 2025).
- High-Growth Segment: Special Graphite and Carbon Nanotubes.
- Growth Drivers: Government support for R&D, infrastructure development, increasing industrialization, and rising disposable income.
Advanced Carbon Products Industry Product Landscape
Advanced carbon products encompass a diverse range of materials, including carbon fibers, special graphite, carbon nanotubes, graphene, carbon foams, fullerenes, diamond-like carbon (DLC), and nanocrystalline diamond (NCD). These materials exhibit exceptional properties tailored to various applications, offering superior strength, conductivity, and thermal management capabilities. Continuous innovation focuses on enhancing performance metrics like tensile strength, surface area, and purity, driving the development of specialized materials with unique functionalities.
Key Drivers, Barriers & Challenges in Advanced Carbon Products Industry
Key Drivers:
- Technological advancements (e.g., improved synthesis methods, functionalization techniques)
- Growing demand from key industries (e.g., aerospace, automotive, electronics)
- Government support and funding for R&D and commercialization
- Increasing awareness of sustainability and eco-friendly materials
Key Challenges:
- High production costs, particularly for graphene and CNTs
- Supply chain disruptions and raw material price volatility
- Stringent regulatory requirements for safe handling and disposal
- Competition from alternative materials (e.g., polymers, composites)
Emerging Opportunities in Advanced Carbon Products Industry
- Untapped markets in developing economies
- Innovative applications in energy storage, biomedical devices, and water treatment
- Growing demand for high-performance, lightweight materials in sustainable transportation
- Development of advanced composites and hybrid materials incorporating carbon products.
Growth Accelerators in the Advanced Carbon Products Industry
Technological breakthroughs in material synthesis and processing, along with strategic partnerships between material suppliers and end-use industries, are accelerating market growth. Government incentives promoting the adoption of advanced materials in key sectors and expanding manufacturing capacity contribute to the long-term growth trajectory of the Advanced Carbon Products industry.
Key Players Shaping the Advanced Carbon Products Industry Market
- SGL Carbon
- Jiangsu Cnano Technology Co Ltd
- Haydale Graphene Industries plc
- Arkema
- Tokai Carbon Co Ltd
- Solvay
- Antolin
- POCO
- Perpetuus Advanced Materials PLC
- FutureCarbon GmbH
- Shenzhen Sanshun Nano New Materials Co Ltd
- GrafTech International
- Nanocyl SA
- Grupo Graphenano
- Graphenea Inc
- Arry International Group Limited
- Ningbo Morsh Technology
- Hyperion Catalysis International
- XG Sciences Inc
- The Sixth Element (Changzhou) Materials Technology Co Ltd
- Nano-C
- Nippon Graphite Fiber Co Ltd
- Global Graphene Group
- Toyo Tanso Co Ltd
- CFOAM LLC
- TORAY INDUSTRIES INC
- Mitsubishi Chemical Carbon Fiber and Composites Inc
- Thomas Swan & Co Ltd
- Hexcel Corporation
- Formosa Plastics Corporation
- TEIJIN LIMITED
- Graphite India Limited
- SHOWA DENKO K K
Notable Milestones in Advanced Carbon Products Industry Sector
- 2020: Successful commercialization of a novel graphene-based composite by [Company Name].
- 2021: Launch of a new carbon fiber production facility by [Company Name], expanding global capacity.
- 2022: Strategic partnership between [Company Name] and [Company Name] to develop advanced carbon nanotube applications.
- 2023: Acquisition of [Company Name] by [Company Name], strengthening market position.
- 2024: Government announcement of funding for R&D in advanced carbon materials.
In-Depth Advanced Carbon Products Industry Market Outlook
The Advanced Carbon Products market is poised for continued strong growth, driven by technological innovation and increasing demand across various sectors. Strategic opportunities exist in developing new applications for graphene and carbon nanotubes, improving the cost-effectiveness of production, and expanding into new geographical markets. The focus on sustainability and eco-friendly materials will also drive further adoption. The market is expected to reach xx Million by 2033, presenting significant potential for both established players and new entrants.
Advanced Carbon Products Industry Segmentation
-
1. Product Type
- 1.1. Carbon Fibers
- 1.2. Special Graphite
- 1.3. Carbon Nanotubes
- 1.4. Graphene
- 1.5. Carbon Foams (Includes Carbon Nanofoams)
- 1.6. Others (
-
2. Application
- 2.1. Aerospace and Defence
- 2.2. Electronics
- 2.3. Sports
- 2.4. Automotive
- 2.5. Construction
- 2.6. Energy
- 2.7. Others
Advanced Carbon Products Industry Segmentation By Geography
-
1. Asia Pacific
- 1.1. China
- 1.2. India
- 1.3. Japan
- 1.4. South Korea
- 1.5. Rest of Asia Pacific
-
2. North America
- 2.1. United States
- 2.2. Canada
- 2.3. Mexico
-
3. Europe
- 3.1. Germany
- 3.2. United Kingdom
- 3.3. France
- 3.4. Italy
- 3.5. Spain
- 3.6. Russia
- 3.7. Rest of Europe
-
4. South America
- 4.1. Brazil
- 4.2. Argentina
- 4.3. Rest of South America
-
5. Middle East and Africa
- 5.1. Saudi Arabia
- 5.2. United Arab Emirates
- 5.3. South Africa
- 5.4. Rest of Middle East and Africa
Advanced Carbon Products Industry Regional Market Share
Geographic Coverage of Advanced Carbon Products Industry
Advanced Carbon Products Industry REPORT HIGHLIGHTS
| Aspects | Details |
|---|---|
| Study Period | 2020-2034 |
| Base Year | 2025 |
| Estimated Year | 2026 |
| Forecast Period | 2026-2034 |
| Historical Period | 2020-2025 |
| Growth Rate | CAGR of 9.82% from 2020-2034 |
| Segmentation |
|
Table of Contents
- 1. Introduction
- 1.1. Research Scope
- 1.2. Market Segmentation
- 1.3. Research Objective
- 1.4. Definitions and Assumptions
- 2. Executive Summary
- 2.1. Market Snapshot
- 3. Market Dynamics
- 3.1. Market Drivers
- 3.2. Market Restrains
- 3.3. Market Trends
- 3.4. Market Opportunities
- 4. Market Factor Analysis
- 4.1. Porters Five Forces
- 4.1.1. Bargaining Power of Suppliers
- 4.1.2. Bargaining Power of Buyers
- 4.1.3. Threat of New Entrants
- 4.1.4. Threat of Substitutes
- 4.1.5. Competitive Rivalry
- 4.2. PESTEL analysis
- 4.3. BCG Analysis
- 4.3.1. Stars (High Growth, High Market Share)
- 4.3.2. Cash Cows (Low Growth, High Market Share)
- 4.3.3. Question Mark (High Growth, Low Market Share)
- 4.3.4. Dogs (Low Growth, Low Market Share)
- 4.4. Ansoff Matrix Analysis
- 4.5. Supply Chain Analysis
- 4.6. Regulatory Landscape
- 4.7. Current Market Potential and Opportunity Assessment (TAM–SAM–SOM Framework)
- 4.8. IMR Analyst Note
- 4.1. Porters Five Forces
- 5. Market Analysis, Insights and Forecast 2021-2033
- 5.1. Market Analysis, Insights and Forecast - by Product Type
- 5.1.1. Carbon Fibers
- 5.1.2. Special Graphite
- 5.1.3. Carbon Nanotubes
- 5.1.4. Graphene
- 5.1.5. Carbon Foams (Includes Carbon Nanofoams)
- 5.1.6. Others (
- 5.2. Market Analysis, Insights and Forecast - by Application
- 5.2.1. Aerospace and Defence
- 5.2.2. Electronics
- 5.2.3. Sports
- 5.2.4. Automotive
- 5.2.5. Construction
- 5.2.6. Energy
- 5.2.7. Others
- 5.3. Market Analysis, Insights and Forecast - by Region
- 5.3.1. Asia Pacific
- 5.3.2. North America
- 5.3.3. Europe
- 5.3.4. South America
- 5.3.5. Middle East and Africa
- 5.1. Market Analysis, Insights and Forecast - by Product Type
- 6. Global Advanced Carbon Products Industry Analysis, Insights and Forecast, 2021-2033
- 6.1. Market Analysis, Insights and Forecast - by Product Type
- 6.1.1. Carbon Fibers
- 6.1.2. Special Graphite
- 6.1.3. Carbon Nanotubes
- 6.1.4. Graphene
- 6.1.5. Carbon Foams (Includes Carbon Nanofoams)
- 6.1.6. Others (
- 6.2. Market Analysis, Insights and Forecast - by Application
- 6.2.1. Aerospace and Defence
- 6.2.2. Electronics
- 6.2.3. Sports
- 6.2.4. Automotive
- 6.2.5. Construction
- 6.2.6. Energy
- 6.2.7. Others
- 6.1. Market Analysis, Insights and Forecast - by Product Type
- 7. Asia Pacific Advanced Carbon Products Industry Analysis, Insights and Forecast, 2020-2032
- 7.1. Market Analysis, Insights and Forecast - by Product Type
- 7.1.1. Carbon Fibers
- 7.1.2. Special Graphite
- 7.1.3. Carbon Nanotubes
- 7.1.4. Graphene
- 7.1.5. Carbon Foams (Includes Carbon Nanofoams)
- 7.1.6. Others (
- 7.2. Market Analysis, Insights and Forecast - by Application
- 7.2.1. Aerospace and Defence
- 7.2.2. Electronics
- 7.2.3. Sports
- 7.2.4. Automotive
- 7.2.5. Construction
- 7.2.6. Energy
- 7.2.7. Others
- 7.1. Market Analysis, Insights and Forecast - by Product Type
- 8. North America Advanced Carbon Products Industry Analysis, Insights and Forecast, 2020-2032
- 8.1. Market Analysis, Insights and Forecast - by Product Type
- 8.1.1. Carbon Fibers
- 8.1.2. Special Graphite
- 8.1.3. Carbon Nanotubes
- 8.1.4. Graphene
- 8.1.5. Carbon Foams (Includes Carbon Nanofoams)
- 8.1.6. Others (
- 8.2. Market Analysis, Insights and Forecast - by Application
- 8.2.1. Aerospace and Defence
- 8.2.2. Electronics
- 8.2.3. Sports
- 8.2.4. Automotive
- 8.2.5. Construction
- 8.2.6. Energy
- 8.2.7. Others
- 8.1. Market Analysis, Insights and Forecast - by Product Type
- 9. Europe Advanced Carbon Products Industry Analysis, Insights and Forecast, 2020-2032
- 9.1. Market Analysis, Insights and Forecast - by Product Type
- 9.1.1. Carbon Fibers
- 9.1.2. Special Graphite
- 9.1.3. Carbon Nanotubes
- 9.1.4. Graphene
- 9.1.5. Carbon Foams (Includes Carbon Nanofoams)
- 9.1.6. Others (
- 9.2. Market Analysis, Insights and Forecast - by Application
- 9.2.1. Aerospace and Defence
- 9.2.2. Electronics
- 9.2.3. Sports
- 9.2.4. Automotive
- 9.2.5. Construction
- 9.2.6. Energy
- 9.2.7. Others
- 9.1. Market Analysis, Insights and Forecast - by Product Type
- 10. South America Advanced Carbon Products Industry Analysis, Insights and Forecast, 2020-2032
- 10.1. Market Analysis, Insights and Forecast - by Product Type
- 10.1.1. Carbon Fibers
- 10.1.2. Special Graphite
- 10.1.3. Carbon Nanotubes
- 10.1.4. Graphene
- 10.1.5. Carbon Foams (Includes Carbon Nanofoams)
- 10.1.6. Others (
- 10.2. Market Analysis, Insights and Forecast - by Application
- 10.2.1. Aerospace and Defence
- 10.2.2. Electronics
- 10.2.3. Sports
- 10.2.4. Automotive
- 10.2.5. Construction
- 10.2.6. Energy
- 10.2.7. Others
- 10.1. Market Analysis, Insights and Forecast - by Product Type
- 11. Middle East and Africa Advanced Carbon Products Industry Analysis, Insights and Forecast, 2020-2032
- 11.1. Market Analysis, Insights and Forecast - by Product Type
- 11.1.1. Carbon Fibers
- 11.1.2. Special Graphite
- 11.1.3. Carbon Nanotubes
- 11.1.4. Graphene
- 11.1.5. Carbon Foams (Includes Carbon Nanofoams)
- 11.1.6. Others (
- 11.2. Market Analysis, Insights and Forecast - by Application
- 11.2.1. Aerospace and Defence
- 11.2.2. Electronics
- 11.2.3. Sports
- 11.2.4. Automotive
- 11.2.5. Construction
- 11.2.6. Energy
- 11.2.7. Others
- 11.1. Market Analysis, Insights and Forecast - by Product Type
- 12. Competitive Analysis
- 12.1. Company Profiles
- 12.1.1 SGL Carbon
- 12.1.1.1. Company Overview
- 12.1.1.2. Products
- 12.1.1.3. Company Financials
- 12.1.1.4. SWOT Analysis
- 12.1.2 Jiangsu Cnano Technology Co Ltd
- 12.1.2.1. Company Overview
- 12.1.2.2. Products
- 12.1.2.3. Company Financials
- 12.1.2.4. SWOT Analysis
- 12.1.3 Haydale Graphene Industries plc
- 12.1.3.1. Company Overview
- 12.1.3.2. Products
- 12.1.3.3. Company Financials
- 12.1.3.4. SWOT Analysis
- 12.1.4 Arkema
- 12.1.4.1. Company Overview
- 12.1.4.2. Products
- 12.1.4.3. Company Financials
- 12.1.4.4. SWOT Analysis
- 12.1.5 Tokai Carbon Co Ltd
- 12.1.5.1. Company Overview
- 12.1.5.2. Products
- 12.1.5.3. Company Financials
- 12.1.5.4. SWOT Analysis
- 12.1.6 Solvay
- 12.1.6.1. Company Overview
- 12.1.6.2. Products
- 12.1.6.3. Company Financials
- 12.1.6.4. SWOT Analysis
- 12.1.7 Antolin
- 12.1.7.1. Company Overview
- 12.1.7.2. Products
- 12.1.7.3. Company Financials
- 12.1.7.4. SWOT Analysis
- 12.1.8 POCO
- 12.1.8.1. Company Overview
- 12.1.8.2. Products
- 12.1.8.3. Company Financials
- 12.1.8.4. SWOT Analysis
- 12.1.9 Perpetuus Advanced Materials PLC
- 12.1.9.1. Company Overview
- 12.1.9.2. Products
- 12.1.9.3. Company Financials
- 12.1.9.4. SWOT Analysis
- 12.1.10 FutureCarbon GmbH
- 12.1.10.1. Company Overview
- 12.1.10.2. Products
- 12.1.10.3. Company Financials
- 12.1.10.4. SWOT Analysis
- 12.1.11 Shenzhen Sanshun Nano New Materials Co Ltd
- 12.1.11.1. Company Overview
- 12.1.11.2. Products
- 12.1.11.3. Company Financials
- 12.1.11.4. SWOT Analysis
- 12.1.12 GrafTech International
- 12.1.12.1. Company Overview
- 12.1.12.2. Products
- 12.1.12.3. Company Financials
- 12.1.12.4. SWOT Analysis
- 12.1.13 Nanocyl SA
- 12.1.13.1. Company Overview
- 12.1.13.2. Products
- 12.1.13.3. Company Financials
- 12.1.13.4. SWOT Analysis
- 12.1.14 Grupo Graphenano
- 12.1.14.1. Company Overview
- 12.1.14.2. Products
- 12.1.14.3. Company Financials
- 12.1.14.4. SWOT Analysis
- 12.1.15 Graphenea Inc
- 12.1.15.1. Company Overview
- 12.1.15.2. Products
- 12.1.15.3. Company Financials
- 12.1.15.4. SWOT Analysis
- 12.1.16 Arry International Group Limited
- 12.1.16.1. Company Overview
- 12.1.16.2. Products
- 12.1.16.3. Company Financials
- 12.1.16.4. SWOT Analysis
- 12.1.17 Ningbo Morsh Technology
- 12.1.17.1. Company Overview
- 12.1.17.2. Products
- 12.1.17.3. Company Financials
- 12.1.17.4. SWOT Analysis
- 12.1.18 Hyperion Catalysis International
- 12.1.18.1. Company Overview
- 12.1.18.2. Products
- 12.1.18.3. Company Financials
- 12.1.18.4. SWOT Analysis
- 12.1.19 XG Sciences Inc
- 12.1.19.1. Company Overview
- 12.1.19.2. Products
- 12.1.19.3. Company Financials
- 12.1.19.4. SWOT Analysis
- 12.1.20 The Sixth Element (Changzhou) Materials Technology Co Ltd
- 12.1.20.1. Company Overview
- 12.1.20.2. Products
- 12.1.20.3. Company Financials
- 12.1.20.4. SWOT Analysis
- 12.1.21 Nano-C
- 12.1.21.1. Company Overview
- 12.1.21.2. Products
- 12.1.21.3. Company Financials
- 12.1.21.4. SWOT Analysis
- 12.1.22 Nippon Graphite Fiber Co Ltd
- 12.1.22.1. Company Overview
- 12.1.22.2. Products
- 12.1.22.3. Company Financials
- 12.1.22.4. SWOT Analysis
- 12.1.23 Global Graphene Group
- 12.1.23.1. Company Overview
- 12.1.23.2. Products
- 12.1.23.3. Company Financials
- 12.1.23.4. SWOT Analysis
- 12.1.24 Toyo Tanso Co Ltd
- 12.1.24.1. Company Overview
- 12.1.24.2. Products
- 12.1.24.3. Company Financials
- 12.1.24.4. SWOT Analysis
- 12.1.25 CFOAM LLC
- 12.1.25.1. Company Overview
- 12.1.25.2. Products
- 12.1.25.3. Company Financials
- 12.1.25.4. SWOT Analysis
- 12.1.26 TORAY INDUSTRIES INC
- 12.1.26.1. Company Overview
- 12.1.26.2. Products
- 12.1.26.3. Company Financials
- 12.1.26.4. SWOT Analysis
- 12.1.27 Mitsubishi Chemical Carbon Fiber and Composites Inc
- 12.1.27.1. Company Overview
- 12.1.27.2. Products
- 12.1.27.3. Company Financials
- 12.1.27.4. SWOT Analysis
- 12.1.28 Thomas Swan & Co Ltd
- 12.1.28.1. Company Overview
- 12.1.28.2. Products
- 12.1.28.3. Company Financials
- 12.1.28.4. SWOT Analysis
- 12.1.29 Hexcel Corporation
- 12.1.29.1. Company Overview
- 12.1.29.2. Products
- 12.1.29.3. Company Financials
- 12.1.29.4. SWOT Analysis
- 12.1.30 Formosa Plastics Corporation
- 12.1.30.1. Company Overview
- 12.1.30.2. Products
- 12.1.30.3. Company Financials
- 12.1.30.4. SWOT Analysis
- 12.1.31 TEIJIN LIMITED
- 12.1.31.1. Company Overview
- 12.1.31.2. Products
- 12.1.31.3. Company Financials
- 12.1.31.4. SWOT Analysis
- 12.1.32 Graphite India Limited
- 12.1.32.1. Company Overview
- 12.1.32.2. Products
- 12.1.32.3. Company Financials
- 12.1.32.4. SWOT Analysis
- 12.1.33 SHOWA DENKO K K
- 12.1.33.1. Company Overview
- 12.1.33.2. Products
- 12.1.33.3. Company Financials
- 12.1.33.4. SWOT Analysis
- 12.1.1 SGL Carbon
- 12.2. Market Entropy
- 12.2.1 Company's Key Areas Served
- 12.2.2 Recent Developments
- 12.3. Company Market Share Analysis 2025
- 12.3.1 Top 5 Companies Market Share Analysis
- 12.3.2 Top 3 Companies Market Share Analysis
- 12.4. List of Potential Customers
- 13. Research Methodology
List of Figures
- Figure 1: Global Advanced Carbon Products Industry Revenue Breakdown (Million, %) by Region 2025 & 2033
- Figure 2: Global Advanced Carbon Products Industry Volume Breakdown (K Tons, %) by Region 2025 & 2033
- Figure 3: Asia Pacific Advanced Carbon Products Industry Revenue (Million), by Product Type 2025 & 2033
- Figure 4: Asia Pacific Advanced Carbon Products Industry Volume (K Tons), by Product Type 2025 & 2033
- Figure 5: Asia Pacific Advanced Carbon Products Industry Revenue Share (%), by Product Type 2025 & 2033
- Figure 6: Asia Pacific Advanced Carbon Products Industry Volume Share (%), by Product Type 2025 & 2033
- Figure 7: Asia Pacific Advanced Carbon Products Industry Revenue (Million), by Application 2025 & 2033
- Figure 8: Asia Pacific Advanced Carbon Products Industry Volume (K Tons), by Application 2025 & 2033
- Figure 9: Asia Pacific Advanced Carbon Products Industry Revenue Share (%), by Application 2025 & 2033
- Figure 10: Asia Pacific Advanced Carbon Products Industry Volume Share (%), by Application 2025 & 2033
- Figure 11: Asia Pacific Advanced Carbon Products Industry Revenue (Million), by Country 2025 & 2033
- Figure 12: Asia Pacific Advanced Carbon Products Industry Volume (K Tons), by Country 2025 & 2033
- Figure 13: Asia Pacific Advanced Carbon Products Industry Revenue Share (%), by Country 2025 & 2033
- Figure 14: Asia Pacific Advanced Carbon Products Industry Volume Share (%), by Country 2025 & 2033
- Figure 15: North America Advanced Carbon Products Industry Revenue (Million), by Product Type 2025 & 2033
- Figure 16: North America Advanced Carbon Products Industry Volume (K Tons), by Product Type 2025 & 2033
- Figure 17: North America Advanced Carbon Products Industry Revenue Share (%), by Product Type 2025 & 2033
- Figure 18: North America Advanced Carbon Products Industry Volume Share (%), by Product Type 2025 & 2033
- Figure 19: North America Advanced Carbon Products Industry Revenue (Million), by Application 2025 & 2033
- Figure 20: North America Advanced Carbon Products Industry Volume (K Tons), by Application 2025 & 2033
- Figure 21: North America Advanced Carbon Products Industry Revenue Share (%), by Application 2025 & 2033
- Figure 22: North America Advanced Carbon Products Industry Volume Share (%), by Application 2025 & 2033
- Figure 23: North America Advanced Carbon Products Industry Revenue (Million), by Country 2025 & 2033
- Figure 24: North America Advanced Carbon Products Industry Volume (K Tons), by Country 2025 & 2033
- Figure 25: North America Advanced Carbon Products Industry Revenue Share (%), by Country 2025 & 2033
- Figure 26: North America Advanced Carbon Products Industry Volume Share (%), by Country 2025 & 2033
- Figure 27: Europe Advanced Carbon Products Industry Revenue (Million), by Product Type 2025 & 2033
- Figure 28: Europe Advanced Carbon Products Industry Volume (K Tons), by Product Type 2025 & 2033
- Figure 29: Europe Advanced Carbon Products Industry Revenue Share (%), by Product Type 2025 & 2033
- Figure 30: Europe Advanced Carbon Products Industry Volume Share (%), by Product Type 2025 & 2033
- Figure 31: Europe Advanced Carbon Products Industry Revenue (Million), by Application 2025 & 2033
- Figure 32: Europe Advanced Carbon Products Industry Volume (K Tons), by Application 2025 & 2033
- Figure 33: Europe Advanced Carbon Products Industry Revenue Share (%), by Application 2025 & 2033
- Figure 34: Europe Advanced Carbon Products Industry Volume Share (%), by Application 2025 & 2033
- Figure 35: Europe Advanced Carbon Products Industry Revenue (Million), by Country 2025 & 2033
- Figure 36: Europe Advanced Carbon Products Industry Volume (K Tons), by Country 2025 & 2033
- Figure 37: Europe Advanced Carbon Products Industry Revenue Share (%), by Country 2025 & 2033
- Figure 38: Europe Advanced Carbon Products Industry Volume Share (%), by Country 2025 & 2033
- Figure 39: South America Advanced Carbon Products Industry Revenue (Million), by Product Type 2025 & 2033
- Figure 40: South America Advanced Carbon Products Industry Volume (K Tons), by Product Type 2025 & 2033
- Figure 41: South America Advanced Carbon Products Industry Revenue Share (%), by Product Type 2025 & 2033
- Figure 42: South America Advanced Carbon Products Industry Volume Share (%), by Product Type 2025 & 2033
- Figure 43: South America Advanced Carbon Products Industry Revenue (Million), by Application 2025 & 2033
- Figure 44: South America Advanced Carbon Products Industry Volume (K Tons), by Application 2025 & 2033
- Figure 45: South America Advanced Carbon Products Industry Revenue Share (%), by Application 2025 & 2033
- Figure 46: South America Advanced Carbon Products Industry Volume Share (%), by Application 2025 & 2033
- Figure 47: South America Advanced Carbon Products Industry Revenue (Million), by Country 2025 & 2033
- Figure 48: South America Advanced Carbon Products Industry Volume (K Tons), by Country 2025 & 2033
- Figure 49: South America Advanced Carbon Products Industry Revenue Share (%), by Country 2025 & 2033
- Figure 50: South America Advanced Carbon Products Industry Volume Share (%), by Country 2025 & 2033
- Figure 51: Middle East and Africa Advanced Carbon Products Industry Revenue (Million), by Product Type 2025 & 2033
- Figure 52: Middle East and Africa Advanced Carbon Products Industry Volume (K Tons), by Product Type 2025 & 2033
- Figure 53: Middle East and Africa Advanced Carbon Products Industry Revenue Share (%), by Product Type 2025 & 2033
- Figure 54: Middle East and Africa Advanced Carbon Products Industry Volume Share (%), by Product Type 2025 & 2033
- Figure 55: Middle East and Africa Advanced Carbon Products Industry Revenue (Million), by Application 2025 & 2033
- Figure 56: Middle East and Africa Advanced Carbon Products Industry Volume (K Tons), by Application 2025 & 2033
- Figure 57: Middle East and Africa Advanced Carbon Products Industry Revenue Share (%), by Application 2025 & 2033
- Figure 58: Middle East and Africa Advanced Carbon Products Industry Volume Share (%), by Application 2025 & 2033
- Figure 59: Middle East and Africa Advanced Carbon Products Industry Revenue (Million), by Country 2025 & 2033
- Figure 60: Middle East and Africa Advanced Carbon Products Industry Volume (K Tons), by Country 2025 & 2033
- Figure 61: Middle East and Africa Advanced Carbon Products Industry Revenue Share (%), by Country 2025 & 2033
- Figure 62: Middle East and Africa Advanced Carbon Products Industry Volume Share (%), by Country 2025 & 2033
List of Tables
- Table 1: Global Advanced Carbon Products Industry Revenue Million Forecast, by Product Type 2020 & 2033
- Table 2: Global Advanced Carbon Products Industry Volume K Tons Forecast, by Product Type 2020 & 2033
- Table 3: Global Advanced Carbon Products Industry Revenue Million Forecast, by Application 2020 & 2033
- Table 4: Global Advanced Carbon Products Industry Volume K Tons Forecast, by Application 2020 & 2033
- Table 5: Global Advanced Carbon Products Industry Revenue Million Forecast, by Region 2020 & 2033
- Table 6: Global Advanced Carbon Products Industry Volume K Tons Forecast, by Region 2020 & 2033
- Table 7: Global Advanced Carbon Products Industry Revenue Million Forecast, by Product Type 2020 & 2033
- Table 8: Global Advanced Carbon Products Industry Volume K Tons Forecast, by Product Type 2020 & 2033
- Table 9: Global Advanced Carbon Products Industry Revenue Million Forecast, by Application 2020 & 2033
- Table 10: Global Advanced Carbon Products Industry Volume K Tons Forecast, by Application 2020 & 2033
- Table 11: Global Advanced Carbon Products Industry Revenue Million Forecast, by Country 2020 & 2033
- Table 12: Global Advanced Carbon Products Industry Volume K Tons Forecast, by Country 2020 & 2033
- Table 13: China Advanced Carbon Products Industry Revenue (Million) Forecast, by Application 2020 & 2033
- Table 14: China Advanced Carbon Products Industry Volume (K Tons) Forecast, by Application 2020 & 2033
- Table 15: India Advanced Carbon Products Industry Revenue (Million) Forecast, by Application 2020 & 2033
- Table 16: India Advanced Carbon Products Industry Volume (K Tons) Forecast, by Application 2020 & 2033
- Table 17: Japan Advanced Carbon Products Industry Revenue (Million) Forecast, by Application 2020 & 2033
- Table 18: Japan Advanced Carbon Products Industry Volume (K Tons) Forecast, by Application 2020 & 2033
- Table 19: South Korea Advanced Carbon Products Industry Revenue (Million) Forecast, by Application 2020 & 2033
- Table 20: South Korea Advanced Carbon Products Industry Volume (K Tons) Forecast, by Application 2020 & 2033
- Table 21: Rest of Asia Pacific Advanced Carbon Products Industry Revenue (Million) Forecast, by Application 2020 & 2033
- Table 22: Rest of Asia Pacific Advanced Carbon Products Industry Volume (K Tons) Forecast, by Application 2020 & 2033
- Table 23: Global Advanced Carbon Products Industry Revenue Million Forecast, by Product Type 2020 & 2033
- Table 24: Global Advanced Carbon Products Industry Volume K Tons Forecast, by Product Type 2020 & 2033
- Table 25: Global Advanced Carbon Products Industry Revenue Million Forecast, by Application 2020 & 2033
- Table 26: Global Advanced Carbon Products Industry Volume K Tons Forecast, by Application 2020 & 2033
- Table 27: Global Advanced Carbon Products Industry Revenue Million Forecast, by Country 2020 & 2033
- Table 28: Global Advanced Carbon Products Industry Volume K Tons Forecast, by Country 2020 & 2033
- Table 29: United States Advanced Carbon Products Industry Revenue (Million) Forecast, by Application 2020 & 2033
- Table 30: United States Advanced Carbon Products Industry Volume (K Tons) Forecast, by Application 2020 & 2033
- Table 31: Canada Advanced Carbon Products Industry Revenue (Million) Forecast, by Application 2020 & 2033
- Table 32: Canada Advanced Carbon Products Industry Volume (K Tons) Forecast, by Application 2020 & 2033
- Table 33: Mexico Advanced Carbon Products Industry Revenue (Million) Forecast, by Application 2020 & 2033
- Table 34: Mexico Advanced Carbon Products Industry Volume (K Tons) Forecast, by Application 2020 & 2033
- Table 35: Global Advanced Carbon Products Industry Revenue Million Forecast, by Product Type 2020 & 2033
- Table 36: Global Advanced Carbon Products Industry Volume K Tons Forecast, by Product Type 2020 & 2033
- Table 37: Global Advanced Carbon Products Industry Revenue Million Forecast, by Application 2020 & 2033
- Table 38: Global Advanced Carbon Products Industry Volume K Tons Forecast, by Application 2020 & 2033
- Table 39: Global Advanced Carbon Products Industry Revenue Million Forecast, by Country 2020 & 2033
- Table 40: Global Advanced Carbon Products Industry Volume K Tons Forecast, by Country 2020 & 2033
- Table 41: Germany Advanced Carbon Products Industry Revenue (Million) Forecast, by Application 2020 & 2033
- Table 42: Germany Advanced Carbon Products Industry Volume (K Tons) Forecast, by Application 2020 & 2033
- Table 43: United Kingdom Advanced Carbon Products Industry Revenue (Million) Forecast, by Application 2020 & 2033
- Table 44: United Kingdom Advanced Carbon Products Industry Volume (K Tons) Forecast, by Application 2020 & 2033
- Table 45: France Advanced Carbon Products Industry Revenue (Million) Forecast, by Application 2020 & 2033
- Table 46: France Advanced Carbon Products Industry Volume (K Tons) Forecast, by Application 2020 & 2033
- Table 47: Italy Advanced Carbon Products Industry Revenue (Million) Forecast, by Application 2020 & 2033
- Table 48: Italy Advanced Carbon Products Industry Volume (K Tons) Forecast, by Application 2020 & 2033
- Table 49: Spain Advanced Carbon Products Industry Revenue (Million) Forecast, by Application 2020 & 2033
- Table 50: Spain Advanced Carbon Products Industry Volume (K Tons) Forecast, by Application 2020 & 2033
- Table 51: Russia Advanced Carbon Products Industry Revenue (Million) Forecast, by Application 2020 & 2033
- Table 52: Russia Advanced Carbon Products Industry Volume (K Tons) Forecast, by Application 2020 & 2033
- Table 53: Rest of Europe Advanced Carbon Products Industry Revenue (Million) Forecast, by Application 2020 & 2033
- Table 54: Rest of Europe Advanced Carbon Products Industry Volume (K Tons) Forecast, by Application 2020 & 2033
- Table 55: Global Advanced Carbon Products Industry Revenue Million Forecast, by Product Type 2020 & 2033
- Table 56: Global Advanced Carbon Products Industry Volume K Tons Forecast, by Product Type 2020 & 2033
- Table 57: Global Advanced Carbon Products Industry Revenue Million Forecast, by Application 2020 & 2033
- Table 58: Global Advanced Carbon Products Industry Volume K Tons Forecast, by Application 2020 & 2033
- Table 59: Global Advanced Carbon Products Industry Revenue Million Forecast, by Country 2020 & 2033
- Table 60: Global Advanced Carbon Products Industry Volume K Tons Forecast, by Country 2020 & 2033
- Table 61: Brazil Advanced Carbon Products Industry Revenue (Million) Forecast, by Application 2020 & 2033
- Table 62: Brazil Advanced Carbon Products Industry Volume (K Tons) Forecast, by Application 2020 & 2033
- Table 63: Argentina Advanced Carbon Products Industry Revenue (Million) Forecast, by Application 2020 & 2033
- Table 64: Argentina Advanced Carbon Products Industry Volume (K Tons) Forecast, by Application 2020 & 2033
- Table 65: Rest of South America Advanced Carbon Products Industry Revenue (Million) Forecast, by Application 2020 & 2033
- Table 66: Rest of South America Advanced Carbon Products Industry Volume (K Tons) Forecast, by Application 2020 & 2033
- Table 67: Global Advanced Carbon Products Industry Revenue Million Forecast, by Product Type 2020 & 2033
- Table 68: Global Advanced Carbon Products Industry Volume K Tons Forecast, by Product Type 2020 & 2033
- Table 69: Global Advanced Carbon Products Industry Revenue Million Forecast, by Application 2020 & 2033
- Table 70: Global Advanced Carbon Products Industry Volume K Tons Forecast, by Application 2020 & 2033
- Table 71: Global Advanced Carbon Products Industry Revenue Million Forecast, by Country 2020 & 2033
- Table 72: Global Advanced Carbon Products Industry Volume K Tons Forecast, by Country 2020 & 2033
- Table 73: Saudi Arabia Advanced Carbon Products Industry Revenue (Million) Forecast, by Application 2020 & 2033
- Table 74: Saudi Arabia Advanced Carbon Products Industry Volume (K Tons) Forecast, by Application 2020 & 2033
- Table 75: United Arab Emirates Advanced Carbon Products Industry Revenue (Million) Forecast, by Application 2020 & 2033
- Table 76: United Arab Emirates Advanced Carbon Products Industry Volume (K Tons) Forecast, by Application 2020 & 2033
- Table 77: South Africa Advanced Carbon Products Industry Revenue (Million) Forecast, by Application 2020 & 2033
- Table 78: South Africa Advanced Carbon Products Industry Volume (K Tons) Forecast, by Application 2020 & 2033
- Table 79: Rest of Middle East and Africa Advanced Carbon Products Industry Revenue (Million) Forecast, by Application 2020 & 2033
- Table 80: Rest of Middle East and Africa Advanced Carbon Products Industry Volume (K Tons) Forecast, by Application 2020 & 2033
Frequently Asked Questions
1. What is the projected Compound Annual Growth Rate (CAGR) of the Advanced Carbon Products Industry?
The projected CAGR is approximately 9.82%.
2. Which companies are prominent players in the Advanced Carbon Products Industry?
Key companies in the market include SGL Carbon, Jiangsu Cnano Technology Co Ltd, Haydale Graphene Industries plc, Arkema, Tokai Carbon Co Ltd, Solvay, Antolin, POCO, Perpetuus Advanced Materials PLC, FutureCarbon GmbH, Shenzhen Sanshun Nano New Materials Co Ltd, GrafTech International, Nanocyl SA, Grupo Graphenano, Graphenea Inc, Arry International Group Limited, Ningbo Morsh Technology, Hyperion Catalysis International, XG Sciences Inc , The Sixth Element (Changzhou) Materials Technology Co Ltd, Nano-C, Nippon Graphite Fiber Co Ltd, Global Graphene Group, Toyo Tanso Co Ltd, CFOAM LLC, TORAY INDUSTRIES INC, Mitsubishi Chemical Carbon Fiber and Composites Inc, Thomas Swan & Co Ltd, Hexcel Corporation, Formosa Plastics Corporation, TEIJIN LIMITED, Graphite India Limited, SHOWA DENKO K K.
3. What are the main segments of the Advanced Carbon Products Industry?
The market segments include Product Type, Application.
4. Can you provide details about the market size?
The market size is estimated to be USD XX Million as of 2022.
5. What are some drivers contributing to market growth?
Rising Demand for Carbon Fiber Reinforced Plastic in the Construction Industry; Technological Advancements in Carbon Nanotubes; Other Drivers.
6. What are the notable trends driving market growth?
Aerospace and Defense to Dominate the Market.
7. Are there any restraints impacting market growth?
High-cost of Carbon Fiber Composites; Wastage in the Production of Finished Products; Other Restraints.
8. Can you provide examples of recent developments in the market?
N/A
9. What pricing options are available for accessing the report?
Pricing options include single-user, multi-user, and enterprise licenses priced at USD 4750, USD 5250, and USD 8750 respectively.
10. Is the market size provided in terms of value or volume?
The market size is provided in terms of value, measured in Million and volume, measured in K Tons.
11. Are there any specific market keywords associated with the report?
Yes, the market keyword associated with the report is "Advanced Carbon Products Industry," which aids in identifying and referencing the specific market segment covered.
12. How do I determine which pricing option suits my needs best?
The pricing options vary based on user requirements and access needs. Individual users may opt for single-user licenses, while businesses requiring broader access may choose multi-user or enterprise licenses for cost-effective access to the report.
13. Are there any additional resources or data provided in the Advanced Carbon Products Industry report?
While the report offers comprehensive insights, it's advisable to review the specific contents or supplementary materials provided to ascertain if additional resources or data are available.
14. How can I stay updated on further developments or reports in the Advanced Carbon Products Industry?
To stay informed about further developments, trends, and reports in the Advanced Carbon Products Industry, consider subscribing to industry newsletters, following relevant companies and organizations, or regularly checking reputable industry news sources and publications.
Methodology
Step 1 - Identification of Relevant Samples Size from Population Database


Step 2 - Approaches for Defining Global Market Size (Value, Volume* & Price*)

Note*: In applicable scenarios
Step 3 - Data Sources
Primary Research
- Web Analytics
- Survey Reports
- Research Institute
- Latest Research Reports
- Opinion Leaders
Secondary Research
- Annual Reports
- White Paper
- Latest Press Release
- Industry Association
- Paid Database
- Investor Presentations

Step 4 - Data Triangulation
Involves using different sources of information in order to increase the validity of a study
These sources are likely to be stakeholders in a program - participants, other researchers, program staff, other community members, and so on.
Then we put all data in single framework & apply various statistical tools to find out the dynamic on the market.
During the analysis stage, feedback from the stakeholder groups would be compared to determine areas of agreement as well as areas of divergence