

Key Insights
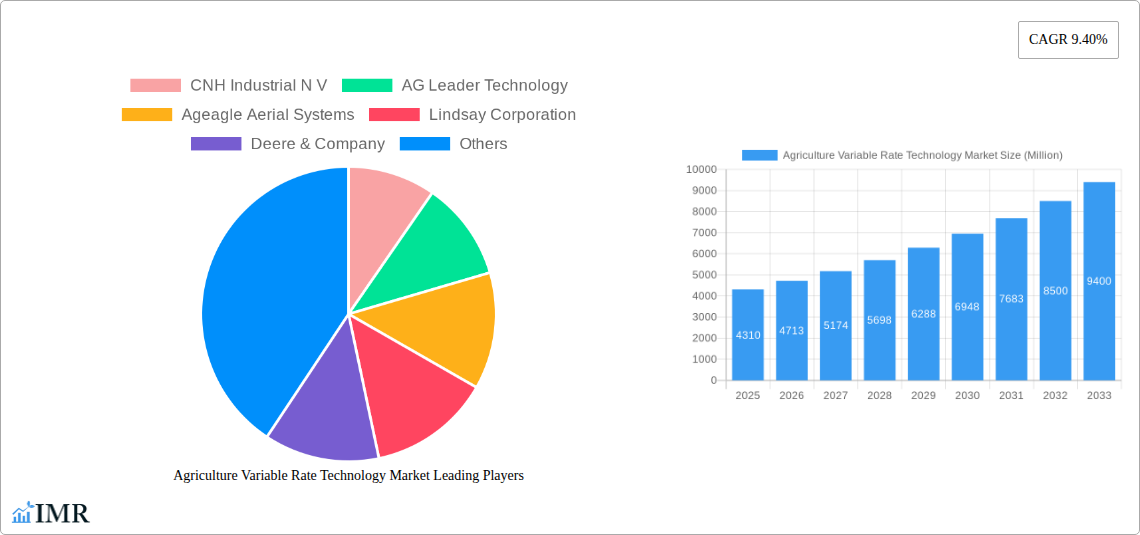
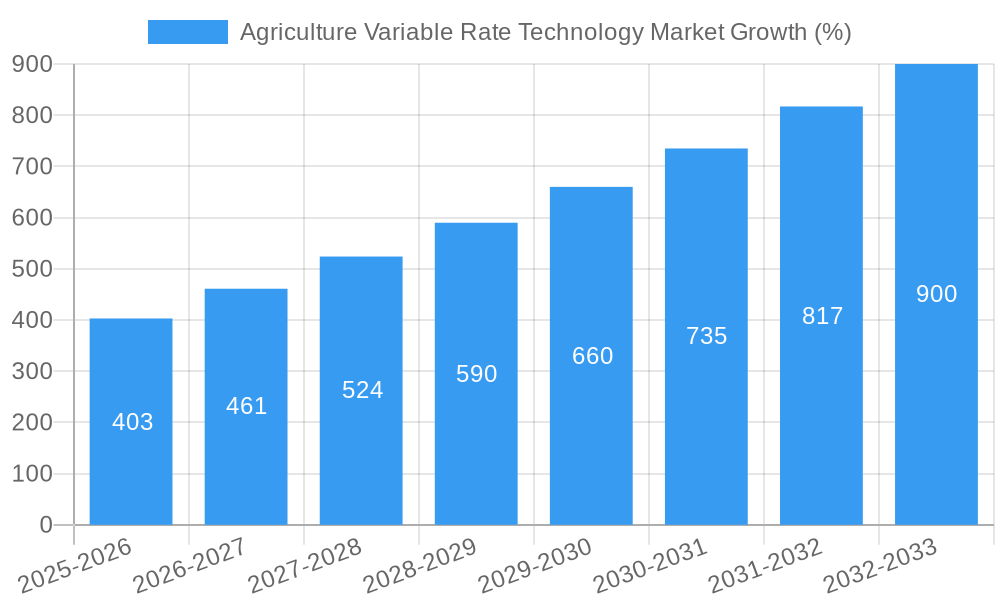
The Agriculture Variable Rate Technology (VRT) market, valued at $4.31 billion in 2025, is experiencing robust growth, projected to expand at a Compound Annual Growth Rate (CAGR) of 9.40% from 2025 to 2033. This expansion is driven by several key factors. Firstly, the increasing need for precision agriculture practices to optimize resource utilization (water, fertilizer, pesticides) and maximize crop yields in the face of climate change and growing global food demand is a significant catalyst. Secondly, technological advancements in sensor technology, GPS, data analytics, and automation are making VRT solutions more efficient, affordable, and accessible to farmers of all scales. The integration of IoT devices and cloud-based data management platforms further enhances the precision and effectiveness of these technologies, leading to improved farm management and decision-making. Finally, supportive government policies and initiatives promoting sustainable agriculture practices in various regions are creating a favorable environment for market growth.
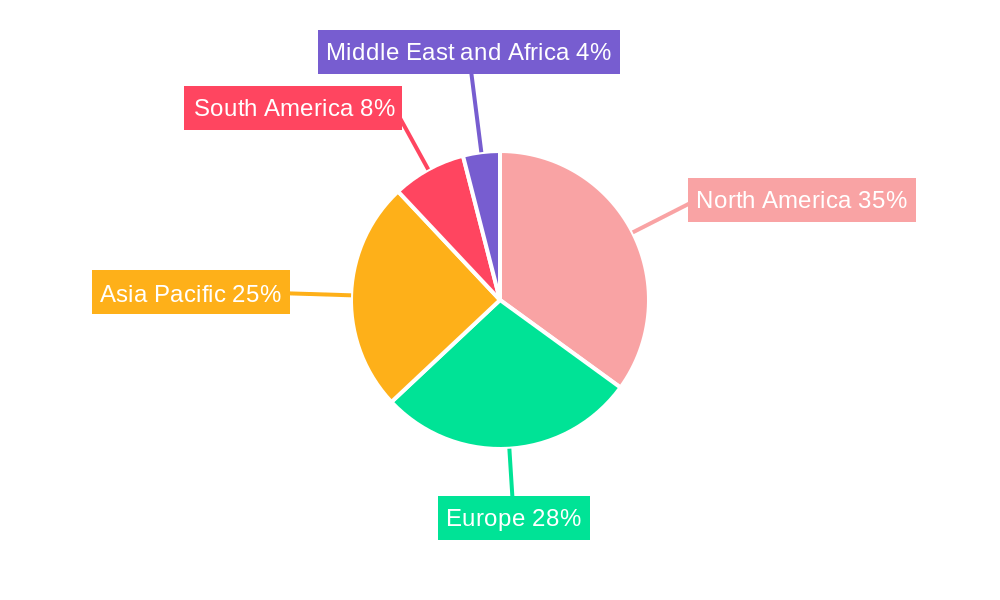
The market segmentation reveals significant opportunities across various crop types and applications. Cereals & grains, fruits & vegetables, and oilseeds & pulses are major contributors, reflecting the widespread adoption of VRT across diverse agricultural sectors. In terms of applications, fertilizers, crop protection chemicals, and soil sensing are currently leading segments. However, increasing adoption of yield monitoring, irrigation optimization, and other advanced VRT applications is expected to fuel future growth. Geographically, North America and Europe currently hold a substantial market share, driven by high technology adoption rates and established agricultural practices. However, the Asia-Pacific region is poised for rapid growth due to increasing agricultural activities, rising farmer awareness, and supportive government initiatives. Competition is intense, with major players like CNH Industrial N.V., Deere & Company, Trimble Inc., and others actively investing in R&D and strategic partnerships to maintain their market positions and capture emerging opportunities. The forecast period (2025-2033) suggests significant expansion driven by continued technological innovation and increasing adoption across different geographical markets and farming operations.
This comprehensive report provides a detailed analysis of the Agriculture Variable Rate Technology Market, encompassing market dynamics, growth trends, regional analysis, product landscape, key players, and future outlook. The study period spans from 2019 to 2033, with 2025 serving as the base and estimated year. The report meticulously segments the market by crop type (Cereals & Grains, Fruits & Vegetables, Oilseeds & Pulses, Commercial Crops) and application (Fertilizers, Crop Protection Chemicals, Soil Sensing, Yield Monitoring, Irrigation, Others), offering granular insights into this dynamic sector. Key players like CNH Industrial N V, AG Leader Technology, Ageagle Aerial Systems, Lindsay Corporation, Deere & Company, Trimble Inc, Topcon Corporation, Valmont Industries Inc, Raven Industries Inc, and AGCO Corporation are profiled, providing a thorough understanding of the competitive landscape. The market is projected to reach xx Million by 2033.
Agriculture Variable Rate Technology Market Market Dynamics & Structure
The Agriculture Variable Rate Technology market is characterized by moderate concentration, with several key players holding significant market share. Technological innovation, driven by advancements in sensors, GPS, and data analytics, is a major growth driver. Stringent environmental regulations and the increasing demand for sustainable agricultural practices are also shaping market dynamics. Competitive pressures are evident through the introduction of substitute technologies and the ongoing mergers and acquisitions (M&A) activity within the sector. End-user demographics, particularly the growing adoption of precision farming techniques by large-scale commercial farms, significantly influence market growth.
- Market Concentration: Moderately concentrated, with the top 5 players holding approximately xx% market share in 2025.
- Technological Innovation: Significant advancements in sensor technology, AI, and data analytics are driving innovation. Challenges include interoperability issues and high initial investment costs.
- Regulatory Framework: Environmental regulations and data privacy concerns are influencing technology adoption and market growth.
- Competitive Substitutes: Traditional farming methods and less sophisticated precision agriculture technologies pose a competitive threat.
- M&A Trends: A moderate level of M&A activity is observed, driven by the consolidation of market share and expansion into new technologies. An estimated xx M&A deals were closed between 2019 and 2024.
- End-User Demographics: Large-scale commercial farms are the primary adopters, with smallholder farmers facing adoption barriers.
Agriculture Variable Rate Technology Market Growth Trends & Insights
The Agriculture Variable Rate Technology market experienced robust growth during the historical period (2019-2024), driven by factors such as increasing awareness of precision agriculture, rising food demand, and technological advancements. The market is projected to maintain a strong growth trajectory during the forecast period (2025-2033). The adoption rate is increasing steadily, particularly in developed regions, and technological disruptions continue to reshape the market landscape. Consumer behavior is shifting towards data-driven decision-making and sustainable agricultural practices. The market size is expected to reach xx Million by 2033, exhibiting a CAGR of xx% during the forecast period. Market penetration is anticipated to increase from xx% in 2025 to xx% by 2033.
Dominant Regions, Countries, or Segments in Agriculture Variable Rate Technology Market
North America currently dominates the Agriculture Variable Rate Technology market, followed by Europe. High adoption rates in developed economies, supportive government policies, and advanced agricultural infrastructure contribute to this dominance. Within crop types, Cereals & Grains and Oilseeds & Pulses represent the largest segments, driven by high production volumes and the significant benefits of variable rate technology in optimizing resource utilization. In terms of applications, Fertilizer application and Irrigation are major drivers due to their impact on yield and water efficiency.
- Key Drivers in North America: Strong government support for precision agriculture, high adoption rates by large farms, and well-developed infrastructure.
- Key Drivers in Europe: Growing emphasis on sustainable agriculture, stringent environmental regulations, and the availability of advanced technologies.
- Cereals & Grains Segment: High production volumes and significant potential for yield enhancement through optimized fertilizer and irrigation management.
- Fertilizer Application Segment: Significant cost savings and yield improvements through precise fertilizer application.
- Irrigation Segment: Improved water use efficiency and reduced water stress in crops.
Agriculture Variable Rate Technology Market Product Landscape
The market offers a diverse range of products, including variable rate technology for fertilizer application, crop protection chemicals, soil sensing, yield monitoring, and irrigation. Product innovations are focused on improving accuracy, efficiency, and data integration. Technological advancements include the incorporation of AI and machine learning algorithms to enhance decision-making capabilities. Unique selling propositions revolve around enhanced precision, improved resource optimization, and increased sustainability. Performance metrics are primarily centered around yield improvement, cost reduction, and environmental impact minimization.
Key Drivers, Barriers & Challenges in Agriculture Variable Rate Technology Market
Key Drivers:
- Increasing demand for food production efficiency and sustainability.
- Technological advancements in sensors, GPS, and data analytics.
- Government incentives and support for precision agriculture adoption.
Key Challenges:
- High initial investment costs limiting adoption by smallholder farmers.
- Interoperability issues among different systems and data platforms.
- Data security and privacy concerns regarding farm data management.
- xx% of farmers cite high implementation costs as a major obstacle to adoption.
Emerging Opportunities in Agriculture Variable Rate Technology Market
Emerging opportunities include expansion into developing markets, integration with other precision agriculture technologies (e.g., drones, robotics), and the development of data-driven services and insights for farmers. The increasing adoption of AI and machine learning to optimize variable rate applications is a key opportunity. The development of user-friendly interfaces and mobile applications to make technology more accessible to smallholder farmers is also promising.
Growth Accelerators in the Agriculture Variable Rate Technology Market Industry
Technological breakthroughs in sensor technology, data analytics, and automation are major growth catalysts. Strategic partnerships between technology providers and agricultural companies are expanding market reach and accelerating adoption. Government initiatives promoting sustainable agriculture and precision farming practices are also driving growth. Market expansion into developing economies presents significant opportunities for future growth.
Key Players Shaping the Agriculture Variable Rate Technology Market Market
- CNH Industrial N V
- AG Leader Technology
- Ageagle Aerial Systems
- Lindsay Corporation
- Deere & Company
- Trimble Inc
- Topcon Corporation
- Valmont Industries Inc
- Raven Industries Inc
- AGCO Corporation
Notable Milestones in Agriculture Variable Rate Technology Market Sector
- 2020: Launch of AI-powered soil sensing technology by Deere & Company.
- 2021: Acquisition of a precision agriculture technology company by Trimble Inc.
- 2022: Introduction of a new variable rate irrigation system by Lindsay Corporation.
- 2023: Partnership between AGCO Corporation and a data analytics firm to improve farm management solutions.
- 2024: Regulatory approval for a new generation of variable-rate fertilizer application technology.
In-Depth Agriculture Variable Rate Technology Market Market Outlook
The Agriculture Variable Rate Technology market is poised for sustained growth, driven by technological advancements, increasing awareness of precision agriculture, and supportive government policies. Strategic partnerships, market expansion into developing economies, and the development of innovative applications will further fuel market expansion. The market presents significant opportunities for technology providers and agricultural companies to leverage data-driven insights and improve operational efficiency. The focus on sustainable agriculture will further drive demand for precision technologies in the coming years.
Agriculture Variable Rate Technology Market Segmentation
-
1. Crop Type
- 1.1. Cereals & Grains
- 1.2. Fruits and Vegetables
- 1.3. Oilseeds & Pulses
- 1.4. Commercial Crops
-
2. Application
- 2.1. Fertilizers
- 2.2. Crop Protection Chemicals
- 2.3. Soil Sensing
- 2.4. Yield Monitoring
- 2.5. Irrigation
- 2.6. Others
Agriculture Variable Rate Technology Market Segmentation By Geography
-
1. North America
- 1.1. United States
- 1.2. Canada
- 1.3. Mexico
-
2. South America
- 2.1. Brazil
- 2.2. Argentina
- 2.3. Rest of South America
-
3. Europe
- 3.1. United Kingdom
- 3.2. Germany
- 3.3. France
- 3.4. Italy
- 3.5. Spain
- 3.6. Russia
- 3.7. Benelux
- 3.8. Nordics
- 3.9. Rest of Europe
-
4. Middle East & Africa
- 4.1. Turkey
- 4.2. Israel
- 4.3. GCC
- 4.4. North Africa
- 4.5. South Africa
- 4.6. Rest of Middle East & Africa
-
5. Asia Pacific
- 5.1. China
- 5.2. India
- 5.3. Japan
- 5.4. South Korea
- 5.5. ASEAN
- 5.6. Oceania
- 5.7. Rest of Asia Pacific
Agriculture Variable Rate Technology Market REPORT HIGHLIGHTS
| Aspects | Details |
|---|---|
| Study Period | 2019-2033 |
| Base Year | 2024 |
| Estimated Year | 2025 |
| Forecast Period | 2025-2033 |
| Historical Period | 2019-2024 |
| Growth Rate | CAGR of 9.40% from 2019-2033 |
| Segmentation |
|
Table of Contents
- 1. Introduction
- 1.1. Research Scope
- 1.2. Market Segmentation
- 1.3. Research Methodology
- 1.4. Definitions and Assumptions
- 2. Executive Summary
- 2.1. Introduction
- 3. Market Dynamics
- 3.1. Introduction
- 3.2. Market Drivers
- 3.2.1. Low Availability of Skilled Labor; Technological Advancements
- 3.3. Market Restrains
- 3.3.1. Increasing Farm Expenditure; Security Concerns in Modern Farming Machinery
- 3.4. Market Trends
- 3.4.1. Increasing Adoption of Digital Technologies in the Agricultural Sector
- 4. Market Factor Analysis
- 4.1. Porters Five Forces
- 4.2. Supply/Value Chain
- 4.3. PESTEL analysis
- 4.4. Market Entropy
- 4.5. Patent/Trademark Analysis
- 5. Global Agriculture Variable Rate Technology Market Analysis, Insights and Forecast, 2019-2031
- 5.1. Market Analysis, Insights and Forecast - by Crop Type
- 5.1.1. Cereals & Grains
- 5.1.2. Fruits and Vegetables
- 5.1.3. Oilseeds & Pulses
- 5.1.4. Commercial Crops
- 5.2. Market Analysis, Insights and Forecast - by Application
- 5.2.1. Fertilizers
- 5.2.2. Crop Protection Chemicals
- 5.2.3. Soil Sensing
- 5.2.4. Yield Monitoring
- 5.2.5. Irrigation
- 5.2.6. Others
- 5.3. Market Analysis, Insights and Forecast - by Region
- 5.3.1. North America
- 5.3.2. South America
- 5.3.3. Europe
- 5.3.4. Middle East & Africa
- 5.3.5. Asia Pacific
- 5.1. Market Analysis, Insights and Forecast - by Crop Type
- 6. North America Agriculture Variable Rate Technology Market Analysis, Insights and Forecast, 2019-2031
- 6.1. Market Analysis, Insights and Forecast - by Crop Type
- 6.1.1. Cereals & Grains
- 6.1.2. Fruits and Vegetables
- 6.1.3. Oilseeds & Pulses
- 6.1.4. Commercial Crops
- 6.2. Market Analysis, Insights and Forecast - by Application
- 6.2.1. Fertilizers
- 6.2.2. Crop Protection Chemicals
- 6.2.3. Soil Sensing
- 6.2.4. Yield Monitoring
- 6.2.5. Irrigation
- 6.2.6. Others
- 6.1. Market Analysis, Insights and Forecast - by Crop Type
- 7. South America Agriculture Variable Rate Technology Market Analysis, Insights and Forecast, 2019-2031
- 7.1. Market Analysis, Insights and Forecast - by Crop Type
- 7.1.1. Cereals & Grains
- 7.1.2. Fruits and Vegetables
- 7.1.3. Oilseeds & Pulses
- 7.1.4. Commercial Crops
- 7.2. Market Analysis, Insights and Forecast - by Application
- 7.2.1. Fertilizers
- 7.2.2. Crop Protection Chemicals
- 7.2.3. Soil Sensing
- 7.2.4. Yield Monitoring
- 7.2.5. Irrigation
- 7.2.6. Others
- 7.1. Market Analysis, Insights and Forecast - by Crop Type
- 8. Europe Agriculture Variable Rate Technology Market Analysis, Insights and Forecast, 2019-2031
- 8.1. Market Analysis, Insights and Forecast - by Crop Type
- 8.1.1. Cereals & Grains
- 8.1.2. Fruits and Vegetables
- 8.1.3. Oilseeds & Pulses
- 8.1.4. Commercial Crops
- 8.2. Market Analysis, Insights and Forecast - by Application
- 8.2.1. Fertilizers
- 8.2.2. Crop Protection Chemicals
- 8.2.3. Soil Sensing
- 8.2.4. Yield Monitoring
- 8.2.5. Irrigation
- 8.2.6. Others
- 8.1. Market Analysis, Insights and Forecast - by Crop Type
- 9. Middle East & Africa Agriculture Variable Rate Technology Market Analysis, Insights and Forecast, 2019-2031
- 9.1. Market Analysis, Insights and Forecast - by Crop Type
- 9.1.1. Cereals & Grains
- 9.1.2. Fruits and Vegetables
- 9.1.3. Oilseeds & Pulses
- 9.1.4. Commercial Crops
- 9.2. Market Analysis, Insights and Forecast - by Application
- 9.2.1. Fertilizers
- 9.2.2. Crop Protection Chemicals
- 9.2.3. Soil Sensing
- 9.2.4. Yield Monitoring
- 9.2.5. Irrigation
- 9.2.6. Others
- 9.1. Market Analysis, Insights and Forecast - by Crop Type
- 10. Asia Pacific Agriculture Variable Rate Technology Market Analysis, Insights and Forecast, 2019-2031
- 10.1. Market Analysis, Insights and Forecast - by Crop Type
- 10.1.1. Cereals & Grains
- 10.1.2. Fruits and Vegetables
- 10.1.3. Oilseeds & Pulses
- 10.1.4. Commercial Crops
- 10.2. Market Analysis, Insights and Forecast - by Application
- 10.2.1. Fertilizers
- 10.2.2. Crop Protection Chemicals
- 10.2.3. Soil Sensing
- 10.2.4. Yield Monitoring
- 10.2.5. Irrigation
- 10.2.6. Others
- 10.1. Market Analysis, Insights and Forecast - by Crop Type
- 11. North America Agriculture Variable Rate Technology Market Analysis, Insights and Forecast, 2019-2031
- 11.1. Market Analysis, Insights and Forecast - By Country/Sub-region
- 11.1.1 United States
- 11.1.2 Canada
- 11.1.3 Mexico
- 11.1.4 Rest of North America
- 12. Europe Agriculture Variable Rate Technology Market Analysis, Insights and Forecast, 2019-2031
- 12.1. Market Analysis, Insights and Forecast - By Country/Sub-region
- 12.1.1 Germany
- 12.1.2 United Kingdom
- 12.1.3 France
- 12.1.4 Italy
- 12.1.5 Spain
- 12.1.6 Rest of Europe
- 13. Asia Pacific Agriculture Variable Rate Technology Market Analysis, Insights and Forecast, 2019-2031
- 13.1. Market Analysis, Insights and Forecast - By Country/Sub-region
- 13.1.1 China
- 13.1.2 Japan
- 13.1.3 India
- 13.1.4 South Korea
- 13.1.5 Rest of Asia Pacific
- 14. South America Agriculture Variable Rate Technology Market Analysis, Insights and Forecast, 2019-2031
- 14.1. Market Analysis, Insights and Forecast - By Country/Sub-region
- 14.1.1 Brazil
- 14.1.2 Argentina
- 14.1.3 Rest of South America
- 15. Middle East and Africa Agriculture Variable Rate Technology Market Analysis, Insights and Forecast, 2019-2031
- 15.1. Market Analysis, Insights and Forecast - By Country/Sub-region
- 15.1.1 South Africa
- 15.1.2 Rest of Middle East and Africa
- 16. Competitive Analysis
- 16.1. Global Market Share Analysis 2024
- 16.2. Company Profiles
- 16.2.1 CNH Industrial N V
- 16.2.1.1. Overview
- 16.2.1.2. Products
- 16.2.1.3. SWOT Analysis
- 16.2.1.4. Recent Developments
- 16.2.1.5. Financials (Based on Availability)
- 16.2.2 AG Leader Technology
- 16.2.2.1. Overview
- 16.2.2.2. Products
- 16.2.2.3. SWOT Analysis
- 16.2.2.4. Recent Developments
- 16.2.2.5. Financials (Based on Availability)
- 16.2.3 Ageagle Aerial Systems
- 16.2.3.1. Overview
- 16.2.3.2. Products
- 16.2.3.3. SWOT Analysis
- 16.2.3.4. Recent Developments
- 16.2.3.5. Financials (Based on Availability)
- 16.2.4 Lindsay Corporation
- 16.2.4.1. Overview
- 16.2.4.2. Products
- 16.2.4.3. SWOT Analysis
- 16.2.4.4. Recent Developments
- 16.2.4.5. Financials (Based on Availability)
- 16.2.5 Deere & Company
- 16.2.5.1. Overview
- 16.2.5.2. Products
- 16.2.5.3. SWOT Analysis
- 16.2.5.4. Recent Developments
- 16.2.5.5. Financials (Based on Availability)
- 16.2.6 Trimble Inc
- 16.2.6.1. Overview
- 16.2.6.2. Products
- 16.2.6.3. SWOT Analysis
- 16.2.6.4. Recent Developments
- 16.2.6.5. Financials (Based on Availability)
- 16.2.7 Topcon Corporation
- 16.2.7.1. Overview
- 16.2.7.2. Products
- 16.2.7.3. SWOT Analysis
- 16.2.7.4. Recent Developments
- 16.2.7.5. Financials (Based on Availability)
- 16.2.8 Valmont Industries Inc
- 16.2.8.1. Overview
- 16.2.8.2. Products
- 16.2.8.3. SWOT Analysis
- 16.2.8.4. Recent Developments
- 16.2.8.5. Financials (Based on Availability)
- 16.2.9 Raven Industries Inc
- 16.2.9.1. Overview
- 16.2.9.2. Products
- 16.2.9.3. SWOT Analysis
- 16.2.9.4. Recent Developments
- 16.2.9.5. Financials (Based on Availability)
- 16.2.10 AGCO Corporation
- 16.2.10.1. Overview
- 16.2.10.2. Products
- 16.2.10.3. SWOT Analysis
- 16.2.10.4. Recent Developments
- 16.2.10.5. Financials (Based on Availability)
- 16.2.1 CNH Industrial N V
List of Figures
- Figure 1: Global Agriculture Variable Rate Technology Market Revenue Breakdown (Million, %) by Region 2024 & 2032
- Figure 2: North America Agriculture Variable Rate Technology Market Revenue (Million), by Country 2024 & 2032
- Figure 3: North America Agriculture Variable Rate Technology Market Revenue Share (%), by Country 2024 & 2032
- Figure 4: Europe Agriculture Variable Rate Technology Market Revenue (Million), by Country 2024 & 2032
- Figure 5: Europe Agriculture Variable Rate Technology Market Revenue Share (%), by Country 2024 & 2032
- Figure 6: Asia Pacific Agriculture Variable Rate Technology Market Revenue (Million), by Country 2024 & 2032
- Figure 7: Asia Pacific Agriculture Variable Rate Technology Market Revenue Share (%), by Country 2024 & 2032
- Figure 8: South America Agriculture Variable Rate Technology Market Revenue (Million), by Country 2024 & 2032
- Figure 9: South America Agriculture Variable Rate Technology Market Revenue Share (%), by Country 2024 & 2032
- Figure 10: Middle East and Africa Agriculture Variable Rate Technology Market Revenue (Million), by Country 2024 & 2032
- Figure 11: Middle East and Africa Agriculture Variable Rate Technology Market Revenue Share (%), by Country 2024 & 2032
- Figure 12: North America Agriculture Variable Rate Technology Market Revenue (Million), by Crop Type 2024 & 2032
- Figure 13: North America Agriculture Variable Rate Technology Market Revenue Share (%), by Crop Type 2024 & 2032
- Figure 14: North America Agriculture Variable Rate Technology Market Revenue (Million), by Application 2024 & 2032
- Figure 15: North America Agriculture Variable Rate Technology Market Revenue Share (%), by Application 2024 & 2032
- Figure 16: North America Agriculture Variable Rate Technology Market Revenue (Million), by Country 2024 & 2032
- Figure 17: North America Agriculture Variable Rate Technology Market Revenue Share (%), by Country 2024 & 2032
- Figure 18: South America Agriculture Variable Rate Technology Market Revenue (Million), by Crop Type 2024 & 2032
- Figure 19: South America Agriculture Variable Rate Technology Market Revenue Share (%), by Crop Type 2024 & 2032
- Figure 20: South America Agriculture Variable Rate Technology Market Revenue (Million), by Application 2024 & 2032
- Figure 21: South America Agriculture Variable Rate Technology Market Revenue Share (%), by Application 2024 & 2032
- Figure 22: South America Agriculture Variable Rate Technology Market Revenue (Million), by Country 2024 & 2032
- Figure 23: South America Agriculture Variable Rate Technology Market Revenue Share (%), by Country 2024 & 2032
- Figure 24: Europe Agriculture Variable Rate Technology Market Revenue (Million), by Crop Type 2024 & 2032
- Figure 25: Europe Agriculture Variable Rate Technology Market Revenue Share (%), by Crop Type 2024 & 2032
- Figure 26: Europe Agriculture Variable Rate Technology Market Revenue (Million), by Application 2024 & 2032
- Figure 27: Europe Agriculture Variable Rate Technology Market Revenue Share (%), by Application 2024 & 2032
- Figure 28: Europe Agriculture Variable Rate Technology Market Revenue (Million), by Country 2024 & 2032
- Figure 29: Europe Agriculture Variable Rate Technology Market Revenue Share (%), by Country 2024 & 2032
- Figure 30: Middle East & Africa Agriculture Variable Rate Technology Market Revenue (Million), by Crop Type 2024 & 2032
- Figure 31: Middle East & Africa Agriculture Variable Rate Technology Market Revenue Share (%), by Crop Type 2024 & 2032
- Figure 32: Middle East & Africa Agriculture Variable Rate Technology Market Revenue (Million), by Application 2024 & 2032
- Figure 33: Middle East & Africa Agriculture Variable Rate Technology Market Revenue Share (%), by Application 2024 & 2032
- Figure 34: Middle East & Africa Agriculture Variable Rate Technology Market Revenue (Million), by Country 2024 & 2032
- Figure 35: Middle East & Africa Agriculture Variable Rate Technology Market Revenue Share (%), by Country 2024 & 2032
- Figure 36: Asia Pacific Agriculture Variable Rate Technology Market Revenue (Million), by Crop Type 2024 & 2032
- Figure 37: Asia Pacific Agriculture Variable Rate Technology Market Revenue Share (%), by Crop Type 2024 & 2032
- Figure 38: Asia Pacific Agriculture Variable Rate Technology Market Revenue (Million), by Application 2024 & 2032
- Figure 39: Asia Pacific Agriculture Variable Rate Technology Market Revenue Share (%), by Application 2024 & 2032
- Figure 40: Asia Pacific Agriculture Variable Rate Technology Market Revenue (Million), by Country 2024 & 2032
- Figure 41: Asia Pacific Agriculture Variable Rate Technology Market Revenue Share (%), by Country 2024 & 2032
List of Tables
- Table 1: Global Agriculture Variable Rate Technology Market Revenue Million Forecast, by Region 2019 & 2032
- Table 2: Global Agriculture Variable Rate Technology Market Revenue Million Forecast, by Crop Type 2019 & 2032
- Table 3: Global Agriculture Variable Rate Technology Market Revenue Million Forecast, by Application 2019 & 2032
- Table 4: Global Agriculture Variable Rate Technology Market Revenue Million Forecast, by Region 2019 & 2032
- Table 5: Global Agriculture Variable Rate Technology Market Revenue Million Forecast, by Country 2019 & 2032
- Table 6: United States Agriculture Variable Rate Technology Market Revenue (Million) Forecast, by Application 2019 & 2032
- Table 7: Canada Agriculture Variable Rate Technology Market Revenue (Million) Forecast, by Application 2019 & 2032
- Table 8: Mexico Agriculture Variable Rate Technology Market Revenue (Million) Forecast, by Application 2019 & 2032
- Table 9: Rest of North America Agriculture Variable Rate Technology Market Revenue (Million) Forecast, by Application 2019 & 2032
- Table 10: Global Agriculture Variable Rate Technology Market Revenue Million Forecast, by Country 2019 & 2032
- Table 11: Germany Agriculture Variable Rate Technology Market Revenue (Million) Forecast, by Application 2019 & 2032
- Table 12: United Kingdom Agriculture Variable Rate Technology Market Revenue (Million) Forecast, by Application 2019 & 2032
- Table 13: France Agriculture Variable Rate Technology Market Revenue (Million) Forecast, by Application 2019 & 2032
- Table 14: Italy Agriculture Variable Rate Technology Market Revenue (Million) Forecast, by Application 2019 & 2032
- Table 15: Spain Agriculture Variable Rate Technology Market Revenue (Million) Forecast, by Application 2019 & 2032
- Table 16: Rest of Europe Agriculture Variable Rate Technology Market Revenue (Million) Forecast, by Application 2019 & 2032
- Table 17: Global Agriculture Variable Rate Technology Market Revenue Million Forecast, by Country 2019 & 2032
- Table 18: China Agriculture Variable Rate Technology Market Revenue (Million) Forecast, by Application 2019 & 2032
- Table 19: Japan Agriculture Variable Rate Technology Market Revenue (Million) Forecast, by Application 2019 & 2032
- Table 20: India Agriculture Variable Rate Technology Market Revenue (Million) Forecast, by Application 2019 & 2032
- Table 21: South Korea Agriculture Variable Rate Technology Market Revenue (Million) Forecast, by Application 2019 & 2032
- Table 22: Rest of Asia Pacific Agriculture Variable Rate Technology Market Revenue (Million) Forecast, by Application 2019 & 2032
- Table 23: Global Agriculture Variable Rate Technology Market Revenue Million Forecast, by Country 2019 & 2032
- Table 24: Brazil Agriculture Variable Rate Technology Market Revenue (Million) Forecast, by Application 2019 & 2032
- Table 25: Argentina Agriculture Variable Rate Technology Market Revenue (Million) Forecast, by Application 2019 & 2032
- Table 26: Rest of South America Agriculture Variable Rate Technology Market Revenue (Million) Forecast, by Application 2019 & 2032
- Table 27: Global Agriculture Variable Rate Technology Market Revenue Million Forecast, by Country 2019 & 2032
- Table 28: South Africa Agriculture Variable Rate Technology Market Revenue (Million) Forecast, by Application 2019 & 2032
- Table 29: Rest of Middle East and Africa Agriculture Variable Rate Technology Market Revenue (Million) Forecast, by Application 2019 & 2032
- Table 30: Global Agriculture Variable Rate Technology Market Revenue Million Forecast, by Crop Type 2019 & 2032
- Table 31: Global Agriculture Variable Rate Technology Market Revenue Million Forecast, by Application 2019 & 2032
- Table 32: Global Agriculture Variable Rate Technology Market Revenue Million Forecast, by Country 2019 & 2032
- Table 33: United States Agriculture Variable Rate Technology Market Revenue (Million) Forecast, by Application 2019 & 2032
- Table 34: Canada Agriculture Variable Rate Technology Market Revenue (Million) Forecast, by Application 2019 & 2032
- Table 35: Mexico Agriculture Variable Rate Technology Market Revenue (Million) Forecast, by Application 2019 & 2032
- Table 36: Global Agriculture Variable Rate Technology Market Revenue Million Forecast, by Crop Type 2019 & 2032
- Table 37: Global Agriculture Variable Rate Technology Market Revenue Million Forecast, by Application 2019 & 2032
- Table 38: Global Agriculture Variable Rate Technology Market Revenue Million Forecast, by Country 2019 & 2032
- Table 39: Brazil Agriculture Variable Rate Technology Market Revenue (Million) Forecast, by Application 2019 & 2032
- Table 40: Argentina Agriculture Variable Rate Technology Market Revenue (Million) Forecast, by Application 2019 & 2032
- Table 41: Rest of South America Agriculture Variable Rate Technology Market Revenue (Million) Forecast, by Application 2019 & 2032
- Table 42: Global Agriculture Variable Rate Technology Market Revenue Million Forecast, by Crop Type 2019 & 2032
- Table 43: Global Agriculture Variable Rate Technology Market Revenue Million Forecast, by Application 2019 & 2032
- Table 44: Global Agriculture Variable Rate Technology Market Revenue Million Forecast, by Country 2019 & 2032
- Table 45: United Kingdom Agriculture Variable Rate Technology Market Revenue (Million) Forecast, by Application 2019 & 2032
- Table 46: Germany Agriculture Variable Rate Technology Market Revenue (Million) Forecast, by Application 2019 & 2032
- Table 47: France Agriculture Variable Rate Technology Market Revenue (Million) Forecast, by Application 2019 & 2032
- Table 48: Italy Agriculture Variable Rate Technology Market Revenue (Million) Forecast, by Application 2019 & 2032
- Table 49: Spain Agriculture Variable Rate Technology Market Revenue (Million) Forecast, by Application 2019 & 2032
- Table 50: Russia Agriculture Variable Rate Technology Market Revenue (Million) Forecast, by Application 2019 & 2032
- Table 51: Benelux Agriculture Variable Rate Technology Market Revenue (Million) Forecast, by Application 2019 & 2032
- Table 52: Nordics Agriculture Variable Rate Technology Market Revenue (Million) Forecast, by Application 2019 & 2032
- Table 53: Rest of Europe Agriculture Variable Rate Technology Market Revenue (Million) Forecast, by Application 2019 & 2032
- Table 54: Global Agriculture Variable Rate Technology Market Revenue Million Forecast, by Crop Type 2019 & 2032
- Table 55: Global Agriculture Variable Rate Technology Market Revenue Million Forecast, by Application 2019 & 2032
- Table 56: Global Agriculture Variable Rate Technology Market Revenue Million Forecast, by Country 2019 & 2032
- Table 57: Turkey Agriculture Variable Rate Technology Market Revenue (Million) Forecast, by Application 2019 & 2032
- Table 58: Israel Agriculture Variable Rate Technology Market Revenue (Million) Forecast, by Application 2019 & 2032
- Table 59: GCC Agriculture Variable Rate Technology Market Revenue (Million) Forecast, by Application 2019 & 2032
- Table 60: North Africa Agriculture Variable Rate Technology Market Revenue (Million) Forecast, by Application 2019 & 2032
- Table 61: South Africa Agriculture Variable Rate Technology Market Revenue (Million) Forecast, by Application 2019 & 2032
- Table 62: Rest of Middle East & Africa Agriculture Variable Rate Technology Market Revenue (Million) Forecast, by Application 2019 & 2032
- Table 63: Global Agriculture Variable Rate Technology Market Revenue Million Forecast, by Crop Type 2019 & 2032
- Table 64: Global Agriculture Variable Rate Technology Market Revenue Million Forecast, by Application 2019 & 2032
- Table 65: Global Agriculture Variable Rate Technology Market Revenue Million Forecast, by Country 2019 & 2032
- Table 66: China Agriculture Variable Rate Technology Market Revenue (Million) Forecast, by Application 2019 & 2032
- Table 67: India Agriculture Variable Rate Technology Market Revenue (Million) Forecast, by Application 2019 & 2032
- Table 68: Japan Agriculture Variable Rate Technology Market Revenue (Million) Forecast, by Application 2019 & 2032
- Table 69: South Korea Agriculture Variable Rate Technology Market Revenue (Million) Forecast, by Application 2019 & 2032
- Table 70: ASEAN Agriculture Variable Rate Technology Market Revenue (Million) Forecast, by Application 2019 & 2032
- Table 71: Oceania Agriculture Variable Rate Technology Market Revenue (Million) Forecast, by Application 2019 & 2032
- Table 72: Rest of Asia Pacific Agriculture Variable Rate Technology Market Revenue (Million) Forecast, by Application 2019 & 2032
Frequently Asked Questions
1. What is the projected Compound Annual Growth Rate (CAGR) of the Agriculture Variable Rate Technology Market?
The projected CAGR is approximately 9.40%.
2. Which companies are prominent players in the Agriculture Variable Rate Technology Market?
Key companies in the market include CNH Industrial N V, AG Leader Technology, Ageagle Aerial Systems, Lindsay Corporation, Deere & Company, Trimble Inc, Topcon Corporation, Valmont Industries Inc, Raven Industries Inc, AGCO Corporation.
3. What are the main segments of the Agriculture Variable Rate Technology Market?
The market segments include Crop Type, Application.
4. Can you provide details about the market size?
The market size is estimated to be USD 4.31 Million as of 2022.
5. What are some drivers contributing to market growth?
Low Availability of Skilled Labor; Technological Advancements.
6. What are the notable trends driving market growth?
Increasing Adoption of Digital Technologies in the Agricultural Sector.
7. Are there any restraints impacting market growth?
Increasing Farm Expenditure; Security Concerns in Modern Farming Machinery.
8. Can you provide examples of recent developments in the market?
N/A
9. What pricing options are available for accessing the report?
Pricing options include single-user, multi-user, and enterprise licenses priced at USD 3800, USD 4500, and USD 5800 respectively.
10. Is the market size provided in terms of value or volume?
The market size is provided in terms of value, measured in Million.
11. Are there any specific market keywords associated with the report?
Yes, the market keyword associated with the report is "Agriculture Variable Rate Technology Market," which aids in identifying and referencing the specific market segment covered.
12. How do I determine which pricing option suits my needs best?
The pricing options vary based on user requirements and access needs. Individual users may opt for single-user licenses, while businesses requiring broader access may choose multi-user or enterprise licenses for cost-effective access to the report.
13. Are there any additional resources or data provided in the Agriculture Variable Rate Technology Market report?
While the report offers comprehensive insights, it's advisable to review the specific contents or supplementary materials provided to ascertain if additional resources or data are available.
14. How can I stay updated on further developments or reports in the Agriculture Variable Rate Technology Market?
To stay informed about further developments, trends, and reports in the Agriculture Variable Rate Technology Market, consider subscribing to industry newsletters, following relevant companies and organizations, or regularly checking reputable industry news sources and publications.
Methodology
Step 1 - Identification of Relevant Samples Size from Population Database


Step 2 - Approaches for Defining Global Market Size (Value, Volume* & Price*)

Note*: In applicable scenarios
Step 3 - Data Sources
Primary Research
- Web Analytics
- Survey Reports
- Research Institute
- Latest Research Reports
- Opinion Leaders
Secondary Research
- Annual Reports
- White Paper
- Latest Press Release
- Industry Association
- Paid Database
- Investor Presentations

Step 4 - Data Triangulation
Involves using different sources of information in order to increase the validity of a study
These sources are likely to be stakeholders in a program - participants, other researchers, program staff, other community members, and so on.
Then we put all data in single framework & apply various statistical tools to find out the dynamic on the market.
During the analysis stage, feedback from the stakeholder groups would be compared to determine areas of agreement as well as areas of divergence
