

Key Insights
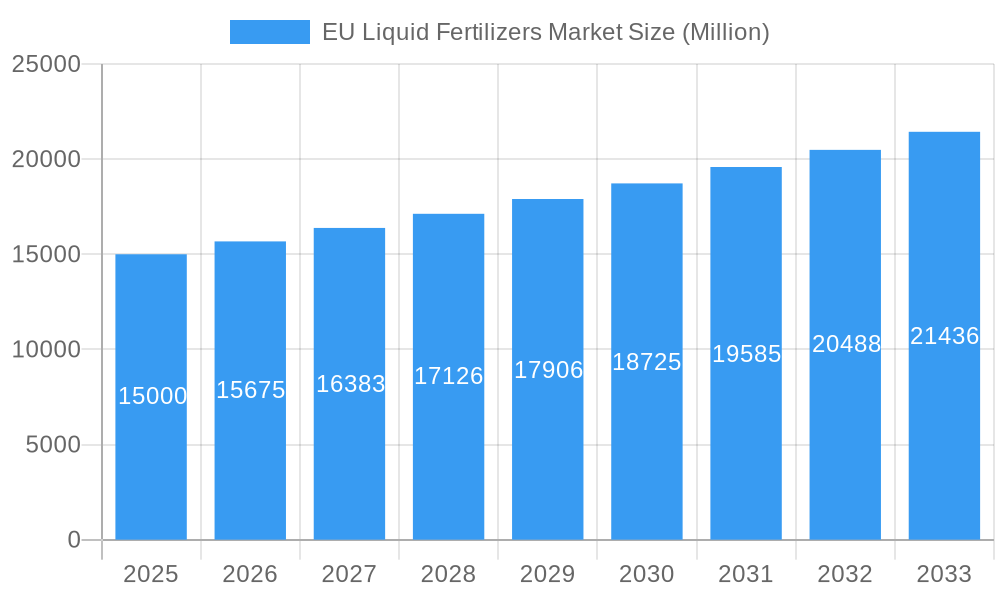
The EU liquid fertilizers market, exhibiting a Compound Annual Growth Rate (CAGR) of 4.50% from 2019 to 2024, is poised for continued expansion. Driven by increasing agricultural intensification, the growing demand for high-yielding crops, and a shift towards efficient fertilization practices, the market is expected to experience robust growth through 2033. The preference for liquid fertilizers stems from their ease of application, precise nutrient delivery, and reduced environmental impact compared to solid fertilizers. Specific segments within the EU market demonstrating significant growth potential include foliar application, favored for its targeted nutrient delivery to plants, and fertigation, which integrates fertilizer application with irrigation, maximizing resource utilization and minimizing nutrient loss. The segments of Nitrogen, Potassium, and Micronutrients within the Nutrient Type category are expected to lead the growth trajectory in response to rising crop yields and specific nutritional demands of different crops. Organic liquid fertilizers are also gaining traction due to increasing consumer preference for sustainable and environmentally friendly agricultural practices. This trend is particularly strong in the fruits and vegetables sector, where organic farming is widely adopted. Major players in the EU market are investing heavily in research and development to enhance product efficacy and sustainability, further driving market growth. Challenges, however, include stringent regulations governing fertilizer use and the potential for price volatility due to fluctuations in raw material costs.
EU Liquid Fertilizers Market Market Size (In Billion)
The competitive landscape is marked by a blend of established multinational companies and regional players. Established companies are leveraging their extensive distribution networks and brand recognition to maintain market share. However, smaller, more agile companies are innovating with specialized products and sustainable solutions, carving out niches within the market. Regional variations exist, with countries like Germany, France, and the United Kingdom representing larger market segments due to their significant agricultural production. Growth in the remaining European nations is projected to be fueled by similar drivers, though at varying rates depending on individual agricultural practices and economic conditions. Market segmentation based on application (grains and cereals, pulses and oilseeds, commercial crops, fruits and vegetables) also influences growth, with the fruits and vegetables segment predicted to experience the most significant growth over the coming decade, owing to the high value and demand for high-quality produce. Overall, the EU liquid fertilizers market presents a compelling investment opportunity, offering robust growth potential alongside the ongoing evolution of agricultural practices in the region.
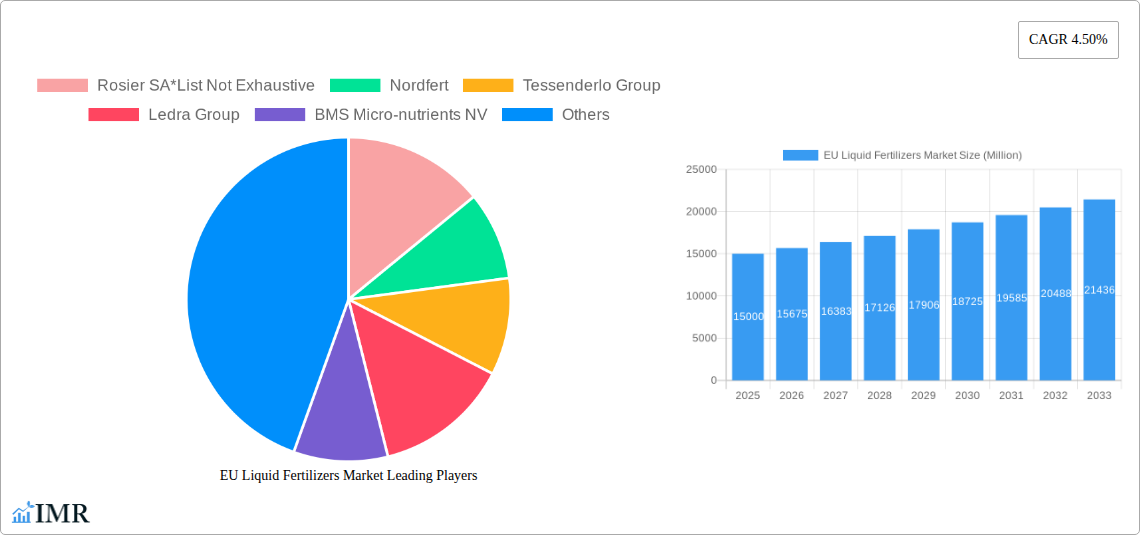
EU Liquid Fertilizers Market Company Market Share
EU Liquid Fertilizers Market: A Comprehensive Report (2019-2033)
This in-depth report provides a comprehensive analysis of the EU Liquid Fertilizers Market, offering valuable insights for industry professionals, investors, and stakeholders. Covering the period from 2019 to 2033, with a focus on 2025, this report delves into market dynamics, growth trends, key players, and future opportunities within this vital agricultural sector. The report segments the market by nutrient type (Nitrogen, Potassium, Micronutrients, Other Nutrients), ingredient type (Synthetic, Organic), mode of application (Foliar Application, Aerial Application, Starter Solutions, Fertigation, Injection into Soil), and application (Grains and Cereals, Pulses and Oilseeds, Commercial Crops, Fruits and Vegetables, Other Applications).
EU Liquid Fertilizers Market Dynamics & Structure
The EU liquid fertilizers market exhibits a moderately concentrated structure, with several major players dominating significant market shares. Technological innovation, driven by the need for efficient nutrient delivery and sustainable agricultural practices, is a key driver. Stringent EU regulations regarding fertilizer composition and environmental impact significantly shape market dynamics. Competitive pressures arise from both established players and emerging companies offering innovative solutions. End-user demographics, particularly the increasing demand for high-yield crops from intensive farming, fuel market growth. M&A activity, as evidenced by recent acquisitions, reflects consolidation efforts and expansion strategies within the sector.
- Market Concentration: The top 5 players hold approximately XX% of the market share in 2025 (estimated).
- Technological Innovation: Focus on precision farming technologies and controlled-release fertilizers.
- Regulatory Framework: Stringent environmental regulations driving demand for sustainable liquid fertilizers.
- Competitive Substitutes: Solid fertilizers and organic amendments pose some competition.
- M&A Trends: Consolidation and expansion are key drivers of mergers and acquisitions. XX major deals were recorded between 2019 and 2024.
EU Liquid Fertilizers Market Growth Trends & Insights
The EU liquid fertilizers market experienced a Compound Annual Growth Rate (CAGR) of XX% during the historical period (2019-2024) and is projected to grow at a CAGR of XX% during the forecast period (2025-2033). Market size is expected to reach XX million units by 2025 and XX million units by 2033. This growth is fueled by increasing agricultural intensity, rising demand for high-yield crops, and a shift towards efficient fertilizer application methods. Technological advancements in fertilizer formulations, precision agriculture, and data-driven insights are further driving adoption. Consumer behavior is also shifting towards sustainable and environmentally friendly practices, which influences the demand for specific fertilizer types, like organic liquid fertilizers. The market penetration of liquid fertilizers is expected to increase from XX% in 2024 to XX% by 2033.
Dominant Regions, Countries, or Segments in EU Liquid Fertilizers Market
While data is unavailable to pinpoint a single dominant region or country at the outset, the analysis reveals significant growth potential across various segments. The Nitrogen segment consistently commands the largest market share, followed by Potassium and Micronutrients. Synthetic fertilizers dominate the ingredient type segment due to cost-effectiveness and readily available supply. However, the organic segment is experiencing a notable increase in demand due to growing environmental concerns and consumer preferences for sustainable agriculture. Fertigation and foliar application are the most widely adopted methods, owing to efficiency and precision. Grains and cereals remain the largest application segment, followed by fruits and vegetables and commercial crops. Countries with high agricultural output and intensive farming practices, such as France, Germany, and the Netherlands, are expected to continue exhibiting substantial growth in the forecast period. Favorable economic policies promoting agricultural modernization and efficient infrastructure further enhance the market's growth potential.
- Key Drivers: High agricultural output, favorable government policies, efficient infrastructure.
- Dominance Factors: Market share and growth potential vary among segments and countries depending on factors mentioned above.
EU Liquid Fertilizers Market Product Landscape
Liquid fertilizers are constantly evolving, encompassing advanced formulations that optimize nutrient uptake and minimize environmental impact. Innovations focus on controlled-release technologies for improved efficiency and reduced nutrient runoff. Specific product variations are tailored to specific crops, soil types, and application methods. The key selling propositions include higher nutrient use efficiency, reduced environmental impact, and ease of application. Technological advancements in micronutrient delivery systems and customized blending capabilities cater to niche requirements, creating a diverse product landscape.
Key Drivers, Barriers & Challenges in EU Liquid Fertilizers Market
Key Drivers: The growing demand for high-yielding crops, the increasing adoption of precision farming techniques, and the stringent environmental regulations all contribute to a strong market push. Furthermore, technological advancements and government support for sustainable agriculture accelerate market growth.
Key Challenges and Restraints: Fluctuations in raw material prices can significantly impact production costs. Strict environmental regulations and the need for sustainable practices can increase production costs. Intense competition among established players and emerging companies creates pressure on margins. Supply chain disruptions caused by geopolitical instability and climate change pose significant challenges.
Emerging Opportunities in EU Liquid Fertilizers Market
The market presents several compelling opportunities, including the growing demand for organic and bio-based fertilizers, the expansion of precision agriculture technologies, and the development of tailored fertilizer solutions for specific crops. Untapped markets in Eastern European countries present opportunities for expansion. Furthermore, the increasing focus on sustainable agriculture practices opens avenues for environmentally friendly liquid fertilizers.
Growth Accelerators in the EU Liquid Fertilizers Market Industry
Technological innovations in fertilizer formulation, precision application methods, and data-driven decision-making are key catalysts. Strategic partnerships between fertilizer producers and agricultural technology companies unlock further growth potential. Expansion into new markets with high agricultural potential and the development of customized products for specific crops also contribute to acceleration.
Key Players Shaping the EU Liquid Fertilizers Market Market
- Rosier SA
- Nordfert
- Tessenderlo Group
- Ledra Group
- BMS Micro-nutrients NV
- BTU Center
- Van Iperen International
- Yara International ASA
- Compo Expert
- ICL Fertilizers
Notable Milestones in EU Liquid Fertilizers Market Sector
- May 2022: Tessenderlo Group acquired assets from Fleuren Tankopslag B.V., expanding its logistics and market reach.
- October 2021: BTU Center inaugurated a new production line, boosting its production capacity and market responsiveness.
- August 2021: Compo Expert acquired a logistics hub in Greece, enhancing its customer service capabilities in the region.
In-Depth EU Liquid Fertilizers Market Market Outlook
The EU liquid fertilizers market is poised for robust growth, driven by technological advancements, increasing agricultural intensity, and a growing focus on sustainable agriculture. Strategic investments in research and development, coupled with innovative marketing and distribution strategies, will be crucial for companies seeking to capitalize on emerging opportunities. The market's future potential lies in the development and adoption of environmentally friendly, precision-based liquid fertilizer solutions, tailored to address the specific needs of diverse agricultural systems across the EU.
EU Liquid Fertilizers Market Segmentation
- 1. Production Analysis
- 2. Consumption Analysis
- 3. Import Market Analysis (Value & Volume)
- 4. Export Market Analysis (Value & Volume)
- 5. Price Trend Analysis
EU Liquid Fertilizers Market Segmentation By Geography
-
1. North America
- 1.1. United States
- 1.2. Canada
- 1.3. Mexico
-
2. South America
- 2.1. Brazil
- 2.2. Argentina
- 2.3. Rest of South America
-
3. Europe
- 3.1. United Kingdom
- 3.2. Germany
- 3.3. France
- 3.4. Italy
- 3.5. Spain
- 3.6. Russia
- 3.7. Benelux
- 3.8. Nordics
- 3.9. Rest of Europe
-
4. Middle East & Africa
- 4.1. Turkey
- 4.2. Israel
- 4.3. GCC
- 4.4. North Africa
- 4.5. South Africa
- 4.6. Rest of Middle East & Africa
-
5. Asia Pacific
- 5.1. China
- 5.2. India
- 5.3. Japan
- 5.4. South Korea
- 5.5. ASEAN
- 5.6. Oceania
- 5.7. Rest of Asia Pacific
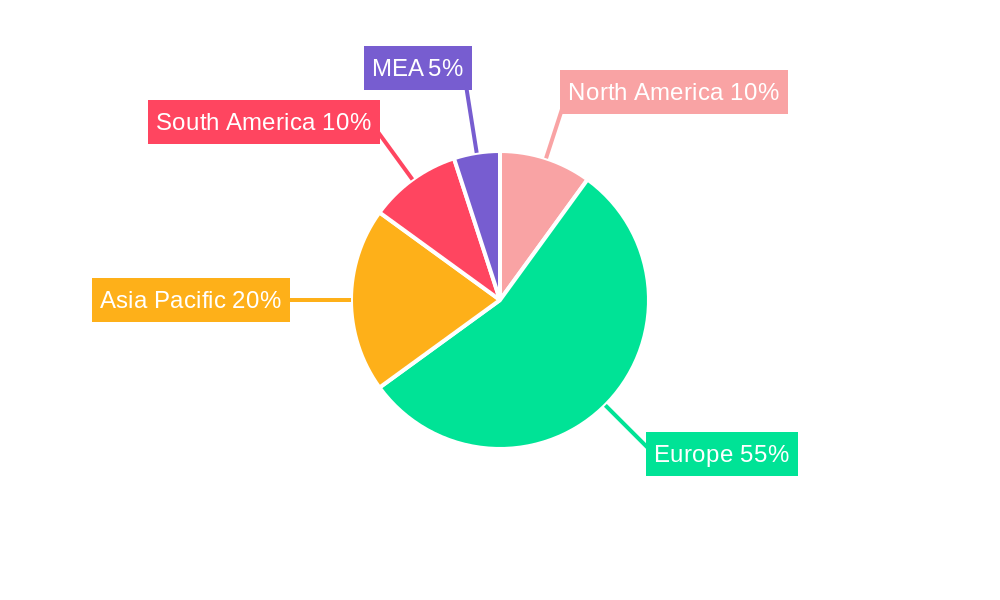
EU Liquid Fertilizers Market Regional Market Share
Geographic Coverage of EU Liquid Fertilizers Market
EU Liquid Fertilizers Market REPORT HIGHLIGHTS
| Aspects | Details |
|---|---|
| Study Period | 2020-2034 |
| Base Year | 2025 |
| Estimated Year | 2026 |
| Forecast Period | 2026-2034 |
| Historical Period | 2020-2025 |
| Growth Rate | CAGR of 4.5% from 2020-2034 |
| Segmentation |
|
Table of Contents
- 1. Introduction
- 1.1. Research Scope
- 1.2. Market Segmentation
- 1.3. Research Objective
- 1.4. Definitions and Assumptions
- 2. Executive Summary
- 2.1. Market Snapshot
- 3. Market Dynamics
- 3.1. Market Drivers
- 3.2. Market Restrains
- 3.3. Market Trends
- 3.4. Market Opportunities
- 4. Market Factor Analysis
- 4.1. Porters Five Forces
- 4.1.1. Bargaining Power of Suppliers
- 4.1.2. Bargaining Power of Buyers
- 4.1.3. Threat of New Entrants
- 4.1.4. Threat of Substitutes
- 4.1.5. Competitive Rivalry
- 4.2. PESTEL analysis
- 4.3. BCG Analysis
- 4.3.1. Stars (High Growth, High Market Share)
- 4.3.2. Cash Cows (Low Growth, High Market Share)
- 4.3.3. Question Mark (High Growth, Low Market Share)
- 4.3.4. Dogs (Low Growth, Low Market Share)
- 4.4. Ansoff Matrix Analysis
- 4.5. Supply Chain Analysis
- 4.6. Regulatory Landscape
- 4.7. Current Market Potential and Opportunity Assessment (TAM–SAM–SOM Framework)
- 4.8. IMR Analyst Note
- 4.1. Porters Five Forces
- 5. Market Analysis, Insights and Forecast 2021-2033
- 5.1. Market Analysis, Insights and Forecast - by Production Analysis
- 5.2. Market Analysis, Insights and Forecast - by Consumption Analysis
- 5.3. Market Analysis, Insights and Forecast - by Import Market Analysis (Value & Volume)
- 5.4. Market Analysis, Insights and Forecast - by Export Market Analysis (Value & Volume)
- 5.5. Market Analysis, Insights and Forecast - by Price Trend Analysis
- 5.6. Market Analysis, Insights and Forecast - by Region
- 5.6.1. North America
- 5.6.2. South America
- 5.6.3. Europe
- 5.6.4. Middle East & Africa
- 5.6.5. Asia Pacific
- 6. Global EU Liquid Fertilizers Market Analysis, Insights and Forecast, 2021-2033
- 6.1. Market Analysis, Insights and Forecast - by Production Analysis
- 6.2. Market Analysis, Insights and Forecast - by Consumption Analysis
- 6.3. Market Analysis, Insights and Forecast - by Import Market Analysis (Value & Volume)
- 6.4. Market Analysis, Insights and Forecast - by Export Market Analysis (Value & Volume)
- 6.5. Market Analysis, Insights and Forecast - by Price Trend Analysis
- 7. North America EU Liquid Fertilizers Market Analysis, Insights and Forecast, 2020-2032
- 7.1. Market Analysis, Insights and Forecast - by Production Analysis
- 7.2. Market Analysis, Insights and Forecast - by Consumption Analysis
- 7.3. Market Analysis, Insights and Forecast - by Import Market Analysis (Value & Volume)
- 7.4. Market Analysis, Insights and Forecast - by Export Market Analysis (Value & Volume)
- 7.5. Market Analysis, Insights and Forecast - by Price Trend Analysis
- 8. South America EU Liquid Fertilizers Market Analysis, Insights and Forecast, 2020-2032
- 8.1. Market Analysis, Insights and Forecast - by Production Analysis
- 8.2. Market Analysis, Insights and Forecast - by Consumption Analysis
- 8.3. Market Analysis, Insights and Forecast - by Import Market Analysis (Value & Volume)
- 8.4. Market Analysis, Insights and Forecast - by Export Market Analysis (Value & Volume)
- 8.5. Market Analysis, Insights and Forecast - by Price Trend Analysis
- 9. Europe EU Liquid Fertilizers Market Analysis, Insights and Forecast, 2020-2032
- 9.1. Market Analysis, Insights and Forecast - by Production Analysis
- 9.2. Market Analysis, Insights and Forecast - by Consumption Analysis
- 9.3. Market Analysis, Insights and Forecast - by Import Market Analysis (Value & Volume)
- 9.4. Market Analysis, Insights and Forecast - by Export Market Analysis (Value & Volume)
- 9.5. Market Analysis, Insights and Forecast - by Price Trend Analysis
- 10. Middle East & Africa EU Liquid Fertilizers Market Analysis, Insights and Forecast, 2020-2032
- 10.1. Market Analysis, Insights and Forecast - by Production Analysis
- 10.2. Market Analysis, Insights and Forecast - by Consumption Analysis
- 10.3. Market Analysis, Insights and Forecast - by Import Market Analysis (Value & Volume)
- 10.4. Market Analysis, Insights and Forecast - by Export Market Analysis (Value & Volume)
- 10.5. Market Analysis, Insights and Forecast - by Price Trend Analysis
- 11. Asia Pacific EU Liquid Fertilizers Market Analysis, Insights and Forecast, 2020-2032
- 11.1. Market Analysis, Insights and Forecast - by Production Analysis
- 11.2. Market Analysis, Insights and Forecast - by Consumption Analysis
- 11.3. Market Analysis, Insights and Forecast - by Import Market Analysis (Value & Volume)
- 11.4. Market Analysis, Insights and Forecast - by Export Market Analysis (Value & Volume)
- 11.5. Market Analysis, Insights and Forecast - by Price Trend Analysis
- 12. Competitive Analysis
- 12.1. Company Profiles
- 12.1.1 Rosier SA*List Not Exhaustive
- 12.1.1.1. Company Overview
- 12.1.1.2. Products
- 12.1.1.3. Company Financials
- 12.1.1.4. SWOT Analysis
- 12.1.2 Nordfert
- 12.1.2.1. Company Overview
- 12.1.2.2. Products
- 12.1.2.3. Company Financials
- 12.1.2.4. SWOT Analysis
- 12.1.3 Tessenderlo Group
- 12.1.3.1. Company Overview
- 12.1.3.2. Products
- 12.1.3.3. Company Financials
- 12.1.3.4. SWOT Analysis
- 12.1.4 Ledra Group
- 12.1.4.1. Company Overview
- 12.1.4.2. Products
- 12.1.4.3. Company Financials
- 12.1.4.4. SWOT Analysis
- 12.1.5 BMS Micro-nutrients NV
- 12.1.5.1. Company Overview
- 12.1.5.2. Products
- 12.1.5.3. Company Financials
- 12.1.5.4. SWOT Analysis
- 12.1.6 BTU Center
- 12.1.6.1. Company Overview
- 12.1.6.2. Products
- 12.1.6.3. Company Financials
- 12.1.6.4. SWOT Analysis
- 12.1.7 Van Iperen International
- 12.1.7.1. Company Overview
- 12.1.7.2. Products
- 12.1.7.3. Company Financials
- 12.1.7.4. SWOT Analysis
- 12.1.8 Yara International ASA
- 12.1.8.1. Company Overview
- 12.1.8.2. Products
- 12.1.8.3. Company Financials
- 12.1.8.4. SWOT Analysis
- 12.1.9 Compo Expert
- 12.1.9.1. Company Overview
- 12.1.9.2. Products
- 12.1.9.3. Company Financials
- 12.1.9.4. SWOT Analysis
- 12.1.10 ICL Fertilizers
- 12.1.10.1. Company Overview
- 12.1.10.2. Products
- 12.1.10.3. Company Financials
- 12.1.10.4. SWOT Analysis
- 12.1.1 Rosier SA*List Not Exhaustive
- 12.2. Market Entropy
- 12.2.1 Company's Key Areas Served
- 12.2.2 Recent Developments
- 12.3. Company Market Share Analysis 2025
- 12.3.1 Top 5 Companies Market Share Analysis
- 12.3.2 Top 3 Companies Market Share Analysis
- 12.4. List of Potential Customers
- 13. Research Methodology
List of Figures
- Figure 1: Global EU Liquid Fertilizers Market Revenue Breakdown (billion, %) by Region 2025 & 2033
- Figure 2: North America EU Liquid Fertilizers Market Revenue (billion), by Production Analysis 2025 & 2033
- Figure 3: North America EU Liquid Fertilizers Market Revenue Share (%), by Production Analysis 2025 & 2033
- Figure 4: North America EU Liquid Fertilizers Market Revenue (billion), by Consumption Analysis 2025 & 2033
- Figure 5: North America EU Liquid Fertilizers Market Revenue Share (%), by Consumption Analysis 2025 & 2033
- Figure 6: North America EU Liquid Fertilizers Market Revenue (billion), by Import Market Analysis (Value & Volume) 2025 & 2033
- Figure 7: North America EU Liquid Fertilizers Market Revenue Share (%), by Import Market Analysis (Value & Volume) 2025 & 2033
- Figure 8: North America EU Liquid Fertilizers Market Revenue (billion), by Export Market Analysis (Value & Volume) 2025 & 2033
- Figure 9: North America EU Liquid Fertilizers Market Revenue Share (%), by Export Market Analysis (Value & Volume) 2025 & 2033
- Figure 10: North America EU Liquid Fertilizers Market Revenue (billion), by Price Trend Analysis 2025 & 2033
- Figure 11: North America EU Liquid Fertilizers Market Revenue Share (%), by Price Trend Analysis 2025 & 2033
- Figure 12: North America EU Liquid Fertilizers Market Revenue (billion), by Country 2025 & 2033
- Figure 13: North America EU Liquid Fertilizers Market Revenue Share (%), by Country 2025 & 2033
- Figure 14: South America EU Liquid Fertilizers Market Revenue (billion), by Production Analysis 2025 & 2033
- Figure 15: South America EU Liquid Fertilizers Market Revenue Share (%), by Production Analysis 2025 & 2033
- Figure 16: South America EU Liquid Fertilizers Market Revenue (billion), by Consumption Analysis 2025 & 2033
- Figure 17: South America EU Liquid Fertilizers Market Revenue Share (%), by Consumption Analysis 2025 & 2033
- Figure 18: South America EU Liquid Fertilizers Market Revenue (billion), by Import Market Analysis (Value & Volume) 2025 & 2033
- Figure 19: South America EU Liquid Fertilizers Market Revenue Share (%), by Import Market Analysis (Value & Volume) 2025 & 2033
- Figure 20: South America EU Liquid Fertilizers Market Revenue (billion), by Export Market Analysis (Value & Volume) 2025 & 2033
- Figure 21: South America EU Liquid Fertilizers Market Revenue Share (%), by Export Market Analysis (Value & Volume) 2025 & 2033
- Figure 22: South America EU Liquid Fertilizers Market Revenue (billion), by Price Trend Analysis 2025 & 2033
- Figure 23: South America EU Liquid Fertilizers Market Revenue Share (%), by Price Trend Analysis 2025 & 2033
- Figure 24: South America EU Liquid Fertilizers Market Revenue (billion), by Country 2025 & 2033
- Figure 25: South America EU Liquid Fertilizers Market Revenue Share (%), by Country 2025 & 2033
- Figure 26: Europe EU Liquid Fertilizers Market Revenue (billion), by Production Analysis 2025 & 2033
- Figure 27: Europe EU Liquid Fertilizers Market Revenue Share (%), by Production Analysis 2025 & 2033
- Figure 28: Europe EU Liquid Fertilizers Market Revenue (billion), by Consumption Analysis 2025 & 2033
- Figure 29: Europe EU Liquid Fertilizers Market Revenue Share (%), by Consumption Analysis 2025 & 2033
- Figure 30: Europe EU Liquid Fertilizers Market Revenue (billion), by Import Market Analysis (Value & Volume) 2025 & 2033
- Figure 31: Europe EU Liquid Fertilizers Market Revenue Share (%), by Import Market Analysis (Value & Volume) 2025 & 2033
- Figure 32: Europe EU Liquid Fertilizers Market Revenue (billion), by Export Market Analysis (Value & Volume) 2025 & 2033
- Figure 33: Europe EU Liquid Fertilizers Market Revenue Share (%), by Export Market Analysis (Value & Volume) 2025 & 2033
- Figure 34: Europe EU Liquid Fertilizers Market Revenue (billion), by Price Trend Analysis 2025 & 2033
- Figure 35: Europe EU Liquid Fertilizers Market Revenue Share (%), by Price Trend Analysis 2025 & 2033
- Figure 36: Europe EU Liquid Fertilizers Market Revenue (billion), by Country 2025 & 2033
- Figure 37: Europe EU Liquid Fertilizers Market Revenue Share (%), by Country 2025 & 2033
- Figure 38: Middle East & Africa EU Liquid Fertilizers Market Revenue (billion), by Production Analysis 2025 & 2033
- Figure 39: Middle East & Africa EU Liquid Fertilizers Market Revenue Share (%), by Production Analysis 2025 & 2033
- Figure 40: Middle East & Africa EU Liquid Fertilizers Market Revenue (billion), by Consumption Analysis 2025 & 2033
- Figure 41: Middle East & Africa EU Liquid Fertilizers Market Revenue Share (%), by Consumption Analysis 2025 & 2033
- Figure 42: Middle East & Africa EU Liquid Fertilizers Market Revenue (billion), by Import Market Analysis (Value & Volume) 2025 & 2033
- Figure 43: Middle East & Africa EU Liquid Fertilizers Market Revenue Share (%), by Import Market Analysis (Value & Volume) 2025 & 2033
- Figure 44: Middle East & Africa EU Liquid Fertilizers Market Revenue (billion), by Export Market Analysis (Value & Volume) 2025 & 2033
- Figure 45: Middle East & Africa EU Liquid Fertilizers Market Revenue Share (%), by Export Market Analysis (Value & Volume) 2025 & 2033
- Figure 46: Middle East & Africa EU Liquid Fertilizers Market Revenue (billion), by Price Trend Analysis 2025 & 2033
- Figure 47: Middle East & Africa EU Liquid Fertilizers Market Revenue Share (%), by Price Trend Analysis 2025 & 2033
- Figure 48: Middle East & Africa EU Liquid Fertilizers Market Revenue (billion), by Country 2025 & 2033
- Figure 49: Middle East & Africa EU Liquid Fertilizers Market Revenue Share (%), by Country 2025 & 2033
- Figure 50: Asia Pacific EU Liquid Fertilizers Market Revenue (billion), by Production Analysis 2025 & 2033
- Figure 51: Asia Pacific EU Liquid Fertilizers Market Revenue Share (%), by Production Analysis 2025 & 2033
- Figure 52: Asia Pacific EU Liquid Fertilizers Market Revenue (billion), by Consumption Analysis 2025 & 2033
- Figure 53: Asia Pacific EU Liquid Fertilizers Market Revenue Share (%), by Consumption Analysis 2025 & 2033
- Figure 54: Asia Pacific EU Liquid Fertilizers Market Revenue (billion), by Import Market Analysis (Value & Volume) 2025 & 2033
- Figure 55: Asia Pacific EU Liquid Fertilizers Market Revenue Share (%), by Import Market Analysis (Value & Volume) 2025 & 2033
- Figure 56: Asia Pacific EU Liquid Fertilizers Market Revenue (billion), by Export Market Analysis (Value & Volume) 2025 & 2033
- Figure 57: Asia Pacific EU Liquid Fertilizers Market Revenue Share (%), by Export Market Analysis (Value & Volume) 2025 & 2033
- Figure 58: Asia Pacific EU Liquid Fertilizers Market Revenue (billion), by Price Trend Analysis 2025 & 2033
- Figure 59: Asia Pacific EU Liquid Fertilizers Market Revenue Share (%), by Price Trend Analysis 2025 & 2033
- Figure 60: Asia Pacific EU Liquid Fertilizers Market Revenue (billion), by Country 2025 & 2033
- Figure 61: Asia Pacific EU Liquid Fertilizers Market Revenue Share (%), by Country 2025 & 2033
List of Tables
- Table 1: Global EU Liquid Fertilizers Market Revenue billion Forecast, by Production Analysis 2020 & 2033
- Table 2: Global EU Liquid Fertilizers Market Revenue billion Forecast, by Consumption Analysis 2020 & 2033
- Table 3: Global EU Liquid Fertilizers Market Revenue billion Forecast, by Import Market Analysis (Value & Volume) 2020 & 2033
- Table 4: Global EU Liquid Fertilizers Market Revenue billion Forecast, by Export Market Analysis (Value & Volume) 2020 & 2033
- Table 5: Global EU Liquid Fertilizers Market Revenue billion Forecast, by Price Trend Analysis 2020 & 2033
- Table 6: Global EU Liquid Fertilizers Market Revenue billion Forecast, by Region 2020 & 2033
- Table 7: Global EU Liquid Fertilizers Market Revenue billion Forecast, by Production Analysis 2020 & 2033
- Table 8: Global EU Liquid Fertilizers Market Revenue billion Forecast, by Consumption Analysis 2020 & 2033
- Table 9: Global EU Liquid Fertilizers Market Revenue billion Forecast, by Import Market Analysis (Value & Volume) 2020 & 2033
- Table 10: Global EU Liquid Fertilizers Market Revenue billion Forecast, by Export Market Analysis (Value & Volume) 2020 & 2033
- Table 11: Global EU Liquid Fertilizers Market Revenue billion Forecast, by Price Trend Analysis 2020 & 2033
- Table 12: Global EU Liquid Fertilizers Market Revenue billion Forecast, by Country 2020 & 2033
- Table 13: United States EU Liquid Fertilizers Market Revenue (billion) Forecast, by Application 2020 & 2033
- Table 14: Canada EU Liquid Fertilizers Market Revenue (billion) Forecast, by Application 2020 & 2033
- Table 15: Mexico EU Liquid Fertilizers Market Revenue (billion) Forecast, by Application 2020 & 2033
- Table 16: Global EU Liquid Fertilizers Market Revenue billion Forecast, by Production Analysis 2020 & 2033
- Table 17: Global EU Liquid Fertilizers Market Revenue billion Forecast, by Consumption Analysis 2020 & 2033
- Table 18: Global EU Liquid Fertilizers Market Revenue billion Forecast, by Import Market Analysis (Value & Volume) 2020 & 2033
- Table 19: Global EU Liquid Fertilizers Market Revenue billion Forecast, by Export Market Analysis (Value & Volume) 2020 & 2033
- Table 20: Global EU Liquid Fertilizers Market Revenue billion Forecast, by Price Trend Analysis 2020 & 2033
- Table 21: Global EU Liquid Fertilizers Market Revenue billion Forecast, by Country 2020 & 2033
- Table 22: Brazil EU Liquid Fertilizers Market Revenue (billion) Forecast, by Application 2020 & 2033
- Table 23: Argentina EU Liquid Fertilizers Market Revenue (billion) Forecast, by Application 2020 & 2033
- Table 24: Rest of South America EU Liquid Fertilizers Market Revenue (billion) Forecast, by Application 2020 & 2033
- Table 25: Global EU Liquid Fertilizers Market Revenue billion Forecast, by Production Analysis 2020 & 2033
- Table 26: Global EU Liquid Fertilizers Market Revenue billion Forecast, by Consumption Analysis 2020 & 2033
- Table 27: Global EU Liquid Fertilizers Market Revenue billion Forecast, by Import Market Analysis (Value & Volume) 2020 & 2033
- Table 28: Global EU Liquid Fertilizers Market Revenue billion Forecast, by Export Market Analysis (Value & Volume) 2020 & 2033
- Table 29: Global EU Liquid Fertilizers Market Revenue billion Forecast, by Price Trend Analysis 2020 & 2033
- Table 30: Global EU Liquid Fertilizers Market Revenue billion Forecast, by Country 2020 & 2033
- Table 31: United Kingdom EU Liquid Fertilizers Market Revenue (billion) Forecast, by Application 2020 & 2033
- Table 32: Germany EU Liquid Fertilizers Market Revenue (billion) Forecast, by Application 2020 & 2033
- Table 33: France EU Liquid Fertilizers Market Revenue (billion) Forecast, by Application 2020 & 2033
- Table 34: Italy EU Liquid Fertilizers Market Revenue (billion) Forecast, by Application 2020 & 2033
- Table 35: Spain EU Liquid Fertilizers Market Revenue (billion) Forecast, by Application 2020 & 2033
- Table 36: Russia EU Liquid Fertilizers Market Revenue (billion) Forecast, by Application 2020 & 2033
- Table 37: Benelux EU Liquid Fertilizers Market Revenue (billion) Forecast, by Application 2020 & 2033
- Table 38: Nordics EU Liquid Fertilizers Market Revenue (billion) Forecast, by Application 2020 & 2033
- Table 39: Rest of Europe EU Liquid Fertilizers Market Revenue (billion) Forecast, by Application 2020 & 2033
- Table 40: Global EU Liquid Fertilizers Market Revenue billion Forecast, by Production Analysis 2020 & 2033
- Table 41: Global EU Liquid Fertilizers Market Revenue billion Forecast, by Consumption Analysis 2020 & 2033
- Table 42: Global EU Liquid Fertilizers Market Revenue billion Forecast, by Import Market Analysis (Value & Volume) 2020 & 2033
- Table 43: Global EU Liquid Fertilizers Market Revenue billion Forecast, by Export Market Analysis (Value & Volume) 2020 & 2033
- Table 44: Global EU Liquid Fertilizers Market Revenue billion Forecast, by Price Trend Analysis 2020 & 2033
- Table 45: Global EU Liquid Fertilizers Market Revenue billion Forecast, by Country 2020 & 2033
- Table 46: Turkey EU Liquid Fertilizers Market Revenue (billion) Forecast, by Application 2020 & 2033
- Table 47: Israel EU Liquid Fertilizers Market Revenue (billion) Forecast, by Application 2020 & 2033
- Table 48: GCC EU Liquid Fertilizers Market Revenue (billion) Forecast, by Application 2020 & 2033
- Table 49: North Africa EU Liquid Fertilizers Market Revenue (billion) Forecast, by Application 2020 & 2033
- Table 50: South Africa EU Liquid Fertilizers Market Revenue (billion) Forecast, by Application 2020 & 2033
- Table 51: Rest of Middle East & Africa EU Liquid Fertilizers Market Revenue (billion) Forecast, by Application 2020 & 2033
- Table 52: Global EU Liquid Fertilizers Market Revenue billion Forecast, by Production Analysis 2020 & 2033
- Table 53: Global EU Liquid Fertilizers Market Revenue billion Forecast, by Consumption Analysis 2020 & 2033
- Table 54: Global EU Liquid Fertilizers Market Revenue billion Forecast, by Import Market Analysis (Value & Volume) 2020 & 2033
- Table 55: Global EU Liquid Fertilizers Market Revenue billion Forecast, by Export Market Analysis (Value & Volume) 2020 & 2033
- Table 56: Global EU Liquid Fertilizers Market Revenue billion Forecast, by Price Trend Analysis 2020 & 2033
- Table 57: Global EU Liquid Fertilizers Market Revenue billion Forecast, by Country 2020 & 2033
- Table 58: China EU Liquid Fertilizers Market Revenue (billion) Forecast, by Application 2020 & 2033
- Table 59: India EU Liquid Fertilizers Market Revenue (billion) Forecast, by Application 2020 & 2033
- Table 60: Japan EU Liquid Fertilizers Market Revenue (billion) Forecast, by Application 2020 & 2033
- Table 61: South Korea EU Liquid Fertilizers Market Revenue (billion) Forecast, by Application 2020 & 2033
- Table 62: ASEAN EU Liquid Fertilizers Market Revenue (billion) Forecast, by Application 2020 & 2033
- Table 63: Oceania EU Liquid Fertilizers Market Revenue (billion) Forecast, by Application 2020 & 2033
- Table 64: Rest of Asia Pacific EU Liquid Fertilizers Market Revenue (billion) Forecast, by Application 2020 & 2033
Frequently Asked Questions
1. What is the projected Compound Annual Growth Rate (CAGR) of the EU Liquid Fertilizers Market?
The projected CAGR is approximately 4.5%.
2. Which companies are prominent players in the EU Liquid Fertilizers Market?
Key companies in the market include Rosier SA*List Not Exhaustive, Nordfert, Tessenderlo Group, Ledra Group, BMS Micro-nutrients NV, BTU Center, Van Iperen International, Yara International ASA, Compo Expert, ICL Fertilizers.
3. What are the main segments of the EU Liquid Fertilizers Market?
The market segments include Production Analysis, Consumption Analysis, Import Market Analysis (Value & Volume), Export Market Analysis (Value & Volume), Price Trend Analysis.
4. Can you provide details about the market size?
The market size is estimated to be USD 3.87 billion as of 2022.
5. What are some drivers contributing to market growth?
Easy Usage and Application Procedures Suitable for European Land.
6. What are the notable trends driving market growth?
Rising Importance of Precision Farming Drives the Market.
7. Are there any restraints impacting market growth?
Environmental Concerns Regarding Use of Synthetic Liquid Fertilizers.
8. Can you provide examples of recent developments in the market?
May 2022: Tessenderlo Group successfully acquired assets from Fleuren Tankopslag B.V., a tank storage and transshipment company based in the port of Cuijk, Netherlands. This strategic move enhances their capacity to market and transport liquid fertilizer products throughout the region.
9. What pricing options are available for accessing the report?
Pricing options include single-user, multi-user, and enterprise licenses priced at USD 4750, USD 5250, and USD 8750 respectively.
10. Is the market size provided in terms of value or volume?
The market size is provided in terms of value, measured in billion.
11. Are there any specific market keywords associated with the report?
Yes, the market keyword associated with the report is "EU Liquid Fertilizers Market," which aids in identifying and referencing the specific market segment covered.
12. How do I determine which pricing option suits my needs best?
The pricing options vary based on user requirements and access needs. Individual users may opt for single-user licenses, while businesses requiring broader access may choose multi-user or enterprise licenses for cost-effective access to the report.
13. Are there any additional resources or data provided in the EU Liquid Fertilizers Market report?
While the report offers comprehensive insights, it's advisable to review the specific contents or supplementary materials provided to ascertain if additional resources or data are available.
14. How can I stay updated on further developments or reports in the EU Liquid Fertilizers Market?
To stay informed about further developments, trends, and reports in the EU Liquid Fertilizers Market, consider subscribing to industry newsletters, following relevant companies and organizations, or regularly checking reputable industry news sources and publications.
Methodology
Step 1 - Identification of Relevant Samples Size from Population Database


Step 2 - Approaches for Defining Global Market Size (Value, Volume* & Price*)

Note*: In applicable scenarios
Step 3 - Data Sources
Primary Research
- Web Analytics
- Survey Reports
- Research Institute
- Latest Research Reports
- Opinion Leaders
Secondary Research
- Annual Reports
- White Paper
- Latest Press Release
- Industry Association
- Paid Database
- Investor Presentations

Step 4 - Data Triangulation
Involves using different sources of information in order to increase the validity of a study
These sources are likely to be stakeholders in a program - participants, other researchers, program staff, other community members, and so on.
Then we put all data in single framework & apply various statistical tools to find out the dynamic on the market.
During the analysis stage, feedback from the stakeholder groups would be compared to determine areas of agreement as well as areas of divergence