

Key Insights
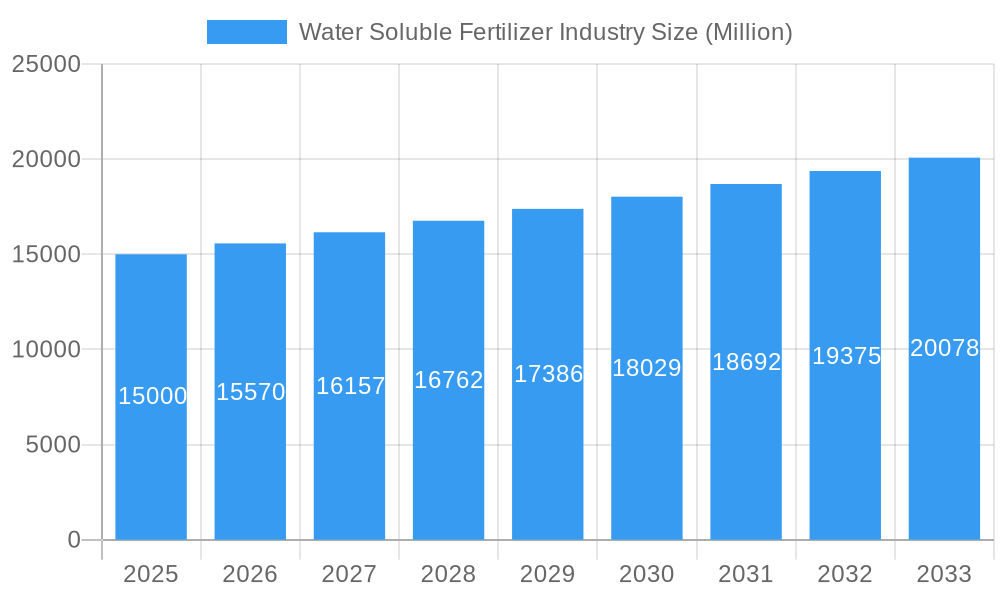
The water-soluble fertilizer market, valued at approximately $XX million in 2025, is projected to experience robust growth, driven by the increasing demand for efficient nutrient delivery systems in agriculture. A compound annual growth rate (CAGR) of 3.80% from 2025 to 2033 indicates a significant expansion of this market. Key drivers include the rising global population, necessitating enhanced crop yields and optimized resource utilization. The shift towards precision agriculture, employing advanced techniques like fertigation and foliar application, further fuels market expansion. Moreover, the growing preference for high-quality, nutrient-rich produce is driving demand for water-soluble fertilizers among horticultural and field crop farmers. Segment-wise, fertigation application mode is expected to dominate, owing to its targeted nutrient delivery and efficient water management capabilities. Among crop types, field crops and horticultural crops hold significant market shares, mirroring their vast acreage and economic importance. Complex fertilizers, offering a balanced blend of primary and secondary macronutrients, are likely to maintain a higher market share compared to straight fertilizers. Major players like Coromandel International Ltd, Haifa Group, and Yara International AS are actively shaping the market landscape through innovation and expansion strategies. Geographic regions such as North America and Asia-Pacific are expected to exhibit strong growth, driven by large agricultural sectors and robust economic activity.
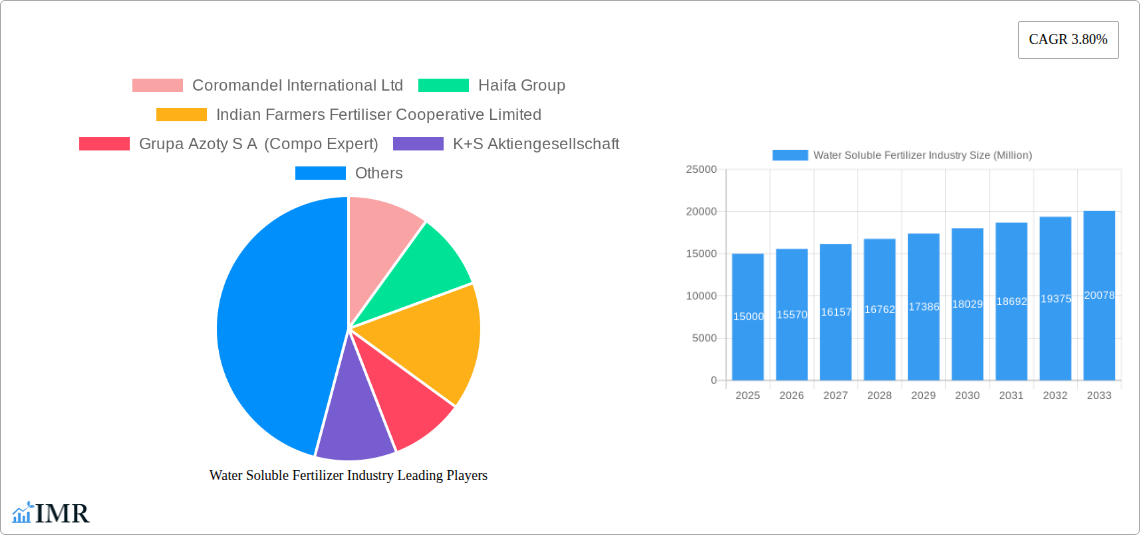
Water Soluble Fertilizer Industry Market Size (In Billion)
Market restraints include the fluctuating prices of raw materials and the potential environmental concerns associated with fertilizer usage. However, the ongoing development of sustainable and eco-friendly water-soluble fertilizer formulations, along with government initiatives promoting efficient agriculture, are expected to mitigate these challenges. The market is expected to witness increased adoption of technology, resulting in improved data analytics and precise nutrient management. This will lead to greater efficiency, better yields, and higher profitability for farmers. The overall outlook for the water-soluble fertilizer market is optimistic, with continued growth projected throughout the forecast period driven by a complex interplay of factors related to food security, technological advancements, and shifting agricultural practices.
Water Soluble Fertilizer Industry Company Market Share
This comprehensive report provides a detailed analysis of the global water soluble fertilizer industry, encompassing market dynamics, growth trends, regional performance, and key players. The study covers the historical period (2019-2024), base year (2025), and forecast period (2025-2033), offering valuable insights for industry professionals, investors, and stakeholders. The report analyzes parent markets (fertilizer industry) and child markets (specific application modes, crop types, and fertilizer types) to provide a granular understanding of market segmentation and growth opportunities. Market values are presented in millions of units.
Water Soluble Fertilizer Industry Market Dynamics & Structure
The water soluble fertilizer market is characterized by moderate concentration, with key players holding significant market share. Technological innovation, particularly in controlled-release formulations and precision application technologies, is a major driver. Regulatory frameworks concerning environmental impact and fertilizer usage vary across regions, influencing market dynamics. Competitive product substitutes include traditional granular fertilizers and organic alternatives, presenting ongoing challenges. End-user demographics, primarily driven by agricultural practices and the demand for high-yield crops, significantly impact market growth. Mergers and acquisitions (M&A) activity is relatively frequent, with larger companies strategically acquiring smaller firms to expand their product portfolios and geographic reach.
- Market Concentration: Moderately concentrated, with top 10 players accounting for approximately xx% of the market in 2024.
- Technological Innovation: Focus on controlled-release fertilizers, precision application, and nutrient efficiency.
- Regulatory Landscape: Varying regulations across regions impacting product approvals and usage.
- Competitive Substitutes: Traditional granular fertilizers and organic alternatives.
- M&A Activity: Significant activity in recent years, driven by expansion strategies and product diversification. Estimated xx M&A deals in 2019-2024.
Water Soluble Fertilizer Industry Growth Trends & Insights
The global water soluble fertilizer market experienced substantial growth during the historical period (2019-2024), driven by factors such as increasing food demand, rising adoption of precision agriculture techniques, and favorable government policies promoting efficient fertilizer use. The market size is projected to reach xx million units by 2025, exhibiting a CAGR of xx% during the forecast period (2025-2033). Technological advancements, such as the development of customized nutrient blends and automated application systems, are further accelerating market growth. Shifting consumer preferences towards sustainable and high-yielding agricultural practices are also contributing factors. Adoption rates for water soluble fertilizers are increasing across various crop types and geographical regions, especially in high-value horticultural and turf & ornamental segments. This trend is expected to continue, driven by the benefits of improved nutrient uptake and yield enhancement.
Dominant Regions, Countries, or Segments in Water Soluble Fertilizer Industry
North America and Europe currently hold dominant positions in the water soluble fertilizer market, primarily due to established agricultural practices, strong regulatory frameworks, and higher consumer purchasing power. However, Asia-Pacific is projected to experience significant growth in the coming years, driven by the expanding agricultural sector and increasing adoption of modern farming techniques.
Dominant Segments:
- Application Mode: Fertigation holds the largest market share, due to its efficiency and effectiveness. Foliar application is also showing strong growth, particularly in horticultural crops.
- Crop Type: Horticultural crops currently drive the market, followed by field crops. Turf & Ornamental is a growing segment.
- Type: Complex fertilizers are the most widely used, while straight fertilizers and secondary macronutrients cater to specific crop needs.
Key Drivers:
- North America & Europe: High agricultural productivity, established infrastructure, and advanced farming practices.
- Asia-Pacific: Rapid economic development, rising food demand, and increasing government investment in agriculture.
- South America: Growing demand from large-scale farming operations.
Water Soluble Fertilizer Industry Product Landscape
Water soluble fertilizers offer unique selling propositions including improved nutrient uptake efficiency, precision application capabilities, and reduced environmental impact compared to traditional fertilizers. Continuous innovation drives the development of customized blends tailored to specific crop needs, resulting in higher yields and improved quality. Technological advancements in controlled-release formulations and smart application technologies further enhance the value proposition of these products.
Key Drivers, Barriers & Challenges in Water Soluble Fertilizer Industry
Key Drivers:
- Rising global food demand.
- Increasing adoption of precision agriculture.
- Government initiatives promoting sustainable agriculture.
- Technological advancements in fertilizer formulations and application.
Key Challenges:
- Fluctuations in raw material prices.
- Stringent environmental regulations.
- Competition from traditional fertilizers and organic alternatives.
- Supply chain disruptions. (Estimated xx% impact on market growth in 2022)
Emerging Opportunities in Water Soluble Fertilizer Industry
Emerging opportunities lie in untapped markets in developing economies, particularly in Africa and Latin America. Innovative applications, such as hydroponics and aeroponics, are driving demand for specialized water soluble fertilizers. Evolving consumer preferences towards sustainable and environmentally friendly agricultural practices present further opportunities for bio-based and organic water soluble fertilizers.
Growth Accelerators in the Water Soluble Fertilizer Industry Industry
Technological breakthroughs in controlled-release technology, nanotechnology-enabled fertilizers, and precision agriculture are key growth catalysts. Strategic partnerships between fertilizer manufacturers and agricultural technology companies are fostering innovation and market expansion. Government initiatives promoting sustainable agriculture and efficient resource management are creating a favorable environment for market growth.
Key Players Shaping the Water Soluble Fertilizer Industry Market
- Coromandel International Ltd
- Haifa Group
- Indian Farmers Fertiliser Cooperative Limited
- Grupa Azoty S A (Compo Expert)
- K+S Aktiengesellschaft
- Yara International AS
- ICL Group Ltd
- BMS Micro-Nutrients NV
- Sociedad Quimica y Minera de Chile SA
Notable Milestones in Water Soluble Fertilizer Industry Sector
- April 2023: K+S acquired a 75% share of Industrial Commodities Holdings (Pty) Ltd's fertilizer business, expanding its presence in southern and eastern Africa. The joint venture, FertivPty Ltd, is expected to significantly impact market share in the region.
- May 2022: ICL launched three new Solinure NPK formulations with increased trace elements, enhancing product competitiveness.
- May 2022: ICL secured agreements to supply 600,000 metric tons of potash to India and 700,000 metric tons to China, demonstrating strong market demand.
In-Depth Water Soluble Fertilizer Industry Market Outlook
The future of the water soluble fertilizer market is bright, driven by continued technological advancements, increasing global food demand, and a growing focus on sustainable agriculture. Strategic partnerships, market expansions into emerging economies, and the development of innovative products will be crucial for long-term success. The market is poised for sustained growth, presenting significant opportunities for industry players to capitalize on emerging trends and technological breakthroughs.
Water Soluble Fertilizer Industry Segmentation
- 1. Production Analysis
- 2. Consumption Analysis
- 3. Import Market Analysis (Value & Volume)
- 4. Export Market Analysis (Value & Volume)
- 5. Price Trend Analysis
Water Soluble Fertilizer Industry Segmentation By Geography
-
1. North America
- 1.1. United States
- 1.2. Canada
- 1.3. Mexico
-
2. South America
- 2.1. Brazil
- 2.2. Argentina
- 2.3. Rest of South America
-
3. Europe
- 3.1. United Kingdom
- 3.2. Germany
- 3.3. France
- 3.4. Italy
- 3.5. Spain
- 3.6. Russia
- 3.7. Benelux
- 3.8. Nordics
- 3.9. Rest of Europe
-
4. Middle East & Africa
- 4.1. Turkey
- 4.2. Israel
- 4.3. GCC
- 4.4. North Africa
- 4.5. South Africa
- 4.6. Rest of Middle East & Africa
-
5. Asia Pacific
- 5.1. China
- 5.2. India
- 5.3. Japan
- 5.4. South Korea
- 5.5. ASEAN
- 5.6. Oceania
- 5.7. Rest of Asia Pacific
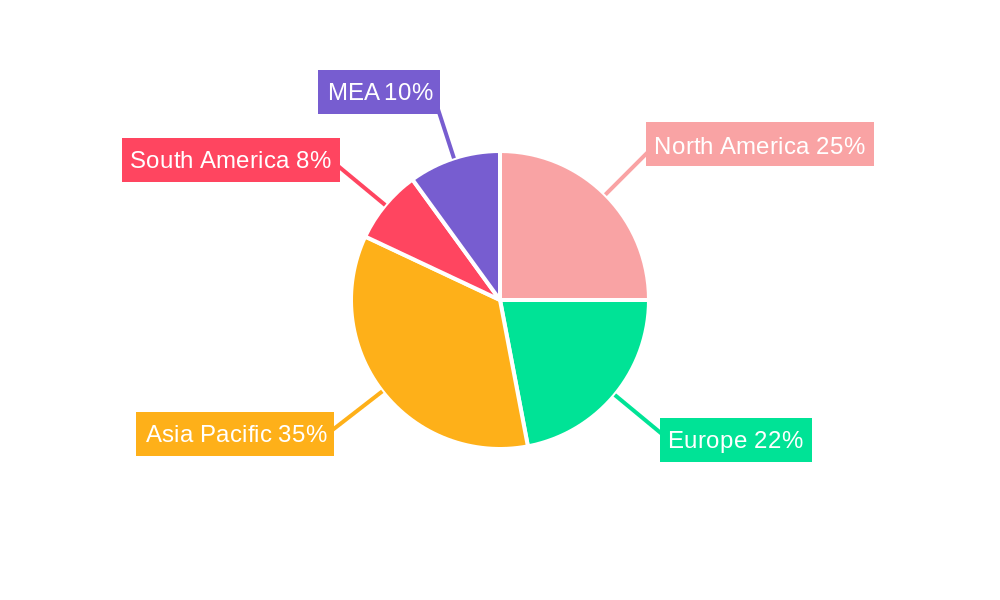
Water Soluble Fertilizer Industry Regional Market Share
Geographic Coverage of Water Soluble Fertilizer Industry
Water Soluble Fertilizer Industry REPORT HIGHLIGHTS
| Aspects | Details |
|---|---|
| Study Period | 2020-2034 |
| Base Year | 2025 |
| Estimated Year | 2026 |
| Forecast Period | 2026-2034 |
| Historical Period | 2020-2025 |
| Growth Rate | CAGR of 3.80% from 2020-2034 |
| Segmentation |
|
Table of Contents
- 1. Introduction
- 1.1. Research Scope
- 1.2. Market Segmentation
- 1.3. Research Objective
- 1.4. Definitions and Assumptions
- 2. Executive Summary
- 2.1. Market Snapshot
- 3. Market Dynamics
- 3.1. Market Drivers
- 3.2. Market Restrains
- 3.3. Market Trends
- 3.4. Market Opportunities
- 4. Market Factor Analysis
- 4.1. Porters Five Forces
- 4.1.1. Bargaining Power of Suppliers
- 4.1.2. Bargaining Power of Buyers
- 4.1.3. Threat of New Entrants
- 4.1.4. Threat of Substitutes
- 4.1.5. Competitive Rivalry
- 4.2. PESTEL analysis
- 4.3. BCG Analysis
- 4.3.1. Stars (High Growth, High Market Share)
- 4.3.2. Cash Cows (Low Growth, High Market Share)
- 4.3.3. Question Mark (High Growth, Low Market Share)
- 4.3.4. Dogs (Low Growth, Low Market Share)
- 4.4. Ansoff Matrix Analysis
- 4.5. Supply Chain Analysis
- 4.6. Regulatory Landscape
- 4.7. Current Market Potential and Opportunity Assessment (TAM–SAM–SOM Framework)
- 4.8. IMR Analyst Note
- 4.1. Porters Five Forces
- 5. Market Analysis, Insights and Forecast 2021-2033
- 5.1. Market Analysis, Insights and Forecast - by Production Analysis
- 5.2. Market Analysis, Insights and Forecast - by Consumption Analysis
- 5.3. Market Analysis, Insights and Forecast - by Import Market Analysis (Value & Volume)
- 5.4. Market Analysis, Insights and Forecast - by Export Market Analysis (Value & Volume)
- 5.5. Market Analysis, Insights and Forecast - by Price Trend Analysis
- 5.6. Market Analysis, Insights and Forecast - by Region
- 5.6.1. North America
- 5.6.2. South America
- 5.6.3. Europe
- 5.6.4. Middle East & Africa
- 5.6.5. Asia Pacific
- 6. Global Water Soluble Fertilizer Industry Analysis, Insights and Forecast, 2021-2033
- 6.1. Market Analysis, Insights and Forecast - by Production Analysis
- 6.2. Market Analysis, Insights and Forecast - by Consumption Analysis
- 6.3. Market Analysis, Insights and Forecast - by Import Market Analysis (Value & Volume)
- 6.4. Market Analysis, Insights and Forecast - by Export Market Analysis (Value & Volume)
- 6.5. Market Analysis, Insights and Forecast - by Price Trend Analysis
- 7. North America Water Soluble Fertilizer Industry Analysis, Insights and Forecast, 2020-2032
- 7.1. Market Analysis, Insights and Forecast - by Production Analysis
- 7.2. Market Analysis, Insights and Forecast - by Consumption Analysis
- 7.3. Market Analysis, Insights and Forecast - by Import Market Analysis (Value & Volume)
- 7.4. Market Analysis, Insights and Forecast - by Export Market Analysis (Value & Volume)
- 7.5. Market Analysis, Insights and Forecast - by Price Trend Analysis
- 8. South America Water Soluble Fertilizer Industry Analysis, Insights and Forecast, 2020-2032
- 8.1. Market Analysis, Insights and Forecast - by Production Analysis
- 8.2. Market Analysis, Insights and Forecast - by Consumption Analysis
- 8.3. Market Analysis, Insights and Forecast - by Import Market Analysis (Value & Volume)
- 8.4. Market Analysis, Insights and Forecast - by Export Market Analysis (Value & Volume)
- 8.5. Market Analysis, Insights and Forecast - by Price Trend Analysis
- 9. Europe Water Soluble Fertilizer Industry Analysis, Insights and Forecast, 2020-2032
- 9.1. Market Analysis, Insights and Forecast - by Production Analysis
- 9.2. Market Analysis, Insights and Forecast - by Consumption Analysis
- 9.3. Market Analysis, Insights and Forecast - by Import Market Analysis (Value & Volume)
- 9.4. Market Analysis, Insights and Forecast - by Export Market Analysis (Value & Volume)
- 9.5. Market Analysis, Insights and Forecast - by Price Trend Analysis
- 10. Middle East & Africa Water Soluble Fertilizer Industry Analysis, Insights and Forecast, 2020-2032
- 10.1. Market Analysis, Insights and Forecast - by Production Analysis
- 10.2. Market Analysis, Insights and Forecast - by Consumption Analysis
- 10.3. Market Analysis, Insights and Forecast - by Import Market Analysis (Value & Volume)
- 10.4. Market Analysis, Insights and Forecast - by Export Market Analysis (Value & Volume)
- 10.5. Market Analysis, Insights and Forecast - by Price Trend Analysis
- 11. Asia Pacific Water Soluble Fertilizer Industry Analysis, Insights and Forecast, 2020-2032
- 11.1. Market Analysis, Insights and Forecast - by Production Analysis
- 11.2. Market Analysis, Insights and Forecast - by Consumption Analysis
- 11.3. Market Analysis, Insights and Forecast - by Import Market Analysis (Value & Volume)
- 11.4. Market Analysis, Insights and Forecast - by Export Market Analysis (Value & Volume)
- 11.5. Market Analysis, Insights and Forecast - by Price Trend Analysis
- 12. Competitive Analysis
- 12.1. Company Profiles
- 12.1.1 Coromandel International Ltd
- 12.1.1.1. Company Overview
- 12.1.1.2. Products
- 12.1.1.3. Company Financials
- 12.1.1.4. SWOT Analysis
- 12.1.2 Haifa Group
- 12.1.2.1. Company Overview
- 12.1.2.2. Products
- 12.1.2.3. Company Financials
- 12.1.2.4. SWOT Analysis
- 12.1.3 Indian Farmers Fertiliser Cooperative Limited
- 12.1.3.1. Company Overview
- 12.1.3.2. Products
- 12.1.3.3. Company Financials
- 12.1.3.4. SWOT Analysis
- 12.1.4 Grupa Azoty S A (Compo Expert)
- 12.1.4.1. Company Overview
- 12.1.4.2. Products
- 12.1.4.3. Company Financials
- 12.1.4.4. SWOT Analysis
- 12.1.5 K+S Aktiengesellschaft
- 12.1.5.1. Company Overview
- 12.1.5.2. Products
- 12.1.5.3. Company Financials
- 12.1.5.4. SWOT Analysis
- 12.1.6 Yara International AS
- 12.1.6.1. Company Overview
- 12.1.6.2. Products
- 12.1.6.3. Company Financials
- 12.1.6.4. SWOT Analysis
- 12.1.7 ICL Group Ltd
- 12.1.7.1. Company Overview
- 12.1.7.2. Products
- 12.1.7.3. Company Financials
- 12.1.7.4. SWOT Analysis
- 12.1.8 BMS Micro-Nutrients NV
- 12.1.8.1. Company Overview
- 12.1.8.2. Products
- 12.1.8.3. Company Financials
- 12.1.8.4. SWOT Analysis
- 12.1.9 Sociedad Quimica y Minera de Chile SA
- 12.1.9.1. Company Overview
- 12.1.9.2. Products
- 12.1.9.3. Company Financials
- 12.1.9.4. SWOT Analysis
- 12.1.1 Coromandel International Ltd
- 12.2. Market Entropy
- 12.2.1 Company's Key Areas Served
- 12.2.2 Recent Developments
- 12.3. Company Market Share Analysis 2025
- 12.3.1 Top 5 Companies Market Share Analysis
- 12.3.2 Top 3 Companies Market Share Analysis
- 12.4. List of Potential Customers
- 13. Research Methodology
List of Figures
- Figure 1: Global Water Soluble Fertilizer Industry Revenue Breakdown (Million, %) by Region 2025 & 2033
- Figure 2: North America Water Soluble Fertilizer Industry Revenue (Million), by Production Analysis 2025 & 2033
- Figure 3: North America Water Soluble Fertilizer Industry Revenue Share (%), by Production Analysis 2025 & 2033
- Figure 4: North America Water Soluble Fertilizer Industry Revenue (Million), by Consumption Analysis 2025 & 2033
- Figure 5: North America Water Soluble Fertilizer Industry Revenue Share (%), by Consumption Analysis 2025 & 2033
- Figure 6: North America Water Soluble Fertilizer Industry Revenue (Million), by Import Market Analysis (Value & Volume) 2025 & 2033
- Figure 7: North America Water Soluble Fertilizer Industry Revenue Share (%), by Import Market Analysis (Value & Volume) 2025 & 2033
- Figure 8: North America Water Soluble Fertilizer Industry Revenue (Million), by Export Market Analysis (Value & Volume) 2025 & 2033
- Figure 9: North America Water Soluble Fertilizer Industry Revenue Share (%), by Export Market Analysis (Value & Volume) 2025 & 2033
- Figure 10: North America Water Soluble Fertilizer Industry Revenue (Million), by Price Trend Analysis 2025 & 2033
- Figure 11: North America Water Soluble Fertilizer Industry Revenue Share (%), by Price Trend Analysis 2025 & 2033
- Figure 12: North America Water Soluble Fertilizer Industry Revenue (Million), by Country 2025 & 2033
- Figure 13: North America Water Soluble Fertilizer Industry Revenue Share (%), by Country 2025 & 2033
- Figure 14: South America Water Soluble Fertilizer Industry Revenue (Million), by Production Analysis 2025 & 2033
- Figure 15: South America Water Soluble Fertilizer Industry Revenue Share (%), by Production Analysis 2025 & 2033
- Figure 16: South America Water Soluble Fertilizer Industry Revenue (Million), by Consumption Analysis 2025 & 2033
- Figure 17: South America Water Soluble Fertilizer Industry Revenue Share (%), by Consumption Analysis 2025 & 2033
- Figure 18: South America Water Soluble Fertilizer Industry Revenue (Million), by Import Market Analysis (Value & Volume) 2025 & 2033
- Figure 19: South America Water Soluble Fertilizer Industry Revenue Share (%), by Import Market Analysis (Value & Volume) 2025 & 2033
- Figure 20: South America Water Soluble Fertilizer Industry Revenue (Million), by Export Market Analysis (Value & Volume) 2025 & 2033
- Figure 21: South America Water Soluble Fertilizer Industry Revenue Share (%), by Export Market Analysis (Value & Volume) 2025 & 2033
- Figure 22: South America Water Soluble Fertilizer Industry Revenue (Million), by Price Trend Analysis 2025 & 2033
- Figure 23: South America Water Soluble Fertilizer Industry Revenue Share (%), by Price Trend Analysis 2025 & 2033
- Figure 24: South America Water Soluble Fertilizer Industry Revenue (Million), by Country 2025 & 2033
- Figure 25: South America Water Soluble Fertilizer Industry Revenue Share (%), by Country 2025 & 2033
- Figure 26: Europe Water Soluble Fertilizer Industry Revenue (Million), by Production Analysis 2025 & 2033
- Figure 27: Europe Water Soluble Fertilizer Industry Revenue Share (%), by Production Analysis 2025 & 2033
- Figure 28: Europe Water Soluble Fertilizer Industry Revenue (Million), by Consumption Analysis 2025 & 2033
- Figure 29: Europe Water Soluble Fertilizer Industry Revenue Share (%), by Consumption Analysis 2025 & 2033
- Figure 30: Europe Water Soluble Fertilizer Industry Revenue (Million), by Import Market Analysis (Value & Volume) 2025 & 2033
- Figure 31: Europe Water Soluble Fertilizer Industry Revenue Share (%), by Import Market Analysis (Value & Volume) 2025 & 2033
- Figure 32: Europe Water Soluble Fertilizer Industry Revenue (Million), by Export Market Analysis (Value & Volume) 2025 & 2033
- Figure 33: Europe Water Soluble Fertilizer Industry Revenue Share (%), by Export Market Analysis (Value & Volume) 2025 & 2033
- Figure 34: Europe Water Soluble Fertilizer Industry Revenue (Million), by Price Trend Analysis 2025 & 2033
- Figure 35: Europe Water Soluble Fertilizer Industry Revenue Share (%), by Price Trend Analysis 2025 & 2033
- Figure 36: Europe Water Soluble Fertilizer Industry Revenue (Million), by Country 2025 & 2033
- Figure 37: Europe Water Soluble Fertilizer Industry Revenue Share (%), by Country 2025 & 2033
- Figure 38: Middle East & Africa Water Soluble Fertilizer Industry Revenue (Million), by Production Analysis 2025 & 2033
- Figure 39: Middle East & Africa Water Soluble Fertilizer Industry Revenue Share (%), by Production Analysis 2025 & 2033
- Figure 40: Middle East & Africa Water Soluble Fertilizer Industry Revenue (Million), by Consumption Analysis 2025 & 2033
- Figure 41: Middle East & Africa Water Soluble Fertilizer Industry Revenue Share (%), by Consumption Analysis 2025 & 2033
- Figure 42: Middle East & Africa Water Soluble Fertilizer Industry Revenue (Million), by Import Market Analysis (Value & Volume) 2025 & 2033
- Figure 43: Middle East & Africa Water Soluble Fertilizer Industry Revenue Share (%), by Import Market Analysis (Value & Volume) 2025 & 2033
- Figure 44: Middle East & Africa Water Soluble Fertilizer Industry Revenue (Million), by Export Market Analysis (Value & Volume) 2025 & 2033
- Figure 45: Middle East & Africa Water Soluble Fertilizer Industry Revenue Share (%), by Export Market Analysis (Value & Volume) 2025 & 2033
- Figure 46: Middle East & Africa Water Soluble Fertilizer Industry Revenue (Million), by Price Trend Analysis 2025 & 2033
- Figure 47: Middle East & Africa Water Soluble Fertilizer Industry Revenue Share (%), by Price Trend Analysis 2025 & 2033
- Figure 48: Middle East & Africa Water Soluble Fertilizer Industry Revenue (Million), by Country 2025 & 2033
- Figure 49: Middle East & Africa Water Soluble Fertilizer Industry Revenue Share (%), by Country 2025 & 2033
- Figure 50: Asia Pacific Water Soluble Fertilizer Industry Revenue (Million), by Production Analysis 2025 & 2033
- Figure 51: Asia Pacific Water Soluble Fertilizer Industry Revenue Share (%), by Production Analysis 2025 & 2033
- Figure 52: Asia Pacific Water Soluble Fertilizer Industry Revenue (Million), by Consumption Analysis 2025 & 2033
- Figure 53: Asia Pacific Water Soluble Fertilizer Industry Revenue Share (%), by Consumption Analysis 2025 & 2033
- Figure 54: Asia Pacific Water Soluble Fertilizer Industry Revenue (Million), by Import Market Analysis (Value & Volume) 2025 & 2033
- Figure 55: Asia Pacific Water Soluble Fertilizer Industry Revenue Share (%), by Import Market Analysis (Value & Volume) 2025 & 2033
- Figure 56: Asia Pacific Water Soluble Fertilizer Industry Revenue (Million), by Export Market Analysis (Value & Volume) 2025 & 2033
- Figure 57: Asia Pacific Water Soluble Fertilizer Industry Revenue Share (%), by Export Market Analysis (Value & Volume) 2025 & 2033
- Figure 58: Asia Pacific Water Soluble Fertilizer Industry Revenue (Million), by Price Trend Analysis 2025 & 2033
- Figure 59: Asia Pacific Water Soluble Fertilizer Industry Revenue Share (%), by Price Trend Analysis 2025 & 2033
- Figure 60: Asia Pacific Water Soluble Fertilizer Industry Revenue (Million), by Country 2025 & 2033
- Figure 61: Asia Pacific Water Soluble Fertilizer Industry Revenue Share (%), by Country 2025 & 2033
List of Tables
- Table 1: Global Water Soluble Fertilizer Industry Revenue Million Forecast, by Production Analysis 2020 & 2033
- Table 2: Global Water Soluble Fertilizer Industry Revenue Million Forecast, by Consumption Analysis 2020 & 2033
- Table 3: Global Water Soluble Fertilizer Industry Revenue Million Forecast, by Import Market Analysis (Value & Volume) 2020 & 2033
- Table 4: Global Water Soluble Fertilizer Industry Revenue Million Forecast, by Export Market Analysis (Value & Volume) 2020 & 2033
- Table 5: Global Water Soluble Fertilizer Industry Revenue Million Forecast, by Price Trend Analysis 2020 & 2033
- Table 6: Global Water Soluble Fertilizer Industry Revenue Million Forecast, by Region 2020 & 2033
- Table 7: Global Water Soluble Fertilizer Industry Revenue Million Forecast, by Production Analysis 2020 & 2033
- Table 8: Global Water Soluble Fertilizer Industry Revenue Million Forecast, by Consumption Analysis 2020 & 2033
- Table 9: Global Water Soluble Fertilizer Industry Revenue Million Forecast, by Import Market Analysis (Value & Volume) 2020 & 2033
- Table 10: Global Water Soluble Fertilizer Industry Revenue Million Forecast, by Export Market Analysis (Value & Volume) 2020 & 2033
- Table 11: Global Water Soluble Fertilizer Industry Revenue Million Forecast, by Price Trend Analysis 2020 & 2033
- Table 12: Global Water Soluble Fertilizer Industry Revenue Million Forecast, by Country 2020 & 2033
- Table 13: United States Water Soluble Fertilizer Industry Revenue (Million) Forecast, by Application 2020 & 2033
- Table 14: Canada Water Soluble Fertilizer Industry Revenue (Million) Forecast, by Application 2020 & 2033
- Table 15: Mexico Water Soluble Fertilizer Industry Revenue (Million) Forecast, by Application 2020 & 2033
- Table 16: Global Water Soluble Fertilizer Industry Revenue Million Forecast, by Production Analysis 2020 & 2033
- Table 17: Global Water Soluble Fertilizer Industry Revenue Million Forecast, by Consumption Analysis 2020 & 2033
- Table 18: Global Water Soluble Fertilizer Industry Revenue Million Forecast, by Import Market Analysis (Value & Volume) 2020 & 2033
- Table 19: Global Water Soluble Fertilizer Industry Revenue Million Forecast, by Export Market Analysis (Value & Volume) 2020 & 2033
- Table 20: Global Water Soluble Fertilizer Industry Revenue Million Forecast, by Price Trend Analysis 2020 & 2033
- Table 21: Global Water Soluble Fertilizer Industry Revenue Million Forecast, by Country 2020 & 2033
- Table 22: Brazil Water Soluble Fertilizer Industry Revenue (Million) Forecast, by Application 2020 & 2033
- Table 23: Argentina Water Soluble Fertilizer Industry Revenue (Million) Forecast, by Application 2020 & 2033
- Table 24: Rest of South America Water Soluble Fertilizer Industry Revenue (Million) Forecast, by Application 2020 & 2033
- Table 25: Global Water Soluble Fertilizer Industry Revenue Million Forecast, by Production Analysis 2020 & 2033
- Table 26: Global Water Soluble Fertilizer Industry Revenue Million Forecast, by Consumption Analysis 2020 & 2033
- Table 27: Global Water Soluble Fertilizer Industry Revenue Million Forecast, by Import Market Analysis (Value & Volume) 2020 & 2033
- Table 28: Global Water Soluble Fertilizer Industry Revenue Million Forecast, by Export Market Analysis (Value & Volume) 2020 & 2033
- Table 29: Global Water Soluble Fertilizer Industry Revenue Million Forecast, by Price Trend Analysis 2020 & 2033
- Table 30: Global Water Soluble Fertilizer Industry Revenue Million Forecast, by Country 2020 & 2033
- Table 31: United Kingdom Water Soluble Fertilizer Industry Revenue (Million) Forecast, by Application 2020 & 2033
- Table 32: Germany Water Soluble Fertilizer Industry Revenue (Million) Forecast, by Application 2020 & 2033
- Table 33: France Water Soluble Fertilizer Industry Revenue (Million) Forecast, by Application 2020 & 2033
- Table 34: Italy Water Soluble Fertilizer Industry Revenue (Million) Forecast, by Application 2020 & 2033
- Table 35: Spain Water Soluble Fertilizer Industry Revenue (Million) Forecast, by Application 2020 & 2033
- Table 36: Russia Water Soluble Fertilizer Industry Revenue (Million) Forecast, by Application 2020 & 2033
- Table 37: Benelux Water Soluble Fertilizer Industry Revenue (Million) Forecast, by Application 2020 & 2033
- Table 38: Nordics Water Soluble Fertilizer Industry Revenue (Million) Forecast, by Application 2020 & 2033
- Table 39: Rest of Europe Water Soluble Fertilizer Industry Revenue (Million) Forecast, by Application 2020 & 2033
- Table 40: Global Water Soluble Fertilizer Industry Revenue Million Forecast, by Production Analysis 2020 & 2033
- Table 41: Global Water Soluble Fertilizer Industry Revenue Million Forecast, by Consumption Analysis 2020 & 2033
- Table 42: Global Water Soluble Fertilizer Industry Revenue Million Forecast, by Import Market Analysis (Value & Volume) 2020 & 2033
- Table 43: Global Water Soluble Fertilizer Industry Revenue Million Forecast, by Export Market Analysis (Value & Volume) 2020 & 2033
- Table 44: Global Water Soluble Fertilizer Industry Revenue Million Forecast, by Price Trend Analysis 2020 & 2033
- Table 45: Global Water Soluble Fertilizer Industry Revenue Million Forecast, by Country 2020 & 2033
- Table 46: Turkey Water Soluble Fertilizer Industry Revenue (Million) Forecast, by Application 2020 & 2033
- Table 47: Israel Water Soluble Fertilizer Industry Revenue (Million) Forecast, by Application 2020 & 2033
- Table 48: GCC Water Soluble Fertilizer Industry Revenue (Million) Forecast, by Application 2020 & 2033
- Table 49: North Africa Water Soluble Fertilizer Industry Revenue (Million) Forecast, by Application 2020 & 2033
- Table 50: South Africa Water Soluble Fertilizer Industry Revenue (Million) Forecast, by Application 2020 & 2033
- Table 51: Rest of Middle East & Africa Water Soluble Fertilizer Industry Revenue (Million) Forecast, by Application 2020 & 2033
- Table 52: Global Water Soluble Fertilizer Industry Revenue Million Forecast, by Production Analysis 2020 & 2033
- Table 53: Global Water Soluble Fertilizer Industry Revenue Million Forecast, by Consumption Analysis 2020 & 2033
- Table 54: Global Water Soluble Fertilizer Industry Revenue Million Forecast, by Import Market Analysis (Value & Volume) 2020 & 2033
- Table 55: Global Water Soluble Fertilizer Industry Revenue Million Forecast, by Export Market Analysis (Value & Volume) 2020 & 2033
- Table 56: Global Water Soluble Fertilizer Industry Revenue Million Forecast, by Price Trend Analysis 2020 & 2033
- Table 57: Global Water Soluble Fertilizer Industry Revenue Million Forecast, by Country 2020 & 2033
- Table 58: China Water Soluble Fertilizer Industry Revenue (Million) Forecast, by Application 2020 & 2033
- Table 59: India Water Soluble Fertilizer Industry Revenue (Million) Forecast, by Application 2020 & 2033
- Table 60: Japan Water Soluble Fertilizer Industry Revenue (Million) Forecast, by Application 2020 & 2033
- Table 61: South Korea Water Soluble Fertilizer Industry Revenue (Million) Forecast, by Application 2020 & 2033
- Table 62: ASEAN Water Soluble Fertilizer Industry Revenue (Million) Forecast, by Application 2020 & 2033
- Table 63: Oceania Water Soluble Fertilizer Industry Revenue (Million) Forecast, by Application 2020 & 2033
- Table 64: Rest of Asia Pacific Water Soluble Fertilizer Industry Revenue (Million) Forecast, by Application 2020 & 2033
Frequently Asked Questions
1. What is the projected Compound Annual Growth Rate (CAGR) of the Water Soluble Fertilizer Industry?
The projected CAGR is approximately 3.80%.
2. Which companies are prominent players in the Water Soluble Fertilizer Industry?
Key companies in the market include Coromandel International Ltd, Haifa Group, Indian Farmers Fertiliser Cooperative Limited, Grupa Azoty S A (Compo Expert), K+S Aktiengesellschaft, Yara International AS, ICL Group Ltd, BMS Micro-Nutrients NV, Sociedad Quimica y Minera de Chile SA.
3. What are the main segments of the Water Soluble Fertilizer Industry?
The market segments include Production Analysis, Consumption Analysis, Import Market Analysis (Value & Volume), Export Market Analysis (Value & Volume), Price Trend Analysis.
4. Can you provide details about the market size?
The market size is estimated to be USD XX Million as of 2022.
5. What are some drivers contributing to market growth?
Adoption of Organic and Eco-friendly Farming Practices; Declining Area of Arable Land and Rising Food Security Concerns.
6. What are the notable trends driving market growth?
OTHER KEY INDUSTRY TRENDS COVERED IN THE REPORT.
7. Are there any restraints impacting market growth?
High Demand for Conventional and Synthetic Products; Lack of Awareness and Other Factors Limiting the Adoption of Agricultural Inoculants.
8. Can you provide examples of recent developments in the market?
April 2023: K+S acquired a 75% share of the fertilizer business of South African trading company Industrial Commodities Holdings (Pty) Ltd (ICH). In addition to expanding the core business, K+S is strengthening its operations in southern and eastern Africa as a result of this acquisition. The newly acquired fertilizer business in the future to be operated in a joint venture, under the name of FertivPty Ltd.May 2022: ICL launched three new NPK formulations of Solinure, a product with increased trace elements to optimize yields.May 2022: ICL signed an agreement with customers in India and China to supply 600,000 and 700,000 metric tons of potash, respectively, in 2022 at USD 590 per ton.
9. What pricing options are available for accessing the report?
Pricing options include single-user, multi-user, and enterprise licenses priced at USD 3800, USD 4500, and USD 5800 respectively.
10. Is the market size provided in terms of value or volume?
The market size is provided in terms of value, measured in Million.
11. Are there any specific market keywords associated with the report?
Yes, the market keyword associated with the report is "Water Soluble Fertilizer Industry," which aids in identifying and referencing the specific market segment covered.
12. How do I determine which pricing option suits my needs best?
The pricing options vary based on user requirements and access needs. Individual users may opt for single-user licenses, while businesses requiring broader access may choose multi-user or enterprise licenses for cost-effective access to the report.
13. Are there any additional resources or data provided in the Water Soluble Fertilizer Industry report?
While the report offers comprehensive insights, it's advisable to review the specific contents or supplementary materials provided to ascertain if additional resources or data are available.
14. How can I stay updated on further developments or reports in the Water Soluble Fertilizer Industry?
To stay informed about further developments, trends, and reports in the Water Soluble Fertilizer Industry, consider subscribing to industry newsletters, following relevant companies and organizations, or regularly checking reputable industry news sources and publications.
Methodology
Step 1 - Identification of Relevant Samples Size from Population Database


Step 2 - Approaches for Defining Global Market Size (Value, Volume* & Price*)

Note*: In applicable scenarios
Step 3 - Data Sources
Primary Research
- Web Analytics
- Survey Reports
- Research Institute
- Latest Research Reports
- Opinion Leaders
Secondary Research
- Annual Reports
- White Paper
- Latest Press Release
- Industry Association
- Paid Database
- Investor Presentations

Step 4 - Data Triangulation
Involves using different sources of information in order to increase the validity of a study
These sources are likely to be stakeholders in a program - participants, other researchers, program staff, other community members, and so on.
Then we put all data in single framework & apply various statistical tools to find out the dynamic on the market.
During the analysis stage, feedback from the stakeholder groups would be compared to determine areas of agreement as well as areas of divergence