

Key Insights
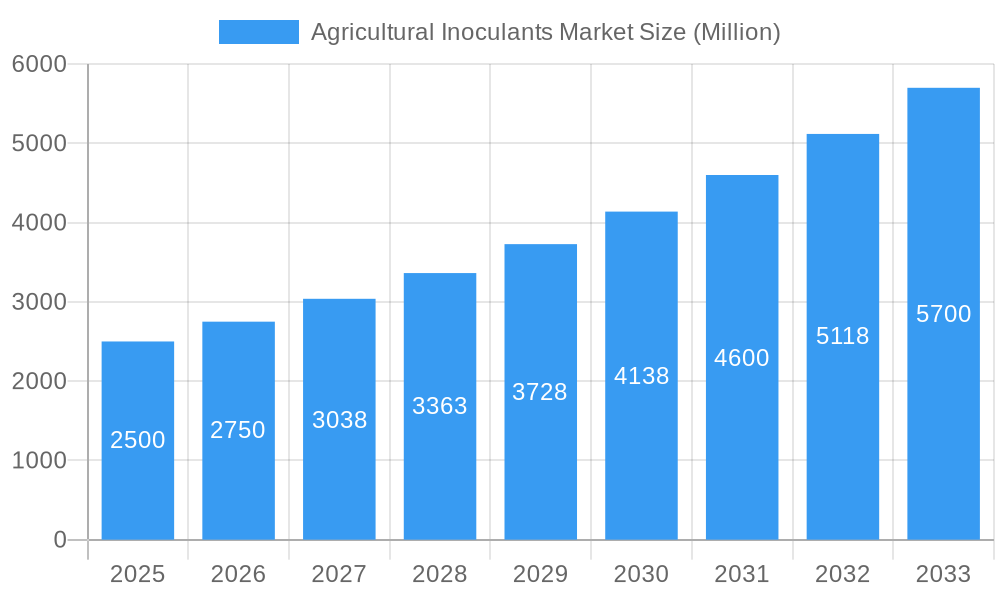
The global agricultural inoculants market is experiencing robust growth, driven by the increasing demand for sustainable and eco-friendly agricultural practices. The market, valued at approximately $2.5 billion in 2025, is projected to exhibit a compound annual growth rate (CAGR) of 10.5% from 2025 to 2033, reaching an estimated market value exceeding $6 billion by 2033. This expansion is fueled by several key factors, including the rising global population and its consequent need for enhanced food production, the growing awareness of the environmental impact of chemical fertilizers, and the increasing adoption of precision agriculture techniques. Specific segments within the market are exhibiting particularly strong growth. For instance, the demand for bacterial inoculants, used for enhancing nutrient uptake and promoting plant health, is surging. Similarly, seed inoculation methods are gaining popularity due to their efficiency and cost-effectiveness compared to soil inoculation. Geographically, the Asia-Pacific region, with its large agricultural sector and rapidly growing economies, is expected to be a significant contributor to market growth. However, challenges such as the high initial investment costs associated with inoculant adoption and the dependence on favorable climatic conditions for optimal efficacy might act as potential restraints on market growth.
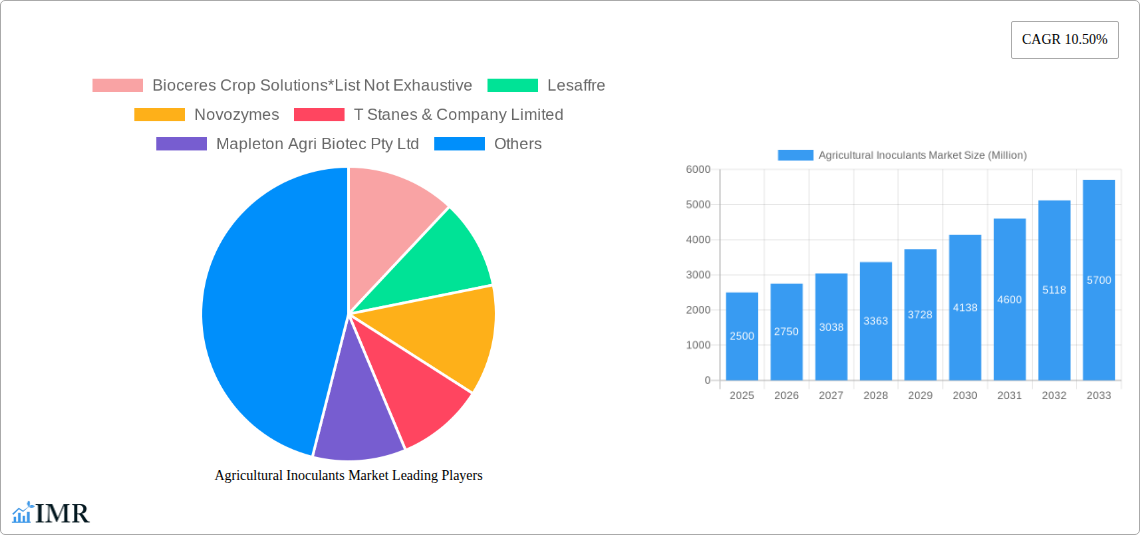
Agricultural Inoculants Market Market Size (In Billion)
The competitive landscape is characterized by a mix of large multinational corporations and smaller specialized companies. Leading players like BASF, Novozymes, and Bioceres Crop Solutions are investing heavily in research and development to create innovative inoculant products and expand their market presence. The market is witnessing increased mergers and acquisitions, strategic partnerships, and the introduction of advanced technologies such as microbiome engineering and precision application methods, further accelerating market growth. Furthermore, government initiatives promoting sustainable agriculture and providing incentives for adopting bio-based solutions are playing a crucial role in shaping the market trajectory. The long-term outlook for the agricultural inoculants market remains highly positive, with continuous innovation and supportive regulatory frameworks expected to drive its expansion in the coming years.
Agricultural Inoculants Market Company Market Share
Agricultural Inoculants Market: A Comprehensive Report (2019-2033)
This comprehensive report provides an in-depth analysis of the Agricultural Inoculants Market, encompassing market dynamics, growth trends, regional insights, product landscape, key players, and future outlook. The study period covers 2019-2033, with 2025 as the base year and a forecast period of 2025-2033. The report segments the market by function (Crop Nutrition, Crop Protection), microorganism (Bacteria, Fungi, Other Microorganisms), mode of application (Seed Inoculation, Soil Inoculation), and crop type (Grains and Cereals, Pulses and Oilseeds, Commercial Crops, Fruits and Vegetables, Other Applications). The market size is presented in million units.
Agricultural Inoculants Market Dynamics & Structure
The Agricultural Inoculants market is experiencing significant growth driven by the increasing demand for sustainable and eco-friendly agricultural practices. Market concentration is moderate, with several key players holding substantial market share, while numerous smaller companies cater to niche segments. Technological innovations, particularly in microbial strain development and formulation technologies, are major growth drivers. Regulatory frameworks, varying across regions, influence market access and product approvals. Competitive substitutes include chemical fertilizers and pesticides, but the growing awareness of environmental concerns and the benefits of enhanced crop yields are shifting the preference towards bio-based solutions. End-user demographics include large-scale commercial farms, smallholder farmers, and specialized agricultural operations. M&A activities are frequent, reflecting the consolidation trend within the industry.
- Market Concentration: Moderate, with top 5 players holding approximately xx% market share in 2025.
- Technological Innovation: Focus on improving efficacy, shelf life, and ease of application of inoculants.
- Regulatory Landscape: Varies significantly across regions, impacting product registration and market access.
- Competitive Substitutes: Chemical fertilizers and pesticides, facing increasing pressure from environmental concerns.
- M&A Activity: xx deals recorded between 2019 and 2024, indicating industry consolidation.
- Innovation Barriers: High R&D costs, complex regulatory approvals, and challenges in scaling up production.
Agricultural Inoculants Market Growth Trends & Insights
The Agricultural Inoculants market exhibits a robust growth trajectory, driven by increasing awareness of the environmental benefits of sustainable agriculture and the need to enhance crop yields in the face of growing global food demand. The market size is projected to reach xx million units by 2033, registering a CAGR of xx% during the forecast period (2025-2033). Adoption rates are increasing, particularly in regions with favorable government policies and supportive infrastructure. Technological disruptions, including advancements in microbial engineering and formulation technologies, are significantly enhancing product efficacy and expanding application possibilities. Shifting consumer preferences towards naturally produced food are further propelling market expansion.
(Note: This section requires XXX data to be populated with specific metrics and further detailed analysis.)
Dominant Regions, Countries, or Segments in Agricultural Inoculants Market
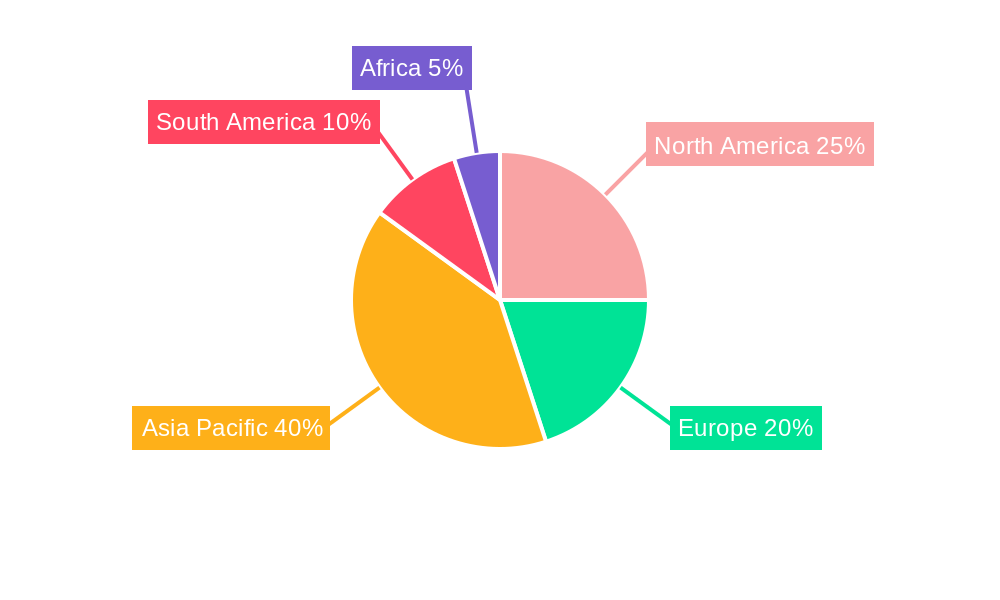
North America and Europe currently dominate the Agricultural Inoculants market, driven by high adoption rates, advanced agricultural practices, and stringent environmental regulations. However, Asia-Pacific is poised for significant growth due to its vast agricultural sector and increasing awareness of sustainable agriculture.
Leading Segments:
- Function: Crop Nutrition holds the largest market share, followed by Crop Protection.
- Microorganism: Bacteria segment dominates due to wider application and established efficacy.
- Mode of Application: Seed Inoculation is the preferred method due to its ease of application and cost-effectiveness.
- Crop Type: Grains and Cereals segment accounts for the largest share, followed by Pulses and Oilseeds.
Key Drivers:
- Government policies: Subsidies and incentives promoting sustainable agriculture.
- Infrastructure development: Investments in irrigation systems and improved agricultural practices.
- Technological advancements: Improved formulations and enhanced efficacy of inoculants.
- Growing awareness: Increased consumer preference for sustainable and organically produced food.
(Note: This section requires further detailed analysis and data to populate market share and growth potential.)
Agricultural Inoculants Market Product Landscape
The Agricultural Inoculants market offers a diverse range of products, tailored to specific crops and application methods. Innovations focus on enhancing microbial efficacy, extending shelf life, and improving ease of application. Products are differentiated by microbial strains, formulation types, and target crops. Unique selling propositions often emphasize enhanced nutrient uptake, improved stress tolerance, and increased crop yields. Recent advancements include the development of consortia inoculants containing multiple beneficial microorganisms for synergistic effects.
Key Drivers, Barriers & Challenges in Agricultural Inoculants Market
Key Drivers:
- Growing demand for sustainable agriculture.
- Rising awareness of environmental concerns related to chemical fertilizers and pesticides.
- Increased focus on improving crop yields and food security.
- Technological advancements leading to more effective and efficient inoculants.
Key Barriers and Challenges:
- High R&D costs and long product development timelines.
- Complex regulatory approval processes that vary significantly across regions.
- Competition from established chemical fertilizer and pesticide manufacturers.
- Challenges in maintaining the viability and efficacy of inoculants during storage and transportation.
- Supply chain disruptions impacting the availability of raw materials. This has resulted in a xx% increase in inoculant prices in some regions in 2024.
Emerging Opportunities in Agricultural Inoculants Market
Emerging opportunities include:
- Expanding into untapped markets, particularly in developing economies with large agricultural sectors.
- Developing inoculants for specialty crops and high-value agricultural products.
- Utilizing advanced technologies, such as CRISPR-Cas9 gene editing, to improve microbial strains.
- Creating customized inoculant solutions tailored to specific soil and climatic conditions.
- Collaborating with agricultural input suppliers and distributors to expand market reach.
Growth Accelerators in the Agricultural Inoculants Market Industry
Long-term growth will be driven by technological breakthroughs in microbial engineering, leading to more effective and robust inoculants. Strategic partnerships between inoculant manufacturers and agricultural companies will facilitate wider market adoption. Expansion into new geographical markets, especially in regions with high agricultural potential and growing demand for sustainable practices, will further fuel market expansion.
Key Players Shaping the Agricultural Inoculants Market Market
- Bioceres Crop Solutions
- Lesaffre
- Novozymes
- T Stanes & Company Limited
- Mapleton Agri Biotec Pty Ltd
- New Edge Microbials Pty Ltd
- AEA Investors (Verdesian Life Sciences LLC)
- Premier Tech
- Lallemond Inc
- BASF SE
Notable Milestones in Agricultural Inoculants Market Sector
- September 2021: Novozymes launched three biological inoculants (BioniQ, TagTeam BioniQPro, and TagTeam BioniQChickpea) in the United States.
- September 2022: Syngenta Seedcare and Bioceres Crop Solutions partnered to commercialize Bioceres' biological seed treatments globally (excluding Argentina).
- January 2023: Verdesian Life Science launched Accolade, a biological growth enhancement liquid containing Azospirillum brasilense.
In-Depth Agricultural Inoculants Market Market Outlook
The Agricultural Inoculants market presents significant long-term growth potential, driven by increasing demand for sustainable agriculture, technological advancements, and favorable government policies. Strategic investments in R&D, strategic partnerships, and expansion into emerging markets will be crucial for companies to capitalize on this growth opportunity. The market's future hinges on overcoming challenges related to cost-effectiveness, regulatory hurdles, and ensuring consistent product efficacy. The continued focus on sustainability and the increasing demand for enhanced crop yields will ensure robust growth in the coming years.
Agricultural Inoculants Market Segmentation
- 1. Production Analysis
- 2. Consumption Analysis
- 3. Import Market Analysis (Value & Volume)
- 4. Export Market Analysis (Value & Volume)
- 5. Price Trend Analysis
Agricultural Inoculants Market Segmentation By Geography
-
1. North America
- 1.1. United States
- 1.2. Canada
- 1.3. Mexico
-
2. South America
- 2.1. Brazil
- 2.2. Argentina
- 2.3. Rest of South America
-
3. Europe
- 3.1. United Kingdom
- 3.2. Germany
- 3.3. France
- 3.4. Italy
- 3.5. Spain
- 3.6. Russia
- 3.7. Benelux
- 3.8. Nordics
- 3.9. Rest of Europe
-
4. Middle East & Africa
- 4.1. Turkey
- 4.2. Israel
- 4.3. GCC
- 4.4. North Africa
- 4.5. South Africa
- 4.6. Rest of Middle East & Africa
-
5. Asia Pacific
- 5.1. China
- 5.2. India
- 5.3. Japan
- 5.4. South Korea
- 5.5. ASEAN
- 5.6. Oceania
- 5.7. Rest of Asia Pacific
Agricultural Inoculants Market Regional Market Share
Geographic Coverage of Agricultural Inoculants Market
Agricultural Inoculants Market REPORT HIGHLIGHTS
| Aspects | Details |
|---|---|
| Study Period | 2020-2034 |
| Base Year | 2025 |
| Estimated Year | 2026 |
| Forecast Period | 2026-2034 |
| Historical Period | 2020-2025 |
| Growth Rate | CAGR of 11% from 2020-2034 |
| Segmentation |
|
Table of Contents
- 1. Introduction
- 1.1. Research Scope
- 1.2. Market Segmentation
- 1.3. Research Objective
- 1.4. Definitions and Assumptions
- 2. Executive Summary
- 2.1. Market Snapshot
- 3. Market Dynamics
- 3.1. Market Drivers
- 3.2. Market Restrains
- 3.3. Market Trends
- 3.4. Market Opportunities
- 4. Market Factor Analysis
- 4.1. Porters Five Forces
- 4.1.1. Bargaining Power of Suppliers
- 4.1.2. Bargaining Power of Buyers
- 4.1.3. Threat of New Entrants
- 4.1.4. Threat of Substitutes
- 4.1.5. Competitive Rivalry
- 4.2. PESTEL analysis
- 4.3. BCG Analysis
- 4.3.1. Stars (High Growth, High Market Share)
- 4.3.2. Cash Cows (Low Growth, High Market Share)
- 4.3.3. Question Mark (High Growth, Low Market Share)
- 4.3.4. Dogs (Low Growth, Low Market Share)
- 4.4. Ansoff Matrix Analysis
- 4.5. Supply Chain Analysis
- 4.6. Regulatory Landscape
- 4.7. Current Market Potential and Opportunity Assessment (TAM–SAM–SOM Framework)
- 4.8. IMR Analyst Note
- 4.1. Porters Five Forces
- 5. Market Analysis, Insights and Forecast 2021-2033
- 5.1. Market Analysis, Insights and Forecast - by Production Analysis
- 5.2. Market Analysis, Insights and Forecast - by Consumption Analysis
- 5.3. Market Analysis, Insights and Forecast - by Import Market Analysis (Value & Volume)
- 5.4. Market Analysis, Insights and Forecast - by Export Market Analysis (Value & Volume)
- 5.5. Market Analysis, Insights and Forecast - by Price Trend Analysis
- 5.6. Market Analysis, Insights and Forecast - by Region
- 5.6.1. North America
- 5.6.2. South America
- 5.6.3. Europe
- 5.6.4. Middle East & Africa
- 5.6.5. Asia Pacific
- 6. Global Agricultural Inoculants Market Analysis, Insights and Forecast, 2021-2033
- 6.1. Market Analysis, Insights and Forecast - by Production Analysis
- 6.2. Market Analysis, Insights and Forecast - by Consumption Analysis
- 6.3. Market Analysis, Insights and Forecast - by Import Market Analysis (Value & Volume)
- 6.4. Market Analysis, Insights and Forecast - by Export Market Analysis (Value & Volume)
- 6.5. Market Analysis, Insights and Forecast - by Price Trend Analysis
- 7. North America Agricultural Inoculants Market Analysis, Insights and Forecast, 2020-2032
- 7.1. Market Analysis, Insights and Forecast - by Production Analysis
- 7.2. Market Analysis, Insights and Forecast - by Consumption Analysis
- 7.3. Market Analysis, Insights and Forecast - by Import Market Analysis (Value & Volume)
- 7.4. Market Analysis, Insights and Forecast - by Export Market Analysis (Value & Volume)
- 7.5. Market Analysis, Insights and Forecast - by Price Trend Analysis
- 8. South America Agricultural Inoculants Market Analysis, Insights and Forecast, 2020-2032
- 8.1. Market Analysis, Insights and Forecast - by Production Analysis
- 8.2. Market Analysis, Insights and Forecast - by Consumption Analysis
- 8.3. Market Analysis, Insights and Forecast - by Import Market Analysis (Value & Volume)
- 8.4. Market Analysis, Insights and Forecast - by Export Market Analysis (Value & Volume)
- 8.5. Market Analysis, Insights and Forecast - by Price Trend Analysis
- 9. Europe Agricultural Inoculants Market Analysis, Insights and Forecast, 2020-2032
- 9.1. Market Analysis, Insights and Forecast - by Production Analysis
- 9.2. Market Analysis, Insights and Forecast - by Consumption Analysis
- 9.3. Market Analysis, Insights and Forecast - by Import Market Analysis (Value & Volume)
- 9.4. Market Analysis, Insights and Forecast - by Export Market Analysis (Value & Volume)
- 9.5. Market Analysis, Insights and Forecast - by Price Trend Analysis
- 10. Middle East & Africa Agricultural Inoculants Market Analysis, Insights and Forecast, 2020-2032
- 10.1. Market Analysis, Insights and Forecast - by Production Analysis
- 10.2. Market Analysis, Insights and Forecast - by Consumption Analysis
- 10.3. Market Analysis, Insights and Forecast - by Import Market Analysis (Value & Volume)
- 10.4. Market Analysis, Insights and Forecast - by Export Market Analysis (Value & Volume)
- 10.5. Market Analysis, Insights and Forecast - by Price Trend Analysis
- 11. Asia Pacific Agricultural Inoculants Market Analysis, Insights and Forecast, 2020-2032
- 11.1. Market Analysis, Insights and Forecast - by Production Analysis
- 11.2. Market Analysis, Insights and Forecast - by Consumption Analysis
- 11.3. Market Analysis, Insights and Forecast - by Import Market Analysis (Value & Volume)
- 11.4. Market Analysis, Insights and Forecast - by Export Market Analysis (Value & Volume)
- 11.5. Market Analysis, Insights and Forecast - by Price Trend Analysis
- 12. Competitive Analysis
- 12.1. Company Profiles
- 12.1.1 Bioceres Crop Solutions*List Not Exhaustive
- 12.1.1.1. Company Overview
- 12.1.1.2. Products
- 12.1.1.3. Company Financials
- 12.1.1.4. SWOT Analysis
- 12.1.2 Lesaffre
- 12.1.2.1. Company Overview
- 12.1.2.2. Products
- 12.1.2.3. Company Financials
- 12.1.2.4. SWOT Analysis
- 12.1.3 Novozymes
- 12.1.3.1. Company Overview
- 12.1.3.2. Products
- 12.1.3.3. Company Financials
- 12.1.3.4. SWOT Analysis
- 12.1.4 T Stanes & Company Limited
- 12.1.4.1. Company Overview
- 12.1.4.2. Products
- 12.1.4.3. Company Financials
- 12.1.4.4. SWOT Analysis
- 12.1.5 Mapleton Agri Biotec Pty Ltd
- 12.1.5.1. Company Overview
- 12.1.5.2. Products
- 12.1.5.3. Company Financials
- 12.1.5.4. SWOT Analysis
- 12.1.6 New Edge Microbials Pty Ltd
- 12.1.6.1. Company Overview
- 12.1.6.2. Products
- 12.1.6.3. Company Financials
- 12.1.6.4. SWOT Analysis
- 12.1.7 AEA Investors (Verdesian Life Sciences LLC)
- 12.1.7.1. Company Overview
- 12.1.7.2. Products
- 12.1.7.3. Company Financials
- 12.1.7.4. SWOT Analysis
- 12.1.8 Premier Tech
- 12.1.8.1. Company Overview
- 12.1.8.2. Products
- 12.1.8.3. Company Financials
- 12.1.8.4. SWOT Analysis
- 12.1.9 Lallemond Inc
- 12.1.9.1. Company Overview
- 12.1.9.2. Products
- 12.1.9.3. Company Financials
- 12.1.9.4. SWOT Analysis
- 12.1.10 BASF SE
- 12.1.10.1. Company Overview
- 12.1.10.2. Products
- 12.1.10.3. Company Financials
- 12.1.10.4. SWOT Analysis
- 12.1.1 Bioceres Crop Solutions*List Not Exhaustive
- 12.2. Market Entropy
- 12.2.1 Company's Key Areas Served
- 12.2.2 Recent Developments
- 12.3. Company Market Share Analysis 2025
- 12.3.1 Top 5 Companies Market Share Analysis
- 12.3.2 Top 3 Companies Market Share Analysis
- 12.4. List of Potential Customers
- 13. Research Methodology
List of Figures
- Figure 1: Global Agricultural Inoculants Market Revenue Breakdown (billion, %) by Region 2025 & 2033
- Figure 2: North America Agricultural Inoculants Market Revenue (billion), by Production Analysis 2025 & 2033
- Figure 3: North America Agricultural Inoculants Market Revenue Share (%), by Production Analysis 2025 & 2033
- Figure 4: North America Agricultural Inoculants Market Revenue (billion), by Consumption Analysis 2025 & 2033
- Figure 5: North America Agricultural Inoculants Market Revenue Share (%), by Consumption Analysis 2025 & 2033
- Figure 6: North America Agricultural Inoculants Market Revenue (billion), by Import Market Analysis (Value & Volume) 2025 & 2033
- Figure 7: North America Agricultural Inoculants Market Revenue Share (%), by Import Market Analysis (Value & Volume) 2025 & 2033
- Figure 8: North America Agricultural Inoculants Market Revenue (billion), by Export Market Analysis (Value & Volume) 2025 & 2033
- Figure 9: North America Agricultural Inoculants Market Revenue Share (%), by Export Market Analysis (Value & Volume) 2025 & 2033
- Figure 10: North America Agricultural Inoculants Market Revenue (billion), by Price Trend Analysis 2025 & 2033
- Figure 11: North America Agricultural Inoculants Market Revenue Share (%), by Price Trend Analysis 2025 & 2033
- Figure 12: North America Agricultural Inoculants Market Revenue (billion), by Country 2025 & 2033
- Figure 13: North America Agricultural Inoculants Market Revenue Share (%), by Country 2025 & 2033
- Figure 14: South America Agricultural Inoculants Market Revenue (billion), by Production Analysis 2025 & 2033
- Figure 15: South America Agricultural Inoculants Market Revenue Share (%), by Production Analysis 2025 & 2033
- Figure 16: South America Agricultural Inoculants Market Revenue (billion), by Consumption Analysis 2025 & 2033
- Figure 17: South America Agricultural Inoculants Market Revenue Share (%), by Consumption Analysis 2025 & 2033
- Figure 18: South America Agricultural Inoculants Market Revenue (billion), by Import Market Analysis (Value & Volume) 2025 & 2033
- Figure 19: South America Agricultural Inoculants Market Revenue Share (%), by Import Market Analysis (Value & Volume) 2025 & 2033
- Figure 20: South America Agricultural Inoculants Market Revenue (billion), by Export Market Analysis (Value & Volume) 2025 & 2033
- Figure 21: South America Agricultural Inoculants Market Revenue Share (%), by Export Market Analysis (Value & Volume) 2025 & 2033
- Figure 22: South America Agricultural Inoculants Market Revenue (billion), by Price Trend Analysis 2025 & 2033
- Figure 23: South America Agricultural Inoculants Market Revenue Share (%), by Price Trend Analysis 2025 & 2033
- Figure 24: South America Agricultural Inoculants Market Revenue (billion), by Country 2025 & 2033
- Figure 25: South America Agricultural Inoculants Market Revenue Share (%), by Country 2025 & 2033
- Figure 26: Europe Agricultural Inoculants Market Revenue (billion), by Production Analysis 2025 & 2033
- Figure 27: Europe Agricultural Inoculants Market Revenue Share (%), by Production Analysis 2025 & 2033
- Figure 28: Europe Agricultural Inoculants Market Revenue (billion), by Consumption Analysis 2025 & 2033
- Figure 29: Europe Agricultural Inoculants Market Revenue Share (%), by Consumption Analysis 2025 & 2033
- Figure 30: Europe Agricultural Inoculants Market Revenue (billion), by Import Market Analysis (Value & Volume) 2025 & 2033
- Figure 31: Europe Agricultural Inoculants Market Revenue Share (%), by Import Market Analysis (Value & Volume) 2025 & 2033
- Figure 32: Europe Agricultural Inoculants Market Revenue (billion), by Export Market Analysis (Value & Volume) 2025 & 2033
- Figure 33: Europe Agricultural Inoculants Market Revenue Share (%), by Export Market Analysis (Value & Volume) 2025 & 2033
- Figure 34: Europe Agricultural Inoculants Market Revenue (billion), by Price Trend Analysis 2025 & 2033
- Figure 35: Europe Agricultural Inoculants Market Revenue Share (%), by Price Trend Analysis 2025 & 2033
- Figure 36: Europe Agricultural Inoculants Market Revenue (billion), by Country 2025 & 2033
- Figure 37: Europe Agricultural Inoculants Market Revenue Share (%), by Country 2025 & 2033
- Figure 38: Middle East & Africa Agricultural Inoculants Market Revenue (billion), by Production Analysis 2025 & 2033
- Figure 39: Middle East & Africa Agricultural Inoculants Market Revenue Share (%), by Production Analysis 2025 & 2033
- Figure 40: Middle East & Africa Agricultural Inoculants Market Revenue (billion), by Consumption Analysis 2025 & 2033
- Figure 41: Middle East & Africa Agricultural Inoculants Market Revenue Share (%), by Consumption Analysis 2025 & 2033
- Figure 42: Middle East & Africa Agricultural Inoculants Market Revenue (billion), by Import Market Analysis (Value & Volume) 2025 & 2033
- Figure 43: Middle East & Africa Agricultural Inoculants Market Revenue Share (%), by Import Market Analysis (Value & Volume) 2025 & 2033
- Figure 44: Middle East & Africa Agricultural Inoculants Market Revenue (billion), by Export Market Analysis (Value & Volume) 2025 & 2033
- Figure 45: Middle East & Africa Agricultural Inoculants Market Revenue Share (%), by Export Market Analysis (Value & Volume) 2025 & 2033
- Figure 46: Middle East & Africa Agricultural Inoculants Market Revenue (billion), by Price Trend Analysis 2025 & 2033
- Figure 47: Middle East & Africa Agricultural Inoculants Market Revenue Share (%), by Price Trend Analysis 2025 & 2033
- Figure 48: Middle East & Africa Agricultural Inoculants Market Revenue (billion), by Country 2025 & 2033
- Figure 49: Middle East & Africa Agricultural Inoculants Market Revenue Share (%), by Country 2025 & 2033
- Figure 50: Asia Pacific Agricultural Inoculants Market Revenue (billion), by Production Analysis 2025 & 2033
- Figure 51: Asia Pacific Agricultural Inoculants Market Revenue Share (%), by Production Analysis 2025 & 2033
- Figure 52: Asia Pacific Agricultural Inoculants Market Revenue (billion), by Consumption Analysis 2025 & 2033
- Figure 53: Asia Pacific Agricultural Inoculants Market Revenue Share (%), by Consumption Analysis 2025 & 2033
- Figure 54: Asia Pacific Agricultural Inoculants Market Revenue (billion), by Import Market Analysis (Value & Volume) 2025 & 2033
- Figure 55: Asia Pacific Agricultural Inoculants Market Revenue Share (%), by Import Market Analysis (Value & Volume) 2025 & 2033
- Figure 56: Asia Pacific Agricultural Inoculants Market Revenue (billion), by Export Market Analysis (Value & Volume) 2025 & 2033
- Figure 57: Asia Pacific Agricultural Inoculants Market Revenue Share (%), by Export Market Analysis (Value & Volume) 2025 & 2033
- Figure 58: Asia Pacific Agricultural Inoculants Market Revenue (billion), by Price Trend Analysis 2025 & 2033
- Figure 59: Asia Pacific Agricultural Inoculants Market Revenue Share (%), by Price Trend Analysis 2025 & 2033
- Figure 60: Asia Pacific Agricultural Inoculants Market Revenue (billion), by Country 2025 & 2033
- Figure 61: Asia Pacific Agricultural Inoculants Market Revenue Share (%), by Country 2025 & 2033
List of Tables
- Table 1: Global Agricultural Inoculants Market Revenue billion Forecast, by Production Analysis 2020 & 2033
- Table 2: Global Agricultural Inoculants Market Revenue billion Forecast, by Consumption Analysis 2020 & 2033
- Table 3: Global Agricultural Inoculants Market Revenue billion Forecast, by Import Market Analysis (Value & Volume) 2020 & 2033
- Table 4: Global Agricultural Inoculants Market Revenue billion Forecast, by Export Market Analysis (Value & Volume) 2020 & 2033
- Table 5: Global Agricultural Inoculants Market Revenue billion Forecast, by Price Trend Analysis 2020 & 2033
- Table 6: Global Agricultural Inoculants Market Revenue billion Forecast, by Region 2020 & 2033
- Table 7: Global Agricultural Inoculants Market Revenue billion Forecast, by Production Analysis 2020 & 2033
- Table 8: Global Agricultural Inoculants Market Revenue billion Forecast, by Consumption Analysis 2020 & 2033
- Table 9: Global Agricultural Inoculants Market Revenue billion Forecast, by Import Market Analysis (Value & Volume) 2020 & 2033
- Table 10: Global Agricultural Inoculants Market Revenue billion Forecast, by Export Market Analysis (Value & Volume) 2020 & 2033
- Table 11: Global Agricultural Inoculants Market Revenue billion Forecast, by Price Trend Analysis 2020 & 2033
- Table 12: Global Agricultural Inoculants Market Revenue billion Forecast, by Country 2020 & 2033
- Table 13: United States Agricultural Inoculants Market Revenue (billion) Forecast, by Application 2020 & 2033
- Table 14: Canada Agricultural Inoculants Market Revenue (billion) Forecast, by Application 2020 & 2033
- Table 15: Mexico Agricultural Inoculants Market Revenue (billion) Forecast, by Application 2020 & 2033
- Table 16: Global Agricultural Inoculants Market Revenue billion Forecast, by Production Analysis 2020 & 2033
- Table 17: Global Agricultural Inoculants Market Revenue billion Forecast, by Consumption Analysis 2020 & 2033
- Table 18: Global Agricultural Inoculants Market Revenue billion Forecast, by Import Market Analysis (Value & Volume) 2020 & 2033
- Table 19: Global Agricultural Inoculants Market Revenue billion Forecast, by Export Market Analysis (Value & Volume) 2020 & 2033
- Table 20: Global Agricultural Inoculants Market Revenue billion Forecast, by Price Trend Analysis 2020 & 2033
- Table 21: Global Agricultural Inoculants Market Revenue billion Forecast, by Country 2020 & 2033
- Table 22: Brazil Agricultural Inoculants Market Revenue (billion) Forecast, by Application 2020 & 2033
- Table 23: Argentina Agricultural Inoculants Market Revenue (billion) Forecast, by Application 2020 & 2033
- Table 24: Rest of South America Agricultural Inoculants Market Revenue (billion) Forecast, by Application 2020 & 2033
- Table 25: Global Agricultural Inoculants Market Revenue billion Forecast, by Production Analysis 2020 & 2033
- Table 26: Global Agricultural Inoculants Market Revenue billion Forecast, by Consumption Analysis 2020 & 2033
- Table 27: Global Agricultural Inoculants Market Revenue billion Forecast, by Import Market Analysis (Value & Volume) 2020 & 2033
- Table 28: Global Agricultural Inoculants Market Revenue billion Forecast, by Export Market Analysis (Value & Volume) 2020 & 2033
- Table 29: Global Agricultural Inoculants Market Revenue billion Forecast, by Price Trend Analysis 2020 & 2033
- Table 30: Global Agricultural Inoculants Market Revenue billion Forecast, by Country 2020 & 2033
- Table 31: United Kingdom Agricultural Inoculants Market Revenue (billion) Forecast, by Application 2020 & 2033
- Table 32: Germany Agricultural Inoculants Market Revenue (billion) Forecast, by Application 2020 & 2033
- Table 33: France Agricultural Inoculants Market Revenue (billion) Forecast, by Application 2020 & 2033
- Table 34: Italy Agricultural Inoculants Market Revenue (billion) Forecast, by Application 2020 & 2033
- Table 35: Spain Agricultural Inoculants Market Revenue (billion) Forecast, by Application 2020 & 2033
- Table 36: Russia Agricultural Inoculants Market Revenue (billion) Forecast, by Application 2020 & 2033
- Table 37: Benelux Agricultural Inoculants Market Revenue (billion) Forecast, by Application 2020 & 2033
- Table 38: Nordics Agricultural Inoculants Market Revenue (billion) Forecast, by Application 2020 & 2033
- Table 39: Rest of Europe Agricultural Inoculants Market Revenue (billion) Forecast, by Application 2020 & 2033
- Table 40: Global Agricultural Inoculants Market Revenue billion Forecast, by Production Analysis 2020 & 2033
- Table 41: Global Agricultural Inoculants Market Revenue billion Forecast, by Consumption Analysis 2020 & 2033
- Table 42: Global Agricultural Inoculants Market Revenue billion Forecast, by Import Market Analysis (Value & Volume) 2020 & 2033
- Table 43: Global Agricultural Inoculants Market Revenue billion Forecast, by Export Market Analysis (Value & Volume) 2020 & 2033
- Table 44: Global Agricultural Inoculants Market Revenue billion Forecast, by Price Trend Analysis 2020 & 2033
- Table 45: Global Agricultural Inoculants Market Revenue billion Forecast, by Country 2020 & 2033
- Table 46: Turkey Agricultural Inoculants Market Revenue (billion) Forecast, by Application 2020 & 2033
- Table 47: Israel Agricultural Inoculants Market Revenue (billion) Forecast, by Application 2020 & 2033
- Table 48: GCC Agricultural Inoculants Market Revenue (billion) Forecast, by Application 2020 & 2033
- Table 49: North Africa Agricultural Inoculants Market Revenue (billion) Forecast, by Application 2020 & 2033
- Table 50: South Africa Agricultural Inoculants Market Revenue (billion) Forecast, by Application 2020 & 2033
- Table 51: Rest of Middle East & Africa Agricultural Inoculants Market Revenue (billion) Forecast, by Application 2020 & 2033
- Table 52: Global Agricultural Inoculants Market Revenue billion Forecast, by Production Analysis 2020 & 2033
- Table 53: Global Agricultural Inoculants Market Revenue billion Forecast, by Consumption Analysis 2020 & 2033
- Table 54: Global Agricultural Inoculants Market Revenue billion Forecast, by Import Market Analysis (Value & Volume) 2020 & 2033
- Table 55: Global Agricultural Inoculants Market Revenue billion Forecast, by Export Market Analysis (Value & Volume) 2020 & 2033
- Table 56: Global Agricultural Inoculants Market Revenue billion Forecast, by Price Trend Analysis 2020 & 2033
- Table 57: Global Agricultural Inoculants Market Revenue billion Forecast, by Country 2020 & 2033
- Table 58: China Agricultural Inoculants Market Revenue (billion) Forecast, by Application 2020 & 2033
- Table 59: India Agricultural Inoculants Market Revenue (billion) Forecast, by Application 2020 & 2033
- Table 60: Japan Agricultural Inoculants Market Revenue (billion) Forecast, by Application 2020 & 2033
- Table 61: South Korea Agricultural Inoculants Market Revenue (billion) Forecast, by Application 2020 & 2033
- Table 62: ASEAN Agricultural Inoculants Market Revenue (billion) Forecast, by Application 2020 & 2033
- Table 63: Oceania Agricultural Inoculants Market Revenue (billion) Forecast, by Application 2020 & 2033
- Table 64: Rest of Asia Pacific Agricultural Inoculants Market Revenue (billion) Forecast, by Application 2020 & 2033
Frequently Asked Questions
1. What is the projected Compound Annual Growth Rate (CAGR) of the Agricultural Inoculants Market?
The projected CAGR is approximately 11%.
2. Which companies are prominent players in the Agricultural Inoculants Market?
Key companies in the market include Bioceres Crop Solutions*List Not Exhaustive, Lesaffre, Novozymes, T Stanes & Company Limited, Mapleton Agri Biotec Pty Ltd, New Edge Microbials Pty Ltd, AEA Investors (Verdesian Life Sciences LLC), Premier Tech, Lallemond Inc, BASF SE.
3. What are the main segments of the Agricultural Inoculants Market?
The market segments include Production Analysis, Consumption Analysis, Import Market Analysis (Value & Volume), Export Market Analysis (Value & Volume), Price Trend Analysis.
4. Can you provide details about the market size?
The market size is estimated to be USD 2.1 billion as of 2022.
5. What are some drivers contributing to market growth?
Adoption of Organic and Eco-friendly Farming Practices; Declining Area of Arable Land and Rising Food Security Concerns.
6. What are the notable trends driving market growth?
Adoption of Organic and Eco-friendly Farming Practices.
7. Are there any restraints impacting market growth?
High Demand for Conventional and Synthetic Products; Lack of Awareness and Other Factors Limiting the Adoption of Agricultural Inoculants.
8. Can you provide examples of recent developments in the market?
January 2023: VerdesianLife Science launched Accolade, a new biological growth enhancement liquid for crops containing Azospirillum Brasilense, a fixing bacterium that can increase root development and secondary lateral root systems, leading to increased nutrient uptake and higher yields.
9. What pricing options are available for accessing the report?
Pricing options include single-user, multi-user, and enterprise licenses priced at USD 4750, USD 5250, and USD 8750 respectively.
10. Is the market size provided in terms of value or volume?
The market size is provided in terms of value, measured in billion.
11. Are there any specific market keywords associated with the report?
Yes, the market keyword associated with the report is "Agricultural Inoculants Market," which aids in identifying and referencing the specific market segment covered.
12. How do I determine which pricing option suits my needs best?
The pricing options vary based on user requirements and access needs. Individual users may opt for single-user licenses, while businesses requiring broader access may choose multi-user or enterprise licenses for cost-effective access to the report.
13. Are there any additional resources or data provided in the Agricultural Inoculants Market report?
While the report offers comprehensive insights, it's advisable to review the specific contents or supplementary materials provided to ascertain if additional resources or data are available.
14. How can I stay updated on further developments or reports in the Agricultural Inoculants Market?
To stay informed about further developments, trends, and reports in the Agricultural Inoculants Market, consider subscribing to industry newsletters, following relevant companies and organizations, or regularly checking reputable industry news sources and publications.
Methodology
Step 1 - Identification of Relevant Samples Size from Population Database


Step 2 - Approaches for Defining Global Market Size (Value, Volume* & Price*)

Note*: In applicable scenarios
Step 3 - Data Sources
Primary Research
- Web Analytics
- Survey Reports
- Research Institute
- Latest Research Reports
- Opinion Leaders
Secondary Research
- Annual Reports
- White Paper
- Latest Press Release
- Industry Association
- Paid Database
- Investor Presentations

Step 4 - Data Triangulation
Involves using different sources of information in order to increase the validity of a study
These sources are likely to be stakeholders in a program - participants, other researchers, program staff, other community members, and so on.
Then we put all data in single framework & apply various statistical tools to find out the dynamic on the market.
During the analysis stage, feedback from the stakeholder groups would be compared to determine areas of agreement as well as areas of divergence