

Key Insights
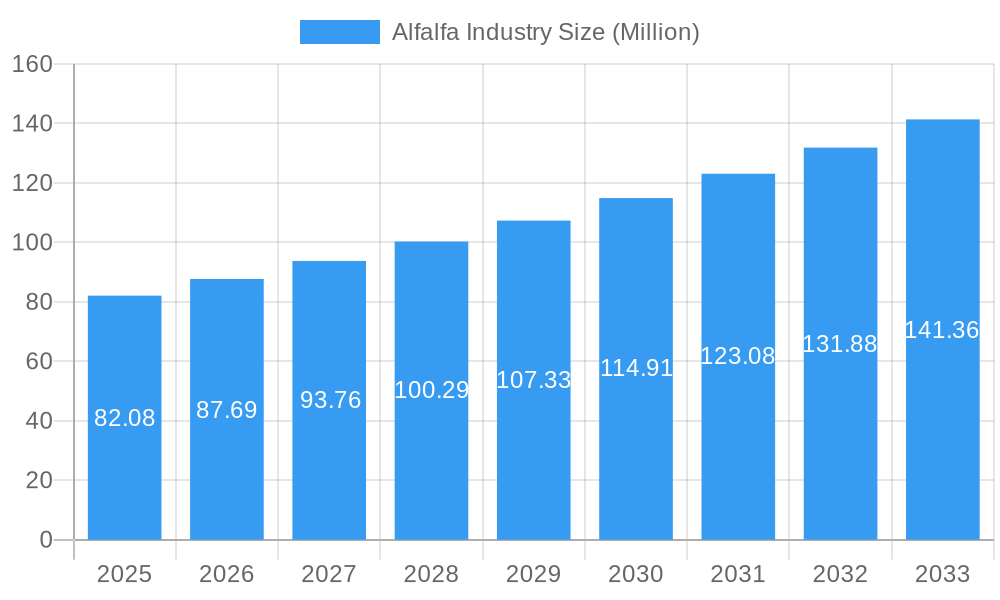
The global alfalfa market, valued at $82.08 million in 2025, is projected to experience robust growth, driven by a compound annual growth rate (CAGR) of 6.60% from 2025 to 2033. This expansion is fueled by several key factors. The increasing demand for animal feed, particularly in the dairy and poultry sectors, is a significant driver. Growing consumer awareness of the nutritional benefits of alfalfa-fed livestock products is also contributing to market growth. Further bolstering this trend is the rising adoption of sustainable farming practices, with alfalfa recognized for its role in soil health and crop rotation. The market is segmented by form (bales, pellets, cubes) and application (dairy, poultry, horse, and other animal feed). The pellet and cube forms are likely to experience faster growth due to their convenience and ease of handling compared to bales. Geographic variations exist, with North America and Europe currently dominating the market, though the Asia-Pacific region is anticipated to show significant growth potential driven by rising livestock populations and increasing disposable incomes. However, challenges such as fluctuating alfalfa prices due to weather patterns and variations in crop yields could potentially restrain market growth.
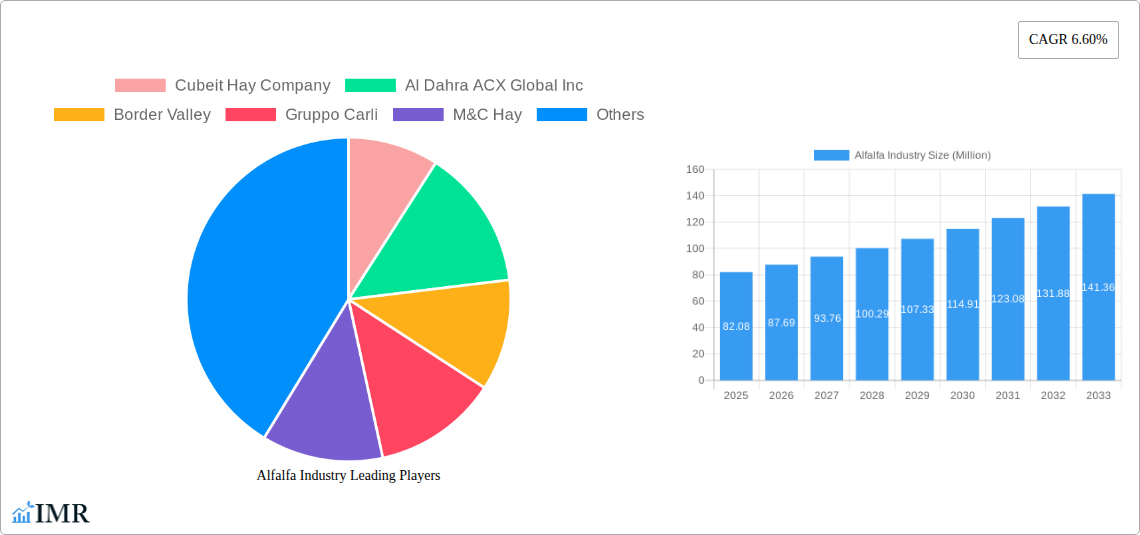
Alfalfa Industry Market Size (In Million)
Competition within the alfalfa industry is relatively fragmented, with numerous regional and international players vying for market share. Key companies include Cubeit Hay Company, Al Dahra ACX Global Inc, Border Valley, and others. These companies are focusing on strategies like product diversification, expansion into new markets, and the development of value-added products to gain a competitive edge. The increasing focus on traceability and quality control within the supply chain is also expected to shape future market developments. Furthermore, technological advancements in alfalfa cultivation and processing will play a critical role in enhancing efficiency and optimizing yields, further driving market growth in the coming years. A sustainable and transparent supply chain will be crucial for future success in this sector.
Alfalfa Industry Company Market Share
Alfalfa Industry Market Report: 2019-2033
This comprehensive report provides a detailed analysis of the Alfalfa Industry, encompassing market dynamics, growth trends, regional dominance, product landscapes, and future outlook. The study period covers 2019-2033, with 2025 as the base and estimated year. This report is crucial for industry professionals, investors, and stakeholders seeking to understand and capitalize on the opportunities within this dynamic market. The report analyzes the parent market of animal feed and the child market of alfalfa, offering granular insights across various segments.
Alfalfa Industry Market Dynamics & Structure
The alfalfa industry, a key component of the animal feed market (valued at XXX Million), is characterized by moderate market concentration with several large players and numerous smaller regional producers. Technological innovation, primarily focused on improved harvesting, processing, and preservation techniques, drives efficiency and product quality. Stringent regulatory frameworks concerning food safety and environmental sustainability significantly impact production practices. Competitive substitutes, such as other forage crops, exert pressure on pricing and market share. The end-user demographic is primarily agricultural businesses, with dairy farming dominating the application landscape. Mergers and acquisitions (M&A) activity, though not overly frequent, tends to focus on consolidating regional players.
- Market Concentration: Moderately concentrated, with top 5 players holding approximately xx% market share.
- Technological Innovation: Focus on automation, improved drying methods, and precision farming techniques.
- Regulatory Framework: Stringent food safety regulations and environmental standards.
- Competitive Substitutes: Other forages like clover and grasses.
- End-User Demographics: Primarily large-scale dairy and livestock operations.
- M&A Trends: Occasional consolidation of regional players, driven by cost efficiencies and market expansion. An estimated xx M&A deals occurred during 2019-2024.
Alfalfa Industry Growth Trends & Insights
The alfalfa market experienced robust growth during the historical period (2019-2024), with a CAGR of xx%. This growth is attributed to factors like increasing demand from the dairy industry, expansion of livestock farming, and the rising adoption of alfalfa as a key ingredient in animal feed formulations. Technological advancements such as improved harvesting equipment and processing techniques have further boosted production and efficiency. Consumer behavior shifts towards organic and sustainable feed options have also influenced market growth. The forecast period (2025-2033) is projected to witness a continued, albeit slightly moderated, growth trajectory. Market penetration in developing economies remains a significant growth driver.
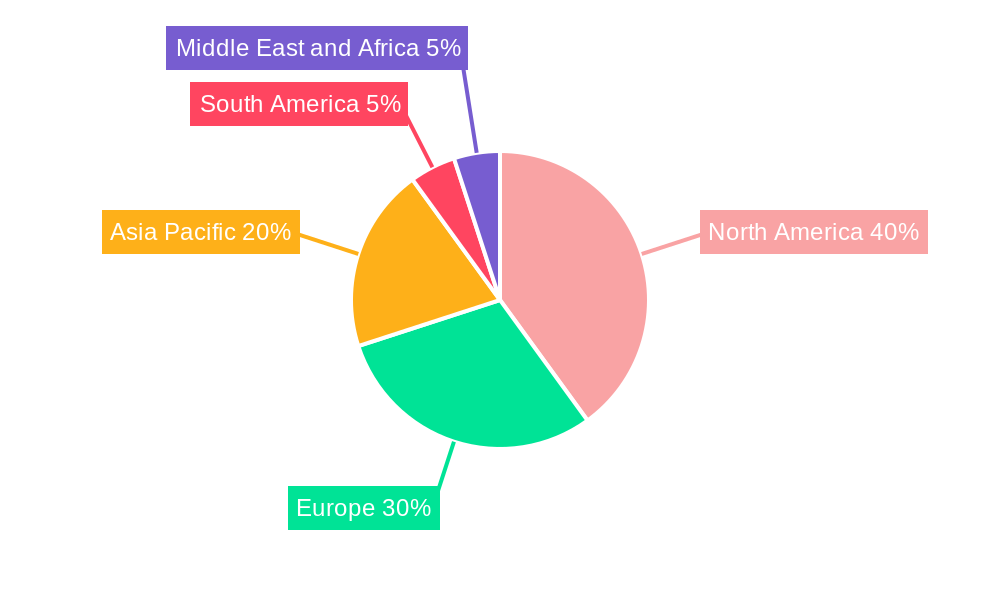
Dominant Regions, Countries, or Segments in Alfalfa Industry
The North American region, particularly the US and Canada, currently dominates the alfalfa market, accounting for approximately xx% of global production. This dominance stems from favourable climatic conditions, established agricultural infrastructure, and high demand from the dairy and livestock sectors. Within the product segments, bales remain the most prevalent form, constituting around xx% of the total market, driven by cost-effectiveness and ease of handling. Dairy animal feed continues to dominate applications, holding over xx% of market share, due to alfalfa's high nutritional value for milk production.
- Key Drivers: Favorable climatic conditions (North America), established agricultural infrastructure, high livestock density, government support for agriculture.
- Dominance Factors: High production volumes, cost-effectiveness, established supply chains, and regional demand.
- Growth Potential: Emerging markets in Asia and South America present significant untapped potential.
- Market Share: US and Canada hold xx% of global market share. Bales account for xx% of the total product volume. Dairy Animal Feed holds over xx% of application market share.
Alfalfa Industry Product Landscape
The alfalfa industry offers a range of products, including bales, pellets, and cubes, each tailored to specific end-user needs. Innovation focuses on enhancing preservation methods, such as improved drying techniques to minimize nutrient loss and maximize shelf life. The unique selling propositions often center on high nutritional value, consistent quality, and specific formulations catering to particular animal types. Technological advancements are geared towards reducing production costs and improving yield.
Key Drivers, Barriers & Challenges in Alfalfa Industry
Key Drivers:
- Growing demand for animal feed, driven by population growth and increasing meat and dairy consumption.
- Technological advancements in harvesting, processing, and storage.
- Government support for agriculture and livestock farming in various regions.
Key Challenges:
- Climate change and its impact on crop yields. xx% reduction in yield expected in specific regions due to drought (predicted).
- Fluctuations in raw material prices and global commodity markets.
- Intense competition from other forage crops and alternative feed sources.
- Transportation and logistical challenges, especially for export markets.
Emerging Opportunities in Alfalfa Industry
- Expansion into new markets, particularly in developing economies.
- Development of value-added alfalfa products, such as organic and specialized blends.
- Increasing demand for sustainable and environmentally friendly farming practices.
- Growing interest in using alfalfa as a human food ingredient ( niche market currently at xx Million).
Growth Accelerators in the Alfalfa Industry
Long-term growth will be fuelled by technological innovations such as precision farming and automation. Strategic partnerships between producers and feed companies will also contribute to market expansion. Furthermore, the increasing focus on sustainable agricultural practices offers opportunities for differentiation and premium pricing.
Key Players Shaping the Alfalfa Industry Market
- Cubeit Hay Company
- Al Dahra ACX Global Inc
- Border Valley
- Gruppo Carli
- M&C Hay
- Glenvar Hay
- Riverina (Australia) Pty Ltd
- Los Venteros SC
- Green Prairie International
- Haykingdom Inc
- Hay USA
- Knight AG Sourcing
- McCracken Hay Company
- Coaba
- SL Follen Company
- Bailey Farms
- Alfalfa Monegros SL
- Grupo Osés
- Anderson Hay & Grain Inc
- Standlee Hay Company
Notable Milestones in Alfalfa Industry Sector
- June 2022: Anderson Hay & Grain expands into USDA-certified organic Timothy hay through its sister company, Andy by Anderson Hay.
- January 2020: Green Prairie International launches "Green Curd," an air-dried hay product.
In-Depth Alfalfa Industry Market Outlook
The alfalfa industry is poised for continued growth, driven by rising global demand and technological advancements. Strategic investments in sustainable farming practices and exploring new markets will be crucial for long-term success. The increasing emphasis on animal health and welfare is also presenting opportunities for specialized alfalfa products. The market is expected to reach xx Million by 2033, presenting significant opportunities for established players and new entrants alike.
Alfalfa Industry Segmentation
- 1. Production Analysis
- 2. Consumption Analysis
- 3. Import Market Analysis (Value & Volume)
- 4. Export Market Analysis (Value & Volume)
- 5. Price Trend Analysis
Alfalfa Industry Segmentation By Geography
-
1. North America
- 1.1. United States
- 1.2. Canada
- 1.3. Mexico
-
2. South America
- 2.1. Brazil
- 2.2. Argentina
- 2.3. Rest of South America
-
3. Europe
- 3.1. United Kingdom
- 3.2. Germany
- 3.3. France
- 3.4. Italy
- 3.5. Spain
- 3.6. Russia
- 3.7. Benelux
- 3.8. Nordics
- 3.9. Rest of Europe
-
4. Middle East & Africa
- 4.1. Turkey
- 4.2. Israel
- 4.3. GCC
- 4.4. North Africa
- 4.5. South Africa
- 4.6. Rest of Middle East & Africa
-
5. Asia Pacific
- 5.1. China
- 5.2. India
- 5.3. Japan
- 5.4. South Korea
- 5.5. ASEAN
- 5.6. Oceania
- 5.7. Rest of Asia Pacific
Alfalfa Industry Regional Market Share
Geographic Coverage of Alfalfa Industry
Alfalfa Industry REPORT HIGHLIGHTS
| Aspects | Details |
|---|---|
| Study Period | 2020-2034 |
| Base Year | 2025 |
| Estimated Year | 2026 |
| Forecast Period | 2026-2034 |
| Historical Period | 2020-2025 |
| Growth Rate | CAGR of 6.60% from 2020-2034 |
| Segmentation |
|
Table of Contents
- 1. Introduction
- 1.1. Research Scope
- 1.2. Market Segmentation
- 1.3. Research Objective
- 1.4. Definitions and Assumptions
- 2. Executive Summary
- 2.1. Market Snapshot
- 3. Market Dynamics
- 3.1. Market Drivers
- 3.2. Market Restrains
- 3.3. Market Trends
- 3.4. Market Opportunities
- 4. Market Factor Analysis
- 4.1. Porters Five Forces
- 4.1.1. Bargaining Power of Suppliers
- 4.1.2. Bargaining Power of Buyers
- 4.1.3. Threat of New Entrants
- 4.1.4. Threat of Substitutes
- 4.1.5. Competitive Rivalry
- 4.2. PESTEL analysis
- 4.3. BCG Analysis
- 4.3.1. Stars (High Growth, High Market Share)
- 4.3.2. Cash Cows (Low Growth, High Market Share)
- 4.3.3. Question Mark (High Growth, Low Market Share)
- 4.3.4. Dogs (Low Growth, Low Market Share)
- 4.4. Ansoff Matrix Analysis
- 4.5. Supply Chain Analysis
- 4.6. Regulatory Landscape
- 4.7. Current Market Potential and Opportunity Assessment (TAM–SAM–SOM Framework)
- 4.8. IMR Analyst Note
- 4.1. Porters Five Forces
- 5. Market Analysis, Insights and Forecast 2021-2033
- 5.1. Market Analysis, Insights and Forecast - by Production Analysis
- 5.2. Market Analysis, Insights and Forecast - by Consumption Analysis
- 5.3. Market Analysis, Insights and Forecast - by Import Market Analysis (Value & Volume)
- 5.4. Market Analysis, Insights and Forecast - by Export Market Analysis (Value & Volume)
- 5.5. Market Analysis, Insights and Forecast - by Price Trend Analysis
- 5.6. Market Analysis, Insights and Forecast - by Region
- 5.6.1. North America
- 5.6.2. South America
- 5.6.3. Europe
- 5.6.4. Middle East & Africa
- 5.6.5. Asia Pacific
- 6. Global Alfalfa Industry Analysis, Insights and Forecast, 2021-2033
- 6.1. Market Analysis, Insights and Forecast - by Production Analysis
- 6.2. Market Analysis, Insights and Forecast - by Consumption Analysis
- 6.3. Market Analysis, Insights and Forecast - by Import Market Analysis (Value & Volume)
- 6.4. Market Analysis, Insights and Forecast - by Export Market Analysis (Value & Volume)
- 6.5. Market Analysis, Insights and Forecast - by Price Trend Analysis
- 7. North America Alfalfa Industry Analysis, Insights and Forecast, 2020-2032
- 7.1. Market Analysis, Insights and Forecast - by Production Analysis
- 7.2. Market Analysis, Insights and Forecast - by Consumption Analysis
- 7.3. Market Analysis, Insights and Forecast - by Import Market Analysis (Value & Volume)
- 7.4. Market Analysis, Insights and Forecast - by Export Market Analysis (Value & Volume)
- 7.5. Market Analysis, Insights and Forecast - by Price Trend Analysis
- 8. South America Alfalfa Industry Analysis, Insights and Forecast, 2020-2032
- 8.1. Market Analysis, Insights and Forecast - by Production Analysis
- 8.2. Market Analysis, Insights and Forecast - by Consumption Analysis
- 8.3. Market Analysis, Insights and Forecast - by Import Market Analysis (Value & Volume)
- 8.4. Market Analysis, Insights and Forecast - by Export Market Analysis (Value & Volume)
- 8.5. Market Analysis, Insights and Forecast - by Price Trend Analysis
- 9. Europe Alfalfa Industry Analysis, Insights and Forecast, 2020-2032
- 9.1. Market Analysis, Insights and Forecast - by Production Analysis
- 9.2. Market Analysis, Insights and Forecast - by Consumption Analysis
- 9.3. Market Analysis, Insights and Forecast - by Import Market Analysis (Value & Volume)
- 9.4. Market Analysis, Insights and Forecast - by Export Market Analysis (Value & Volume)
- 9.5. Market Analysis, Insights and Forecast - by Price Trend Analysis
- 10. Middle East & Africa Alfalfa Industry Analysis, Insights and Forecast, 2020-2032
- 10.1. Market Analysis, Insights and Forecast - by Production Analysis
- 10.2. Market Analysis, Insights and Forecast - by Consumption Analysis
- 10.3. Market Analysis, Insights and Forecast - by Import Market Analysis (Value & Volume)
- 10.4. Market Analysis, Insights and Forecast - by Export Market Analysis (Value & Volume)
- 10.5. Market Analysis, Insights and Forecast - by Price Trend Analysis
- 11. Asia Pacific Alfalfa Industry Analysis, Insights and Forecast, 2020-2032
- 11.1. Market Analysis, Insights and Forecast - by Production Analysis
- 11.2. Market Analysis, Insights and Forecast - by Consumption Analysis
- 11.3. Market Analysis, Insights and Forecast - by Import Market Analysis (Value & Volume)
- 11.4. Market Analysis, Insights and Forecast - by Export Market Analysis (Value & Volume)
- 11.5. Market Analysis, Insights and Forecast - by Price Trend Analysis
- 12. Competitive Analysis
- 12.1. Company Profiles
- 12.1.1 Cubeit Hay Company
- 12.1.1.1. Company Overview
- 12.1.1.2. Products
- 12.1.1.3. Company Financials
- 12.1.1.4. SWOT Analysis
- 12.1.2 Al Dahra ACX Global Inc
- 12.1.2.1. Company Overview
- 12.1.2.2. Products
- 12.1.2.3. Company Financials
- 12.1.2.4. SWOT Analysis
- 12.1.3 Border Valley
- 12.1.3.1. Company Overview
- 12.1.3.2. Products
- 12.1.3.3. Company Financials
- 12.1.3.4. SWOT Analysis
- 12.1.4 Gruppo Carli
- 12.1.4.1. Company Overview
- 12.1.4.2. Products
- 12.1.4.3. Company Financials
- 12.1.4.4. SWOT Analysis
- 12.1.5 M&C Hay
- 12.1.5.1. Company Overview
- 12.1.5.2. Products
- 12.1.5.3. Company Financials
- 12.1.5.4. SWOT Analysis
- 12.1.6 Glenvar Hay
- 12.1.6.1. Company Overview
- 12.1.6.2. Products
- 12.1.6.3. Company Financials
- 12.1.6.4. SWOT Analysis
- 12.1.7 Riverina (Australia) Pty Ltd
- 12.1.7.1. Company Overview
- 12.1.7.2. Products
- 12.1.7.3. Company Financials
- 12.1.7.4. SWOT Analysis
- 12.1.8 Los Venteros SC
- 12.1.8.1. Company Overview
- 12.1.8.2. Products
- 12.1.8.3. Company Financials
- 12.1.8.4. SWOT Analysis
- 12.1.9 Green Prairie International
- 12.1.9.1. Company Overview
- 12.1.9.2. Products
- 12.1.9.3. Company Financials
- 12.1.9.4. SWOT Analysis
- 12.1.10 Haykingdom Inc
- 12.1.10.1. Company Overview
- 12.1.10.2. Products
- 12.1.10.3. Company Financials
- 12.1.10.4. SWOT Analysis
- 12.1.11 Hay USA
- 12.1.11.1. Company Overview
- 12.1.11.2. Products
- 12.1.11.3. Company Financials
- 12.1.11.4. SWOT Analysis
- 12.1.12 Knight AG Sourcing
- 12.1.12.1. Company Overview
- 12.1.12.2. Products
- 12.1.12.3. Company Financials
- 12.1.12.4. SWOT Analysis
- 12.1.13 McCracken Hay Company
- 12.1.13.1. Company Overview
- 12.1.13.2. Products
- 12.1.13.3. Company Financials
- 12.1.13.4. SWOT Analysis
- 12.1.14 Coaba
- 12.1.14.1. Company Overview
- 12.1.14.2. Products
- 12.1.14.3. Company Financials
- 12.1.14.4. SWOT Analysis
- 12.1.15 SL Follen Company
- 12.1.15.1. Company Overview
- 12.1.15.2. Products
- 12.1.15.3. Company Financials
- 12.1.15.4. SWOT Analysis
- 12.1.16 Bailey Farms
- 12.1.16.1. Company Overview
- 12.1.16.2. Products
- 12.1.16.3. Company Financials
- 12.1.16.4. SWOT Analysis
- 12.1.17 Alfalfa Monegros SL
- 12.1.17.1. Company Overview
- 12.1.17.2. Products
- 12.1.17.3. Company Financials
- 12.1.17.4. SWOT Analysis
- 12.1.18 Grupo Osés
- 12.1.18.1. Company Overview
- 12.1.18.2. Products
- 12.1.18.3. Company Financials
- 12.1.18.4. SWOT Analysis
- 12.1.19 Anderson Hay & Grain Inc
- 12.1.19.1. Company Overview
- 12.1.19.2. Products
- 12.1.19.3. Company Financials
- 12.1.19.4. SWOT Analysis
- 12.1.20 Standlee Hay Compan
- 12.1.20.1. Company Overview
- 12.1.20.2. Products
- 12.1.20.3. Company Financials
- 12.1.20.4. SWOT Analysis
- 12.1.1 Cubeit Hay Company
- 12.2. Market Entropy
- 12.2.1 Company's Key Areas Served
- 12.2.2 Recent Developments
- 12.3. Company Market Share Analysis 2025
- 12.3.1 Top 5 Companies Market Share Analysis
- 12.3.2 Top 3 Companies Market Share Analysis
- 12.4. List of Potential Customers
- 13. Research Methodology
List of Figures
- Figure 1: Global Alfalfa Industry Revenue Breakdown (Million, %) by Region 2025 & 2033
- Figure 2: North America Alfalfa Industry Revenue (Million), by Production Analysis 2025 & 2033
- Figure 3: North America Alfalfa Industry Revenue Share (%), by Production Analysis 2025 & 2033
- Figure 4: North America Alfalfa Industry Revenue (Million), by Consumption Analysis 2025 & 2033
- Figure 5: North America Alfalfa Industry Revenue Share (%), by Consumption Analysis 2025 & 2033
- Figure 6: North America Alfalfa Industry Revenue (Million), by Import Market Analysis (Value & Volume) 2025 & 2033
- Figure 7: North America Alfalfa Industry Revenue Share (%), by Import Market Analysis (Value & Volume) 2025 & 2033
- Figure 8: North America Alfalfa Industry Revenue (Million), by Export Market Analysis (Value & Volume) 2025 & 2033
- Figure 9: North America Alfalfa Industry Revenue Share (%), by Export Market Analysis (Value & Volume) 2025 & 2033
- Figure 10: North America Alfalfa Industry Revenue (Million), by Price Trend Analysis 2025 & 2033
- Figure 11: North America Alfalfa Industry Revenue Share (%), by Price Trend Analysis 2025 & 2033
- Figure 12: North America Alfalfa Industry Revenue (Million), by Country 2025 & 2033
- Figure 13: North America Alfalfa Industry Revenue Share (%), by Country 2025 & 2033
- Figure 14: South America Alfalfa Industry Revenue (Million), by Production Analysis 2025 & 2033
- Figure 15: South America Alfalfa Industry Revenue Share (%), by Production Analysis 2025 & 2033
- Figure 16: South America Alfalfa Industry Revenue (Million), by Consumption Analysis 2025 & 2033
- Figure 17: South America Alfalfa Industry Revenue Share (%), by Consumption Analysis 2025 & 2033
- Figure 18: South America Alfalfa Industry Revenue (Million), by Import Market Analysis (Value & Volume) 2025 & 2033
- Figure 19: South America Alfalfa Industry Revenue Share (%), by Import Market Analysis (Value & Volume) 2025 & 2033
- Figure 20: South America Alfalfa Industry Revenue (Million), by Export Market Analysis (Value & Volume) 2025 & 2033
- Figure 21: South America Alfalfa Industry Revenue Share (%), by Export Market Analysis (Value & Volume) 2025 & 2033
- Figure 22: South America Alfalfa Industry Revenue (Million), by Price Trend Analysis 2025 & 2033
- Figure 23: South America Alfalfa Industry Revenue Share (%), by Price Trend Analysis 2025 & 2033
- Figure 24: South America Alfalfa Industry Revenue (Million), by Country 2025 & 2033
- Figure 25: South America Alfalfa Industry Revenue Share (%), by Country 2025 & 2033
- Figure 26: Europe Alfalfa Industry Revenue (Million), by Production Analysis 2025 & 2033
- Figure 27: Europe Alfalfa Industry Revenue Share (%), by Production Analysis 2025 & 2033
- Figure 28: Europe Alfalfa Industry Revenue (Million), by Consumption Analysis 2025 & 2033
- Figure 29: Europe Alfalfa Industry Revenue Share (%), by Consumption Analysis 2025 & 2033
- Figure 30: Europe Alfalfa Industry Revenue (Million), by Import Market Analysis (Value & Volume) 2025 & 2033
- Figure 31: Europe Alfalfa Industry Revenue Share (%), by Import Market Analysis (Value & Volume) 2025 & 2033
- Figure 32: Europe Alfalfa Industry Revenue (Million), by Export Market Analysis (Value & Volume) 2025 & 2033
- Figure 33: Europe Alfalfa Industry Revenue Share (%), by Export Market Analysis (Value & Volume) 2025 & 2033
- Figure 34: Europe Alfalfa Industry Revenue (Million), by Price Trend Analysis 2025 & 2033
- Figure 35: Europe Alfalfa Industry Revenue Share (%), by Price Trend Analysis 2025 & 2033
- Figure 36: Europe Alfalfa Industry Revenue (Million), by Country 2025 & 2033
- Figure 37: Europe Alfalfa Industry Revenue Share (%), by Country 2025 & 2033
- Figure 38: Middle East & Africa Alfalfa Industry Revenue (Million), by Production Analysis 2025 & 2033
- Figure 39: Middle East & Africa Alfalfa Industry Revenue Share (%), by Production Analysis 2025 & 2033
- Figure 40: Middle East & Africa Alfalfa Industry Revenue (Million), by Consumption Analysis 2025 & 2033
- Figure 41: Middle East & Africa Alfalfa Industry Revenue Share (%), by Consumption Analysis 2025 & 2033
- Figure 42: Middle East & Africa Alfalfa Industry Revenue (Million), by Import Market Analysis (Value & Volume) 2025 & 2033
- Figure 43: Middle East & Africa Alfalfa Industry Revenue Share (%), by Import Market Analysis (Value & Volume) 2025 & 2033
- Figure 44: Middle East & Africa Alfalfa Industry Revenue (Million), by Export Market Analysis (Value & Volume) 2025 & 2033
- Figure 45: Middle East & Africa Alfalfa Industry Revenue Share (%), by Export Market Analysis (Value & Volume) 2025 & 2033
- Figure 46: Middle East & Africa Alfalfa Industry Revenue (Million), by Price Trend Analysis 2025 & 2033
- Figure 47: Middle East & Africa Alfalfa Industry Revenue Share (%), by Price Trend Analysis 2025 & 2033
- Figure 48: Middle East & Africa Alfalfa Industry Revenue (Million), by Country 2025 & 2033
- Figure 49: Middle East & Africa Alfalfa Industry Revenue Share (%), by Country 2025 & 2033
- Figure 50: Asia Pacific Alfalfa Industry Revenue (Million), by Production Analysis 2025 & 2033
- Figure 51: Asia Pacific Alfalfa Industry Revenue Share (%), by Production Analysis 2025 & 2033
- Figure 52: Asia Pacific Alfalfa Industry Revenue (Million), by Consumption Analysis 2025 & 2033
- Figure 53: Asia Pacific Alfalfa Industry Revenue Share (%), by Consumption Analysis 2025 & 2033
- Figure 54: Asia Pacific Alfalfa Industry Revenue (Million), by Import Market Analysis (Value & Volume) 2025 & 2033
- Figure 55: Asia Pacific Alfalfa Industry Revenue Share (%), by Import Market Analysis (Value & Volume) 2025 & 2033
- Figure 56: Asia Pacific Alfalfa Industry Revenue (Million), by Export Market Analysis (Value & Volume) 2025 & 2033
- Figure 57: Asia Pacific Alfalfa Industry Revenue Share (%), by Export Market Analysis (Value & Volume) 2025 & 2033
- Figure 58: Asia Pacific Alfalfa Industry Revenue (Million), by Price Trend Analysis 2025 & 2033
- Figure 59: Asia Pacific Alfalfa Industry Revenue Share (%), by Price Trend Analysis 2025 & 2033
- Figure 60: Asia Pacific Alfalfa Industry Revenue (Million), by Country 2025 & 2033
- Figure 61: Asia Pacific Alfalfa Industry Revenue Share (%), by Country 2025 & 2033
List of Tables
- Table 1: Global Alfalfa Industry Revenue Million Forecast, by Production Analysis 2020 & 2033
- Table 2: Global Alfalfa Industry Revenue Million Forecast, by Consumption Analysis 2020 & 2033
- Table 3: Global Alfalfa Industry Revenue Million Forecast, by Import Market Analysis (Value & Volume) 2020 & 2033
- Table 4: Global Alfalfa Industry Revenue Million Forecast, by Export Market Analysis (Value & Volume) 2020 & 2033
- Table 5: Global Alfalfa Industry Revenue Million Forecast, by Price Trend Analysis 2020 & 2033
- Table 6: Global Alfalfa Industry Revenue Million Forecast, by Region 2020 & 2033
- Table 7: Global Alfalfa Industry Revenue Million Forecast, by Production Analysis 2020 & 2033
- Table 8: Global Alfalfa Industry Revenue Million Forecast, by Consumption Analysis 2020 & 2033
- Table 9: Global Alfalfa Industry Revenue Million Forecast, by Import Market Analysis (Value & Volume) 2020 & 2033
- Table 10: Global Alfalfa Industry Revenue Million Forecast, by Export Market Analysis (Value & Volume) 2020 & 2033
- Table 11: Global Alfalfa Industry Revenue Million Forecast, by Price Trend Analysis 2020 & 2033
- Table 12: Global Alfalfa Industry Revenue Million Forecast, by Country 2020 & 2033
- Table 13: United States Alfalfa Industry Revenue (Million) Forecast, by Application 2020 & 2033
- Table 14: Canada Alfalfa Industry Revenue (Million) Forecast, by Application 2020 & 2033
- Table 15: Mexico Alfalfa Industry Revenue (Million) Forecast, by Application 2020 & 2033
- Table 16: Global Alfalfa Industry Revenue Million Forecast, by Production Analysis 2020 & 2033
- Table 17: Global Alfalfa Industry Revenue Million Forecast, by Consumption Analysis 2020 & 2033
- Table 18: Global Alfalfa Industry Revenue Million Forecast, by Import Market Analysis (Value & Volume) 2020 & 2033
- Table 19: Global Alfalfa Industry Revenue Million Forecast, by Export Market Analysis (Value & Volume) 2020 & 2033
- Table 20: Global Alfalfa Industry Revenue Million Forecast, by Price Trend Analysis 2020 & 2033
- Table 21: Global Alfalfa Industry Revenue Million Forecast, by Country 2020 & 2033
- Table 22: Brazil Alfalfa Industry Revenue (Million) Forecast, by Application 2020 & 2033
- Table 23: Argentina Alfalfa Industry Revenue (Million) Forecast, by Application 2020 & 2033
- Table 24: Rest of South America Alfalfa Industry Revenue (Million) Forecast, by Application 2020 & 2033
- Table 25: Global Alfalfa Industry Revenue Million Forecast, by Production Analysis 2020 & 2033
- Table 26: Global Alfalfa Industry Revenue Million Forecast, by Consumption Analysis 2020 & 2033
- Table 27: Global Alfalfa Industry Revenue Million Forecast, by Import Market Analysis (Value & Volume) 2020 & 2033
- Table 28: Global Alfalfa Industry Revenue Million Forecast, by Export Market Analysis (Value & Volume) 2020 & 2033
- Table 29: Global Alfalfa Industry Revenue Million Forecast, by Price Trend Analysis 2020 & 2033
- Table 30: Global Alfalfa Industry Revenue Million Forecast, by Country 2020 & 2033
- Table 31: United Kingdom Alfalfa Industry Revenue (Million) Forecast, by Application 2020 & 2033
- Table 32: Germany Alfalfa Industry Revenue (Million) Forecast, by Application 2020 & 2033
- Table 33: France Alfalfa Industry Revenue (Million) Forecast, by Application 2020 & 2033
- Table 34: Italy Alfalfa Industry Revenue (Million) Forecast, by Application 2020 & 2033
- Table 35: Spain Alfalfa Industry Revenue (Million) Forecast, by Application 2020 & 2033
- Table 36: Russia Alfalfa Industry Revenue (Million) Forecast, by Application 2020 & 2033
- Table 37: Benelux Alfalfa Industry Revenue (Million) Forecast, by Application 2020 & 2033
- Table 38: Nordics Alfalfa Industry Revenue (Million) Forecast, by Application 2020 & 2033
- Table 39: Rest of Europe Alfalfa Industry Revenue (Million) Forecast, by Application 2020 & 2033
- Table 40: Global Alfalfa Industry Revenue Million Forecast, by Production Analysis 2020 & 2033
- Table 41: Global Alfalfa Industry Revenue Million Forecast, by Consumption Analysis 2020 & 2033
- Table 42: Global Alfalfa Industry Revenue Million Forecast, by Import Market Analysis (Value & Volume) 2020 & 2033
- Table 43: Global Alfalfa Industry Revenue Million Forecast, by Export Market Analysis (Value & Volume) 2020 & 2033
- Table 44: Global Alfalfa Industry Revenue Million Forecast, by Price Trend Analysis 2020 & 2033
- Table 45: Global Alfalfa Industry Revenue Million Forecast, by Country 2020 & 2033
- Table 46: Turkey Alfalfa Industry Revenue (Million) Forecast, by Application 2020 & 2033
- Table 47: Israel Alfalfa Industry Revenue (Million) Forecast, by Application 2020 & 2033
- Table 48: GCC Alfalfa Industry Revenue (Million) Forecast, by Application 2020 & 2033
- Table 49: North Africa Alfalfa Industry Revenue (Million) Forecast, by Application 2020 & 2033
- Table 50: South Africa Alfalfa Industry Revenue (Million) Forecast, by Application 2020 & 2033
- Table 51: Rest of Middle East & Africa Alfalfa Industry Revenue (Million) Forecast, by Application 2020 & 2033
- Table 52: Global Alfalfa Industry Revenue Million Forecast, by Production Analysis 2020 & 2033
- Table 53: Global Alfalfa Industry Revenue Million Forecast, by Consumption Analysis 2020 & 2033
- Table 54: Global Alfalfa Industry Revenue Million Forecast, by Import Market Analysis (Value & Volume) 2020 & 2033
- Table 55: Global Alfalfa Industry Revenue Million Forecast, by Export Market Analysis (Value & Volume) 2020 & 2033
- Table 56: Global Alfalfa Industry Revenue Million Forecast, by Price Trend Analysis 2020 & 2033
- Table 57: Global Alfalfa Industry Revenue Million Forecast, by Country 2020 & 2033
- Table 58: China Alfalfa Industry Revenue (Million) Forecast, by Application 2020 & 2033
- Table 59: India Alfalfa Industry Revenue (Million) Forecast, by Application 2020 & 2033
- Table 60: Japan Alfalfa Industry Revenue (Million) Forecast, by Application 2020 & 2033
- Table 61: South Korea Alfalfa Industry Revenue (Million) Forecast, by Application 2020 & 2033
- Table 62: ASEAN Alfalfa Industry Revenue (Million) Forecast, by Application 2020 & 2033
- Table 63: Oceania Alfalfa Industry Revenue (Million) Forecast, by Application 2020 & 2033
- Table 64: Rest of Asia Pacific Alfalfa Industry Revenue (Million) Forecast, by Application 2020 & 2033
Frequently Asked Questions
1. What is the projected Compound Annual Growth Rate (CAGR) of the Alfalfa Industry?
The projected CAGR is approximately 6.60%.
2. Which companies are prominent players in the Alfalfa Industry?
Key companies in the market include Cubeit Hay Company, Al Dahra ACX Global Inc, Border Valley, Gruppo Carli, M&C Hay, Glenvar Hay, Riverina (Australia) Pty Ltd, Los Venteros SC, Green Prairie International, Haykingdom Inc, Hay USA, Knight AG Sourcing, McCracken Hay Company, Coaba, SL Follen Company, Bailey Farms, Alfalfa Monegros SL, Grupo Osés, Anderson Hay & Grain Inc, Standlee Hay Compan.
3. What are the main segments of the Alfalfa Industry?
The market segments include Production Analysis, Consumption Analysis, Import Market Analysis (Value & Volume), Export Market Analysis (Value & Volume), Price Trend Analysis.
4. Can you provide details about the market size?
The market size is estimated to be USD 82.08 Million as of 2022.
5. What are some drivers contributing to market growth?
Seed Treatment As A Solution To Enhance Yield; Growing Awareness For Seed Treatment Among The Farmers; Rising Trend Of Organic Farming.
6. What are the notable trends driving market growth?
Increasing Demand for Dairy and Meat Products.
7. Are there any restraints impacting market growth?
Limitations Across Farm-Level Seed Treatment; Rising Environmental Concerns.
8. Can you provide examples of recent developments in the market?
June 2022: Anderson Hay & Grain (Anderson), the leading exporter of premium hay and straw products specializing in Timothy and alfalfa hay and grass straw products, is expanding to offer the US Department of Agriculture (USDA) certified organic Timothy hay through its sister company, Andy by Anderson Hay, a new company that offers high-quality hay and all-natural products for rabbits, guinea pigs, chinchillas, and other small pets.
9. What pricing options are available for accessing the report?
Pricing options include single-user, multi-user, and enterprise licenses priced at USD 4750, USD 5250, and USD 8750 respectively.
10. Is the market size provided in terms of value or volume?
The market size is provided in terms of value, measured in Million.
11. Are there any specific market keywords associated with the report?
Yes, the market keyword associated with the report is "Alfalfa Industry," which aids in identifying and referencing the specific market segment covered.
12. How do I determine which pricing option suits my needs best?
The pricing options vary based on user requirements and access needs. Individual users may opt for single-user licenses, while businesses requiring broader access may choose multi-user or enterprise licenses for cost-effective access to the report.
13. Are there any additional resources or data provided in the Alfalfa Industry report?
While the report offers comprehensive insights, it's advisable to review the specific contents or supplementary materials provided to ascertain if additional resources or data are available.
14. How can I stay updated on further developments or reports in the Alfalfa Industry?
To stay informed about further developments, trends, and reports in the Alfalfa Industry, consider subscribing to industry newsletters, following relevant companies and organizations, or regularly checking reputable industry news sources and publications.
Methodology
Step 1 - Identification of Relevant Samples Size from Population Database


Step 2 - Approaches for Defining Global Market Size (Value, Volume* & Price*)

Note*: In applicable scenarios
Step 3 - Data Sources
Primary Research
- Web Analytics
- Survey Reports
- Research Institute
- Latest Research Reports
- Opinion Leaders
Secondary Research
- Annual Reports
- White Paper
- Latest Press Release
- Industry Association
- Paid Database
- Investor Presentations

Step 4 - Data Triangulation
Involves using different sources of information in order to increase the validity of a study
These sources are likely to be stakeholders in a program - participants, other researchers, program staff, other community members, and so on.
Then we put all data in single framework & apply various statistical tools to find out the dynamic on the market.
During the analysis stage, feedback from the stakeholder groups would be compared to determine areas of agreement as well as areas of divergence