

Key Insights
The Asia-Pacific (APAC) non-woven fabrics market is experiencing robust growth, driven by increasing demand across diverse sectors. The region's burgeoning construction industry, fueled by rapid urbanization and infrastructure development, is a significant driver, demanding substantial quantities of non-woven materials for insulation, filtration, and geotextiles. Simultaneously, the textile industry's expansion, particularly in countries like India and China, contributes significantly to market growth, with non-wovens used in apparel interlinings, hygiene products, and other applications. The healthcare sector, experiencing a surge in demand for hygiene products and medical disposables, further fuels market expansion. Technological advancements, such as the development of sustainable and bio-based non-woven materials, are also contributing to market growth, aligning with increasing environmental concerns. While challenges remain, such as fluctuating raw material prices and regional economic variations, the overall outlook for the APAC non-woven fabrics market remains positive, projected to maintain a healthy CAGR.
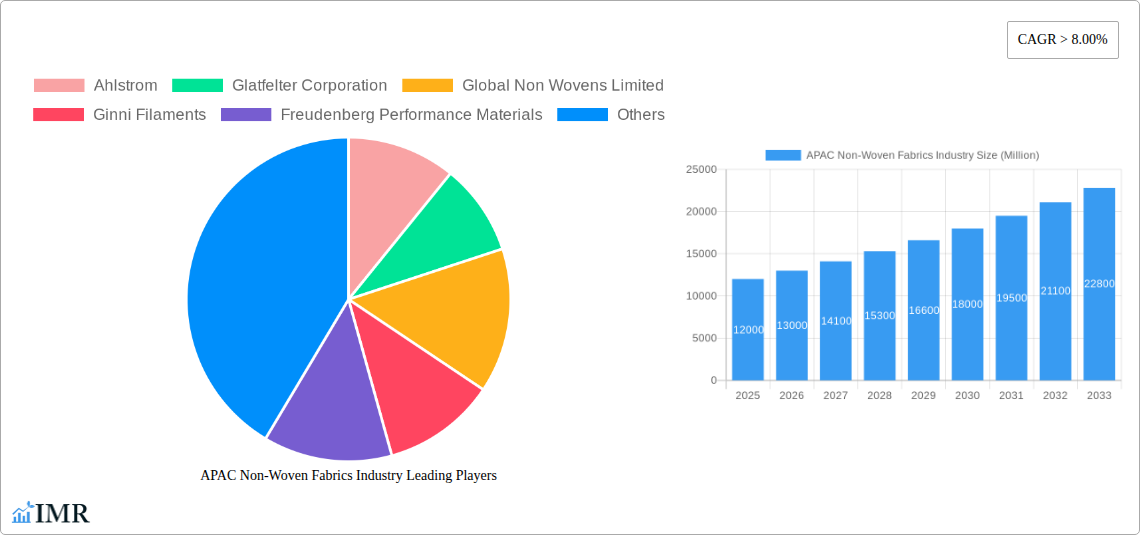
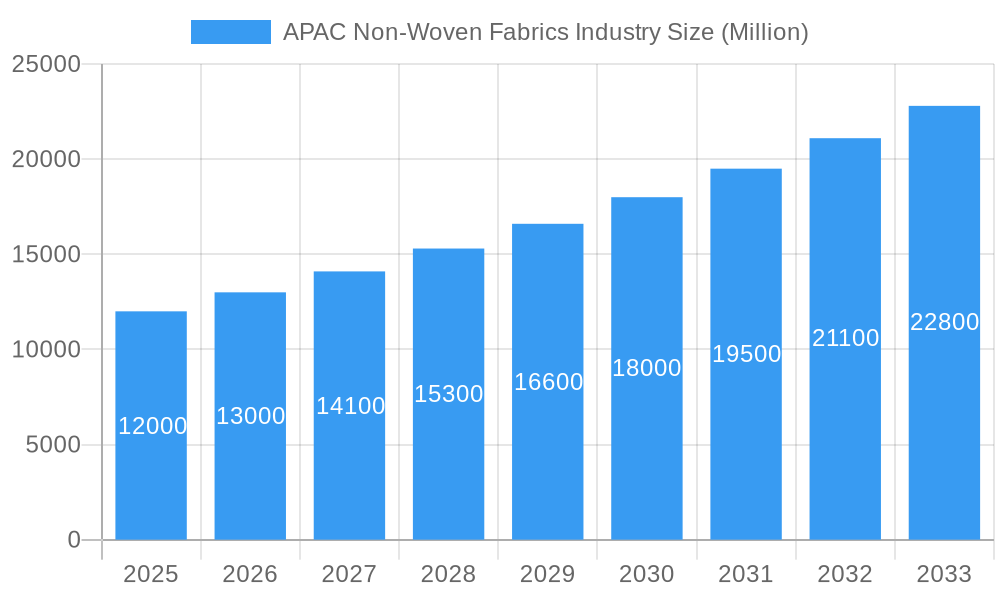
APAC Non-Woven Fabrics Industry Market Size (In Billion)
The market segmentation within APAC reveals a diverse landscape. Polyester and polypropylene dominate the material segment, owing to their cost-effectiveness and versatile properties. Spun-bond and melt-blown technologies are prevalent, catering to various applications. Significant regional variations exist within APAC; China and India are currently the largest markets, but substantial growth potential lies within Southeast Asia, driven by expanding economies and rising disposable incomes. The presence of both established multinational players and rapidly growing local manufacturers contributes to a competitive market dynamic. Future growth will likely be shaped by innovations in material science, focusing on sustainability and performance enhancement. The increasing adoption of advanced non-woven technologies and the growing emphasis on hygiene and safety will further contribute to the market's expansion in the coming years. A proactive approach to addressing supply chain challenges and embracing sustainable practices will be crucial for long-term success in this dynamic and rapidly evolving market.
APAC Non-Woven Fabrics Industry Company Market Share
APAC Non-Woven Fabrics Industry Market Report: 2019-2033
This comprehensive report provides an in-depth analysis of the Asia-Pacific (APAC) non-woven fabrics industry, offering valuable insights for industry professionals, investors, and strategic decision-makers. Covering the period from 2019 to 2033, with a base year of 2025, this report meticulously examines market dynamics, growth trends, dominant segments, and key players shaping the future of this rapidly evolving sector. The report projects a market size of xx Million Units by 2033.
APAC Non-Woven Fabrics Industry Market Dynamics & Structure
This section analyzes the competitive landscape of the APAC non-woven fabrics market, encompassing market concentration, technological advancements, regulatory landscapes, and prevalent M&A activities. The market is characterized by a mix of large multinational corporations and smaller specialized players. The level of concentration is moderate, with the top five players holding approximately xx% market share in 2024.
- Market Concentration: Moderate, with the top 5 players holding approximately xx% of the market share (2024).
- Technological Innovation: Continuous innovation in spun-bond, meltblown, and other technologies drives market growth. However, high initial investment costs represent a significant barrier for smaller players.
- Regulatory Frameworks: Varying regulations across APAC nations impact material sourcing and manufacturing processes. Compliance costs and environmental regulations contribute to production expenses.
- Competitive Product Substitutes: The industry faces competition from alternative materials, particularly in specific applications. However, non-wovens' versatility and cost-effectiveness maintain a competitive edge.
- End-User Demographics: Growth is primarily driven by increasing demand from healthcare, automotive, and construction sectors across emerging APAC economies.
- M&A Trends: A moderate level of M&A activity is observed, with larger players consolidating their market position through acquisitions of smaller, specialized firms. xx M&A deals were recorded between 2019 and 2024.
APAC Non-Woven Fabrics Industry Growth Trends & Insights
The APAC non-woven fabrics market exhibits robust growth, driven by factors including rising disposable incomes, expanding industrial sectors, and technological advancements. The market size expanded from xx Million Units in 2019 to xx Million Units in 2024, registering a CAGR of xx%. This growth trajectory is expected to continue, with a projected CAGR of xx% during the forecast period (2025-2033). The increasing adoption of non-woven fabrics in diverse applications, coupled with technological innovations and evolving consumer preferences, fuels this expansion. Market penetration in key end-use segments, like healthcare and automotive, remains high and steadily increasing. Technological disruptions, such as the introduction of sustainable and bio-based materials, further contribute to market expansion.
Dominant Regions, Countries, or Segments in APAC Non-Woven Fabrics Industry
China dominates the APAC non-woven fabrics market, followed by India and Japan. Within the segment breakdown:
- Technology: Spun-bond technology holds the largest market share due to its versatility and cost-effectiveness.
- Material: Polypropylene is the most widely used material, owing to its favorable properties and cost advantages.
- End-User Industry: The construction sector exhibits the highest demand for non-woven fabrics, followed closely by the healthcare sector.
Key Drivers:
- Rapid industrialization and urbanization: driving demand across various sectors.
- Favorable government policies: encouraging the development and adoption of sustainable materials.
- Expanding healthcare sector: particularly in emerging economies, fuels demand for medical non-wovens.
China's dominance stems from its large manufacturing base, robust infrastructure, and burgeoning consumer market. India’s significant growth is fueled by its expanding economy and increasing disposable incomes. Japan maintains a strong position owing to its advanced technological capabilities and established manufacturing sector.
APAC Non-Woven Fabrics Industry Product Landscape
The APAC non-woven fabrics market showcases a diverse range of products with varying properties and applications. Innovations focus on enhancing functionality, sustainability, and cost-effectiveness. Recent advancements include the development of bio-based non-wovens and improved barrier properties for medical applications. Key selling propositions center on product customization and tailored solutions to meet specific end-user needs. Technological advancements, particularly in material science and manufacturing processes, are driving the development of high-performance non-wovens.
Key Drivers, Barriers & Challenges in APAP Non-Woven Fabrics Industry
Key Drivers:
- Growing demand across diverse end-use sectors.
- Technological advancements leading to improved product performance.
- Government support for sustainable manufacturing.
Key Challenges:
- Fluctuations in raw material prices.
- Stringent environmental regulations.
- Intense competition from established players.
Emerging Opportunities in APAP Non-Woven Fabrics Industry
Emerging opportunities include:
- Growing demand for sustainable and bio-based non-wovens.
- Expansion into untapped markets within the APAC region.
- Development of innovative applications in emerging sectors like renewable energy.
Growth Accelerators in the APAC Non-Woven Fabrics Industry Industry
Long-term growth will be fueled by technological advancements in material science, process optimization, and the development of specialized non-wovens catering to niche applications. Strategic partnerships and collaborations between industry players will enhance innovation and market penetration. Expansion into new geographic markets and product diversification will further drive growth.
Key Players Shaping the APAC Non-Woven Fabrics Industry Market
- Ahlstrom
- Glatfelter Corporation
- Global Non Wovens Limited
- Ginni Filaments
- Freudenberg Performance Materials
- Cygnus Group
- Eximius Innovative Pvt Ltd
- Fitesa S A
- DuPont
- Autotech Nonwovens Pvt Ltd
- TORAY INDUSTRIES INC
- Johns Manville
- Berry Global Inc
- Reliance Non-woven Industry LLC
Notable Milestones in APAC Non-Woven Fabrics Industry Sector
- November 2022: Fitesa announced the expansion of its production capacity for nonwoven fabrics for medical applications, signaling increased demand in the healthcare sector.
In-Depth APAC Non-Woven Fabrics Industry Market Outlook
The APAC non-woven fabrics market is poised for sustained growth, driven by ongoing technological innovations, expanding end-use applications, and the increasing adoption of sustainable materials. Strategic investments in research and development, coupled with strategic partnerships and market expansion strategies, will further strengthen the market's position in the coming years. The focus on sustainable and eco-friendly non-wovens will be a key differentiator and growth driver.
APAC Non-Woven Fabrics Industry Segmentation
-
1. Technology
- 1.1. Spun-Bond
- 1.2. Wet Laid
- 1.3. Dry Laid
- 1.4. Others (Electrostatic spinning, Flash-spun, etc.)
-
2. Material
- 2.1. Polyester
- 2.2. Polypropylene
- 2.3. Polyethylene
- 2.4. Rayon
- 2.5. Others (Wood Pulp, Bio-Component, etc.)
-
3. End-User Industry
- 3.1. Construction
- 3.2. Textiles
- 3.3. Healthcare
- 3.4. Automotive
- 3.5. Others (Personal Care, Consumer Goods, etc.)
-
4. Geography
- 4.1. China
- 4.2. India
- 4.3. Japan
- 4.4. South Korea
- 4.5. Indonesia
- 4.6. Malaysia
- 4.7. Thailand
- 4.8. Vietnam
- 4.9. Rest of Asia-Pacific
APAC Non-Woven Fabrics Industry Segmentation By Geography
- 1. China
- 2. India
- 3. Japan
- 4. South Korea
- 5. Indonesia
- 6. Malaysia
- 7. Thailand
- 8. Vietnam
- 9. Rest of Asia Pacific
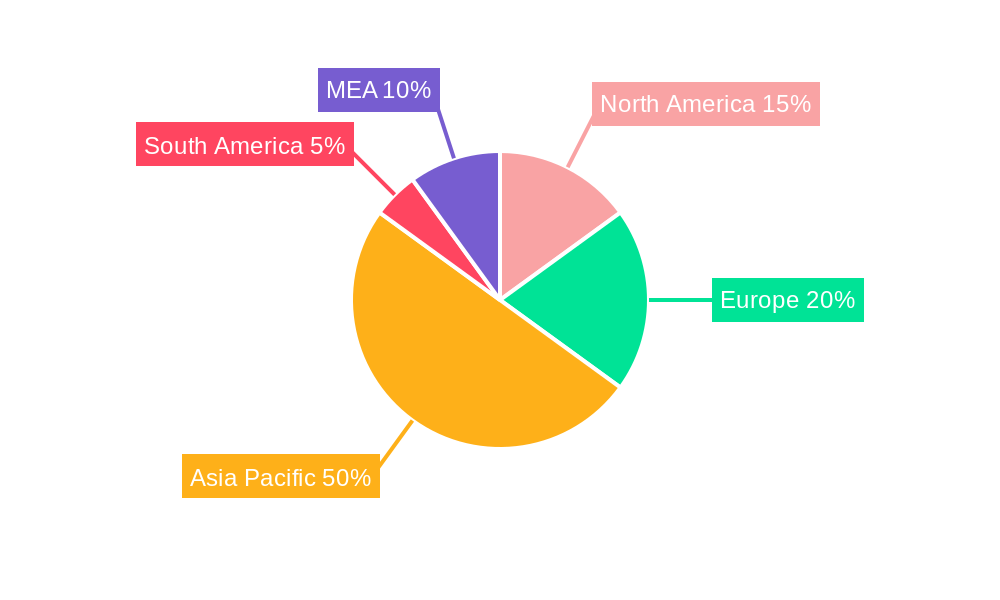
APAC Non-Woven Fabrics Industry Regional Market Share
Geographic Coverage of APAC Non-Woven Fabrics Industry
APAC Non-Woven Fabrics Industry REPORT HIGHLIGHTS
| Aspects | Details |
|---|---|
| Study Period | 2020-2034 |
| Base Year | 2025 |
| Estimated Year | 2026 |
| Forecast Period | 2026-2034 |
| Historical Period | 2020-2025 |
| Growth Rate | CAGR of > 8.00% from 2020-2034 |
| Segmentation |
|
Table of Contents
- 1. Introduction
- 1.1. Research Scope
- 1.2. Market Segmentation
- 1.3. Research Objective
- 1.4. Definitions and Assumptions
- 2. Executive Summary
- 2.1. Market Snapshot
- 3. Market Dynamics
- 3.1. Market Drivers
- 3.2. Market Restrains
- 3.3. Market Trends
- 3.4. Market Opportunities
- 4. Market Factor Analysis
- 4.1. Porters Five Forces
- 4.1.1. Bargaining Power of Suppliers
- 4.1.2. Bargaining Power of Buyers
- 4.1.3. Threat of New Entrants
- 4.1.4. Threat of Substitutes
- 4.1.5. Competitive Rivalry
- 4.2. PESTEL analysis
- 4.3. BCG Analysis
- 4.3.1. Stars (High Growth, High Market Share)
- 4.3.2. Cash Cows (Low Growth, High Market Share)
- 4.3.3. Question Mark (High Growth, Low Market Share)
- 4.3.4. Dogs (Low Growth, Low Market Share)
- 4.4. Ansoff Matrix Analysis
- 4.5. Supply Chain Analysis
- 4.6. Regulatory Landscape
- 4.7. Current Market Potential and Opportunity Assessment (TAM–SAM–SOM Framework)
- 4.8. IMR Analyst Note
- 4.1. Porters Five Forces
- 5. Market Analysis, Insights and Forecast 2021-2033
- 5.1. Market Analysis, Insights and Forecast - by Technology
- 5.1.1. Spun-Bond
- 5.1.2. Wet Laid
- 5.1.3. Dry Laid
- 5.1.4. Others (Electrostatic spinning, Flash-spun, etc.)
- 5.2. Market Analysis, Insights and Forecast - by Material
- 5.2.1. Polyester
- 5.2.2. Polypropylene
- 5.2.3. Polyethylene
- 5.2.4. Rayon
- 5.2.5. Others (Wood Pulp, Bio-Component, etc.)
- 5.3. Market Analysis, Insights and Forecast - by End-User Industry
- 5.3.1. Construction
- 5.3.2. Textiles
- 5.3.3. Healthcare
- 5.3.4. Automotive
- 5.3.5. Others (Personal Care, Consumer Goods, etc.)
- 5.4. Market Analysis, Insights and Forecast - by Geography
- 5.4.1. China
- 5.4.2. India
- 5.4.3. Japan
- 5.4.4. South Korea
- 5.4.5. Indonesia
- 5.4.6. Malaysia
- 5.4.7. Thailand
- 5.4.8. Vietnam
- 5.4.9. Rest of Asia-Pacific
- 5.5. Market Analysis, Insights and Forecast - by Region
- 5.5.1. China
- 5.5.2. India
- 5.5.3. Japan
- 5.5.4. South Korea
- 5.5.5. Indonesia
- 5.5.6. Malaysia
- 5.5.7. Thailand
- 5.5.8. Vietnam
- 5.5.9. Rest of Asia Pacific
- 5.1. Market Analysis, Insights and Forecast - by Technology
- 6. Global APAC Non-Woven Fabrics Industry Analysis, Insights and Forecast, 2021-2033
- 6.1. Market Analysis, Insights and Forecast - by Technology
- 6.1.1. Spun-Bond
- 6.1.2. Wet Laid
- 6.1.3. Dry Laid
- 6.1.4. Others (Electrostatic spinning, Flash-spun, etc.)
- 6.2. Market Analysis, Insights and Forecast - by Material
- 6.2.1. Polyester
- 6.2.2. Polypropylene
- 6.2.3. Polyethylene
- 6.2.4. Rayon
- 6.2.5. Others (Wood Pulp, Bio-Component, etc.)
- 6.3. Market Analysis, Insights and Forecast - by End-User Industry
- 6.3.1. Construction
- 6.3.2. Textiles
- 6.3.3. Healthcare
- 6.3.4. Automotive
- 6.3.5. Others (Personal Care, Consumer Goods, etc.)
- 6.4. Market Analysis, Insights and Forecast - by Geography
- 6.4.1. China
- 6.4.2. India
- 6.4.3. Japan
- 6.4.4. South Korea
- 6.4.5. Indonesia
- 6.4.6. Malaysia
- 6.4.7. Thailand
- 6.4.8. Vietnam
- 6.4.9. Rest of Asia-Pacific
- 6.1. Market Analysis, Insights and Forecast - by Technology
- 7. China APAC Non-Woven Fabrics Industry Analysis, Insights and Forecast, 2020-2032
- 7.1. Market Analysis, Insights and Forecast - by Technology
- 7.1.1. Spun-Bond
- 7.1.2. Wet Laid
- 7.1.3. Dry Laid
- 7.1.4. Others (Electrostatic spinning, Flash-spun, etc.)
- 7.2. Market Analysis, Insights and Forecast - by Material
- 7.2.1. Polyester
- 7.2.2. Polypropylene
- 7.2.3. Polyethylene
- 7.2.4. Rayon
- 7.2.5. Others (Wood Pulp, Bio-Component, etc.)
- 7.3. Market Analysis, Insights and Forecast - by End-User Industry
- 7.3.1. Construction
- 7.3.2. Textiles
- 7.3.3. Healthcare
- 7.3.4. Automotive
- 7.3.5. Others (Personal Care, Consumer Goods, etc.)
- 7.4. Market Analysis, Insights and Forecast - by Geography
- 7.4.1. China
- 7.4.2. India
- 7.4.3. Japan
- 7.4.4. South Korea
- 7.4.5. Indonesia
- 7.4.6. Malaysia
- 7.4.7. Thailand
- 7.4.8. Vietnam
- 7.4.9. Rest of Asia-Pacific
- 7.1. Market Analysis, Insights and Forecast - by Technology
- 8. India APAC Non-Woven Fabrics Industry Analysis, Insights and Forecast, 2020-2032
- 8.1. Market Analysis, Insights and Forecast - by Technology
- 8.1.1. Spun-Bond
- 8.1.2. Wet Laid
- 8.1.3. Dry Laid
- 8.1.4. Others (Electrostatic spinning, Flash-spun, etc.)
- 8.2. Market Analysis, Insights and Forecast - by Material
- 8.2.1. Polyester
- 8.2.2. Polypropylene
- 8.2.3. Polyethylene
- 8.2.4. Rayon
- 8.2.5. Others (Wood Pulp, Bio-Component, etc.)
- 8.3. Market Analysis, Insights and Forecast - by End-User Industry
- 8.3.1. Construction
- 8.3.2. Textiles
- 8.3.3. Healthcare
- 8.3.4. Automotive
- 8.3.5. Others (Personal Care, Consumer Goods, etc.)
- 8.4. Market Analysis, Insights and Forecast - by Geography
- 8.4.1. China
- 8.4.2. India
- 8.4.3. Japan
- 8.4.4. South Korea
- 8.4.5. Indonesia
- 8.4.6. Malaysia
- 8.4.7. Thailand
- 8.4.8. Vietnam
- 8.4.9. Rest of Asia-Pacific
- 8.1. Market Analysis, Insights and Forecast - by Technology
- 9. Japan APAC Non-Woven Fabrics Industry Analysis, Insights and Forecast, 2020-2032
- 9.1. Market Analysis, Insights and Forecast - by Technology
- 9.1.1. Spun-Bond
- 9.1.2. Wet Laid
- 9.1.3. Dry Laid
- 9.1.4. Others (Electrostatic spinning, Flash-spun, etc.)
- 9.2. Market Analysis, Insights and Forecast - by Material
- 9.2.1. Polyester
- 9.2.2. Polypropylene
- 9.2.3. Polyethylene
- 9.2.4. Rayon
- 9.2.5. Others (Wood Pulp, Bio-Component, etc.)
- 9.3. Market Analysis, Insights and Forecast - by End-User Industry
- 9.3.1. Construction
- 9.3.2. Textiles
- 9.3.3. Healthcare
- 9.3.4. Automotive
- 9.3.5. Others (Personal Care, Consumer Goods, etc.)
- 9.4. Market Analysis, Insights and Forecast - by Geography
- 9.4.1. China
- 9.4.2. India
- 9.4.3. Japan
- 9.4.4. South Korea
- 9.4.5. Indonesia
- 9.4.6. Malaysia
- 9.4.7. Thailand
- 9.4.8. Vietnam
- 9.4.9. Rest of Asia-Pacific
- 9.1. Market Analysis, Insights and Forecast - by Technology
- 10. South Korea APAC Non-Woven Fabrics Industry Analysis, Insights and Forecast, 2020-2032
- 10.1. Market Analysis, Insights and Forecast - by Technology
- 10.1.1. Spun-Bond
- 10.1.2. Wet Laid
- 10.1.3. Dry Laid
- 10.1.4. Others (Electrostatic spinning, Flash-spun, etc.)
- 10.2. Market Analysis, Insights and Forecast - by Material
- 10.2.1. Polyester
- 10.2.2. Polypropylene
- 10.2.3. Polyethylene
- 10.2.4. Rayon
- 10.2.5. Others (Wood Pulp, Bio-Component, etc.)
- 10.3. Market Analysis, Insights and Forecast - by End-User Industry
- 10.3.1. Construction
- 10.3.2. Textiles
- 10.3.3. Healthcare
- 10.3.4. Automotive
- 10.3.5. Others (Personal Care, Consumer Goods, etc.)
- 10.4. Market Analysis, Insights and Forecast - by Geography
- 10.4.1. China
- 10.4.2. India
- 10.4.3. Japan
- 10.4.4. South Korea
- 10.4.5. Indonesia
- 10.4.6. Malaysia
- 10.4.7. Thailand
- 10.4.8. Vietnam
- 10.4.9. Rest of Asia-Pacific
- 10.1. Market Analysis, Insights and Forecast - by Technology
- 11. Indonesia APAC Non-Woven Fabrics Industry Analysis, Insights and Forecast, 2020-2032
- 11.1. Market Analysis, Insights and Forecast - by Technology
- 11.1.1. Spun-Bond
- 11.1.2. Wet Laid
- 11.1.3. Dry Laid
- 11.1.4. Others (Electrostatic spinning, Flash-spun, etc.)
- 11.2. Market Analysis, Insights and Forecast - by Material
- 11.2.1. Polyester
- 11.2.2. Polypropylene
- 11.2.3. Polyethylene
- 11.2.4. Rayon
- 11.2.5. Others (Wood Pulp, Bio-Component, etc.)
- 11.3. Market Analysis, Insights and Forecast - by End-User Industry
- 11.3.1. Construction
- 11.3.2. Textiles
- 11.3.3. Healthcare
- 11.3.4. Automotive
- 11.3.5. Others (Personal Care, Consumer Goods, etc.)
- 11.4. Market Analysis, Insights and Forecast - by Geography
- 11.4.1. China
- 11.4.2. India
- 11.4.3. Japan
- 11.4.4. South Korea
- 11.4.5. Indonesia
- 11.4.6. Malaysia
- 11.4.7. Thailand
- 11.4.8. Vietnam
- 11.4.9. Rest of Asia-Pacific
- 11.1. Market Analysis, Insights and Forecast - by Technology
- 12. Malaysia APAC Non-Woven Fabrics Industry Analysis, Insights and Forecast, 2020-2032
- 12.1. Market Analysis, Insights and Forecast - by Technology
- 12.1.1. Spun-Bond
- 12.1.2. Wet Laid
- 12.1.3. Dry Laid
- 12.1.4. Others (Electrostatic spinning, Flash-spun, etc.)
- 12.2. Market Analysis, Insights and Forecast - by Material
- 12.2.1. Polyester
- 12.2.2. Polypropylene
- 12.2.3. Polyethylene
- 12.2.4. Rayon
- 12.2.5. Others (Wood Pulp, Bio-Component, etc.)
- 12.3. Market Analysis, Insights and Forecast - by End-User Industry
- 12.3.1. Construction
- 12.3.2. Textiles
- 12.3.3. Healthcare
- 12.3.4. Automotive
- 12.3.5. Others (Personal Care, Consumer Goods, etc.)
- 12.4. Market Analysis, Insights and Forecast - by Geography
- 12.4.1. China
- 12.4.2. India
- 12.4.3. Japan
- 12.4.4. South Korea
- 12.4.5. Indonesia
- 12.4.6. Malaysia
- 12.4.7. Thailand
- 12.4.8. Vietnam
- 12.4.9. Rest of Asia-Pacific
- 12.1. Market Analysis, Insights and Forecast - by Technology
- 13. Thailand APAC Non-Woven Fabrics Industry Analysis, Insights and Forecast, 2020-2032
- 13.1. Market Analysis, Insights and Forecast - by Technology
- 13.1.1. Spun-Bond
- 13.1.2. Wet Laid
- 13.1.3. Dry Laid
- 13.1.4. Others (Electrostatic spinning, Flash-spun, etc.)
- 13.2. Market Analysis, Insights and Forecast - by Material
- 13.2.1. Polyester
- 13.2.2. Polypropylene
- 13.2.3. Polyethylene
- 13.2.4. Rayon
- 13.2.5. Others (Wood Pulp, Bio-Component, etc.)
- 13.3. Market Analysis, Insights and Forecast - by End-User Industry
- 13.3.1. Construction
- 13.3.2. Textiles
- 13.3.3. Healthcare
- 13.3.4. Automotive
- 13.3.5. Others (Personal Care, Consumer Goods, etc.)
- 13.4. Market Analysis, Insights and Forecast - by Geography
- 13.4.1. China
- 13.4.2. India
- 13.4.3. Japan
- 13.4.4. South Korea
- 13.4.5. Indonesia
- 13.4.6. Malaysia
- 13.4.7. Thailand
- 13.4.8. Vietnam
- 13.4.9. Rest of Asia-Pacific
- 13.1. Market Analysis, Insights and Forecast - by Technology
- 14. Vietnam APAC Non-Woven Fabrics Industry Analysis, Insights and Forecast, 2020-2032
- 14.1. Market Analysis, Insights and Forecast - by Technology
- 14.1.1. Spun-Bond
- 14.1.2. Wet Laid
- 14.1.3. Dry Laid
- 14.1.4. Others (Electrostatic spinning, Flash-spun, etc.)
- 14.2. Market Analysis, Insights and Forecast - by Material
- 14.2.1. Polyester
- 14.2.2. Polypropylene
- 14.2.3. Polyethylene
- 14.2.4. Rayon
- 14.2.5. Others (Wood Pulp, Bio-Component, etc.)
- 14.3. Market Analysis, Insights and Forecast - by End-User Industry
- 14.3.1. Construction
- 14.3.2. Textiles
- 14.3.3. Healthcare
- 14.3.4. Automotive
- 14.3.5. Others (Personal Care, Consumer Goods, etc.)
- 14.4. Market Analysis, Insights and Forecast - by Geography
- 14.4.1. China
- 14.4.2. India
- 14.4.3. Japan
- 14.4.4. South Korea
- 14.4.5. Indonesia
- 14.4.6. Malaysia
- 14.4.7. Thailand
- 14.4.8. Vietnam
- 14.4.9. Rest of Asia-Pacific
- 14.1. Market Analysis, Insights and Forecast - by Technology
- 15. Rest of Asia Pacific APAC Non-Woven Fabrics Industry Analysis, Insights and Forecast, 2020-2032
- 15.1. Market Analysis, Insights and Forecast - by Technology
- 15.1.1. Spun-Bond
- 15.1.2. Wet Laid
- 15.1.3. Dry Laid
- 15.1.4. Others (Electrostatic spinning, Flash-spun, etc.)
- 15.2. Market Analysis, Insights and Forecast - by Material
- 15.2.1. Polyester
- 15.2.2. Polypropylene
- 15.2.3. Polyethylene
- 15.2.4. Rayon
- 15.2.5. Others (Wood Pulp, Bio-Component, etc.)
- 15.3. Market Analysis, Insights and Forecast - by End-User Industry
- 15.3.1. Construction
- 15.3.2. Textiles
- 15.3.3. Healthcare
- 15.3.4. Automotive
- 15.3.5. Others (Personal Care, Consumer Goods, etc.)
- 15.4. Market Analysis, Insights and Forecast - by Geography
- 15.4.1. China
- 15.4.2. India
- 15.4.3. Japan
- 15.4.4. South Korea
- 15.4.5. Indonesia
- 15.4.6. Malaysia
- 15.4.7. Thailand
- 15.4.8. Vietnam
- 15.4.9. Rest of Asia-Pacific
- 15.1. Market Analysis, Insights and Forecast - by Technology
- 16. Competitive Analysis
- 16.1. Company Profiles
- 16.1.1 Ahlstrom
- 16.1.1.1. Company Overview
- 16.1.1.2. Products
- 16.1.1.3. Company Financials
- 16.1.1.4. SWOT Analysis
- 16.1.2 Glatfelter Corporation
- 16.1.2.1. Company Overview
- 16.1.2.2. Products
- 16.1.2.3. Company Financials
- 16.1.2.4. SWOT Analysis
- 16.1.3 Global Non Wovens Limited
- 16.1.3.1. Company Overview
- 16.1.3.2. Products
- 16.1.3.3. Company Financials
- 16.1.3.4. SWOT Analysis
- 16.1.4 Ginni Filaments
- 16.1.4.1. Company Overview
- 16.1.4.2. Products
- 16.1.4.3. Company Financials
- 16.1.4.4. SWOT Analysis
- 16.1.5 Freudenberg Performance Materials
- 16.1.5.1. Company Overview
- 16.1.5.2. Products
- 16.1.5.3. Company Financials
- 16.1.5.4. SWOT Analysis
- 16.1.6 Cygnus Group
- 16.1.6.1. Company Overview
- 16.1.6.2. Products
- 16.1.6.3. Company Financials
- 16.1.6.4. SWOT Analysis
- 16.1.7 Eximius Innovative Pvt Ltd
- 16.1.7.1. Company Overview
- 16.1.7.2. Products
- 16.1.7.3. Company Financials
- 16.1.7.4. SWOT Analysis
- 16.1.8 Fitesa S A
- 16.1.8.1. Company Overview
- 16.1.8.2. Products
- 16.1.8.3. Company Financials
- 16.1.8.4. SWOT Analysis
- 16.1.9 DuPont
- 16.1.9.1. Company Overview
- 16.1.9.2. Products
- 16.1.9.3. Company Financials
- 16.1.9.4. SWOT Analysis
- 16.1.10 Autotech Nonwovens Pvt Ltd
- 16.1.10.1. Company Overview
- 16.1.10.2. Products
- 16.1.10.3. Company Financials
- 16.1.10.4. SWOT Analysis
- 16.1.11 TORAY INDUSTRIES INC *List Not Exhaustive
- 16.1.11.1. Company Overview
- 16.1.11.2. Products
- 16.1.11.3. Company Financials
- 16.1.11.4. SWOT Analysis
- 16.1.12 Johns Manville
- 16.1.12.1. Company Overview
- 16.1.12.2. Products
- 16.1.12.3. Company Financials
- 16.1.12.4. SWOT Analysis
- 16.1.13 Berry Global Inc
- 16.1.13.1. Company Overview
- 16.1.13.2. Products
- 16.1.13.3. Company Financials
- 16.1.13.4. SWOT Analysis
- 16.1.14 Reliance Non-woven Industry LLC
- 16.1.14.1. Company Overview
- 16.1.14.2. Products
- 16.1.14.3. Company Financials
- 16.1.14.4. SWOT Analysis
- 16.1.1 Ahlstrom
- 16.2. Market Entropy
- 16.2.1 Company's Key Areas Served
- 16.2.2 Recent Developments
- 16.3. Company Market Share Analysis 2025
- 16.3.1 Top 5 Companies Market Share Analysis
- 16.3.2 Top 3 Companies Market Share Analysis
- 16.4. List of Potential Customers
- 17. Research Methodology
List of Figures
- Figure 1: Global APAC Non-Woven Fabrics Industry Revenue Breakdown (Million, %) by Region 2025 & 2033
- Figure 2: Global APAC Non-Woven Fabrics Industry Volume Breakdown (K Tons, %) by Region 2025 & 2033
- Figure 3: China APAC Non-Woven Fabrics Industry Revenue (Million), by Technology 2025 & 2033
- Figure 4: China APAC Non-Woven Fabrics Industry Volume (K Tons), by Technology 2025 & 2033
- Figure 5: China APAC Non-Woven Fabrics Industry Revenue Share (%), by Technology 2025 & 2033
- Figure 6: China APAC Non-Woven Fabrics Industry Volume Share (%), by Technology 2025 & 2033
- Figure 7: China APAC Non-Woven Fabrics Industry Revenue (Million), by Material 2025 & 2033
- Figure 8: China APAC Non-Woven Fabrics Industry Volume (K Tons), by Material 2025 & 2033
- Figure 9: China APAC Non-Woven Fabrics Industry Revenue Share (%), by Material 2025 & 2033
- Figure 10: China APAC Non-Woven Fabrics Industry Volume Share (%), by Material 2025 & 2033
- Figure 11: China APAC Non-Woven Fabrics Industry Revenue (Million), by End-User Industry 2025 & 2033
- Figure 12: China APAC Non-Woven Fabrics Industry Volume (K Tons), by End-User Industry 2025 & 2033
- Figure 13: China APAC Non-Woven Fabrics Industry Revenue Share (%), by End-User Industry 2025 & 2033
- Figure 14: China APAC Non-Woven Fabrics Industry Volume Share (%), by End-User Industry 2025 & 2033
- Figure 15: China APAC Non-Woven Fabrics Industry Revenue (Million), by Geography 2025 & 2033
- Figure 16: China APAC Non-Woven Fabrics Industry Volume (K Tons), by Geography 2025 & 2033
- Figure 17: China APAC Non-Woven Fabrics Industry Revenue Share (%), by Geography 2025 & 2033
- Figure 18: China APAC Non-Woven Fabrics Industry Volume Share (%), by Geography 2025 & 2033
- Figure 19: China APAC Non-Woven Fabrics Industry Revenue (Million), by Country 2025 & 2033
- Figure 20: China APAC Non-Woven Fabrics Industry Volume (K Tons), by Country 2025 & 2033
- Figure 21: China APAC Non-Woven Fabrics Industry Revenue Share (%), by Country 2025 & 2033
- Figure 22: China APAC Non-Woven Fabrics Industry Volume Share (%), by Country 2025 & 2033
- Figure 23: India APAC Non-Woven Fabrics Industry Revenue (Million), by Technology 2025 & 2033
- Figure 24: India APAC Non-Woven Fabrics Industry Volume (K Tons), by Technology 2025 & 2033
- Figure 25: India APAC Non-Woven Fabrics Industry Revenue Share (%), by Technology 2025 & 2033
- Figure 26: India APAC Non-Woven Fabrics Industry Volume Share (%), by Technology 2025 & 2033
- Figure 27: India APAC Non-Woven Fabrics Industry Revenue (Million), by Material 2025 & 2033
- Figure 28: India APAC Non-Woven Fabrics Industry Volume (K Tons), by Material 2025 & 2033
- Figure 29: India APAC Non-Woven Fabrics Industry Revenue Share (%), by Material 2025 & 2033
- Figure 30: India APAC Non-Woven Fabrics Industry Volume Share (%), by Material 2025 & 2033
- Figure 31: India APAC Non-Woven Fabrics Industry Revenue (Million), by End-User Industry 2025 & 2033
- Figure 32: India APAC Non-Woven Fabrics Industry Volume (K Tons), by End-User Industry 2025 & 2033
- Figure 33: India APAC Non-Woven Fabrics Industry Revenue Share (%), by End-User Industry 2025 & 2033
- Figure 34: India APAC Non-Woven Fabrics Industry Volume Share (%), by End-User Industry 2025 & 2033
- Figure 35: India APAC Non-Woven Fabrics Industry Revenue (Million), by Geography 2025 & 2033
- Figure 36: India APAC Non-Woven Fabrics Industry Volume (K Tons), by Geography 2025 & 2033
- Figure 37: India APAC Non-Woven Fabrics Industry Revenue Share (%), by Geography 2025 & 2033
- Figure 38: India APAC Non-Woven Fabrics Industry Volume Share (%), by Geography 2025 & 2033
- Figure 39: India APAC Non-Woven Fabrics Industry Revenue (Million), by Country 2025 & 2033
- Figure 40: India APAC Non-Woven Fabrics Industry Volume (K Tons), by Country 2025 & 2033
- Figure 41: India APAC Non-Woven Fabrics Industry Revenue Share (%), by Country 2025 & 2033
- Figure 42: India APAC Non-Woven Fabrics Industry Volume Share (%), by Country 2025 & 2033
- Figure 43: Japan APAC Non-Woven Fabrics Industry Revenue (Million), by Technology 2025 & 2033
- Figure 44: Japan APAC Non-Woven Fabrics Industry Volume (K Tons), by Technology 2025 & 2033
- Figure 45: Japan APAC Non-Woven Fabrics Industry Revenue Share (%), by Technology 2025 & 2033
- Figure 46: Japan APAC Non-Woven Fabrics Industry Volume Share (%), by Technology 2025 & 2033
- Figure 47: Japan APAC Non-Woven Fabrics Industry Revenue (Million), by Material 2025 & 2033
- Figure 48: Japan APAC Non-Woven Fabrics Industry Volume (K Tons), by Material 2025 & 2033
- Figure 49: Japan APAC Non-Woven Fabrics Industry Revenue Share (%), by Material 2025 & 2033
- Figure 50: Japan APAC Non-Woven Fabrics Industry Volume Share (%), by Material 2025 & 2033
- Figure 51: Japan APAC Non-Woven Fabrics Industry Revenue (Million), by End-User Industry 2025 & 2033
- Figure 52: Japan APAC Non-Woven Fabrics Industry Volume (K Tons), by End-User Industry 2025 & 2033
- Figure 53: Japan APAC Non-Woven Fabrics Industry Revenue Share (%), by End-User Industry 2025 & 2033
- Figure 54: Japan APAC Non-Woven Fabrics Industry Volume Share (%), by End-User Industry 2025 & 2033
- Figure 55: Japan APAC Non-Woven Fabrics Industry Revenue (Million), by Geography 2025 & 2033
- Figure 56: Japan APAC Non-Woven Fabrics Industry Volume (K Tons), by Geography 2025 & 2033
- Figure 57: Japan APAC Non-Woven Fabrics Industry Revenue Share (%), by Geography 2025 & 2033
- Figure 58: Japan APAC Non-Woven Fabrics Industry Volume Share (%), by Geography 2025 & 2033
- Figure 59: Japan APAC Non-Woven Fabrics Industry Revenue (Million), by Country 2025 & 2033
- Figure 60: Japan APAC Non-Woven Fabrics Industry Volume (K Tons), by Country 2025 & 2033
- Figure 61: Japan APAC Non-Woven Fabrics Industry Revenue Share (%), by Country 2025 & 2033
- Figure 62: Japan APAC Non-Woven Fabrics Industry Volume Share (%), by Country 2025 & 2033
- Figure 63: South Korea APAC Non-Woven Fabrics Industry Revenue (Million), by Technology 2025 & 2033
- Figure 64: South Korea APAC Non-Woven Fabrics Industry Volume (K Tons), by Technology 2025 & 2033
- Figure 65: South Korea APAC Non-Woven Fabrics Industry Revenue Share (%), by Technology 2025 & 2033
- Figure 66: South Korea APAC Non-Woven Fabrics Industry Volume Share (%), by Technology 2025 & 2033
- Figure 67: South Korea APAC Non-Woven Fabrics Industry Revenue (Million), by Material 2025 & 2033
- Figure 68: South Korea APAC Non-Woven Fabrics Industry Volume (K Tons), by Material 2025 & 2033
- Figure 69: South Korea APAC Non-Woven Fabrics Industry Revenue Share (%), by Material 2025 & 2033
- Figure 70: South Korea APAC Non-Woven Fabrics Industry Volume Share (%), by Material 2025 & 2033
- Figure 71: South Korea APAC Non-Woven Fabrics Industry Revenue (Million), by End-User Industry 2025 & 2033
- Figure 72: South Korea APAC Non-Woven Fabrics Industry Volume (K Tons), by End-User Industry 2025 & 2033
- Figure 73: South Korea APAC Non-Woven Fabrics Industry Revenue Share (%), by End-User Industry 2025 & 2033
- Figure 74: South Korea APAC Non-Woven Fabrics Industry Volume Share (%), by End-User Industry 2025 & 2033
- Figure 75: South Korea APAC Non-Woven Fabrics Industry Revenue (Million), by Geography 2025 & 2033
- Figure 76: South Korea APAC Non-Woven Fabrics Industry Volume (K Tons), by Geography 2025 & 2033
- Figure 77: South Korea APAC Non-Woven Fabrics Industry Revenue Share (%), by Geography 2025 & 2033
- Figure 78: South Korea APAC Non-Woven Fabrics Industry Volume Share (%), by Geography 2025 & 2033
- Figure 79: South Korea APAC Non-Woven Fabrics Industry Revenue (Million), by Country 2025 & 2033
- Figure 80: South Korea APAC Non-Woven Fabrics Industry Volume (K Tons), by Country 2025 & 2033
- Figure 81: South Korea APAC Non-Woven Fabrics Industry Revenue Share (%), by Country 2025 & 2033
- Figure 82: South Korea APAC Non-Woven Fabrics Industry Volume Share (%), by Country 2025 & 2033
- Figure 83: Indonesia APAC Non-Woven Fabrics Industry Revenue (Million), by Technology 2025 & 2033
- Figure 84: Indonesia APAC Non-Woven Fabrics Industry Volume (K Tons), by Technology 2025 & 2033
- Figure 85: Indonesia APAC Non-Woven Fabrics Industry Revenue Share (%), by Technology 2025 & 2033
- Figure 86: Indonesia APAC Non-Woven Fabrics Industry Volume Share (%), by Technology 2025 & 2033
- Figure 87: Indonesia APAC Non-Woven Fabrics Industry Revenue (Million), by Material 2025 & 2033
- Figure 88: Indonesia APAC Non-Woven Fabrics Industry Volume (K Tons), by Material 2025 & 2033
- Figure 89: Indonesia APAC Non-Woven Fabrics Industry Revenue Share (%), by Material 2025 & 2033
- Figure 90: Indonesia APAC Non-Woven Fabrics Industry Volume Share (%), by Material 2025 & 2033
- Figure 91: Indonesia APAC Non-Woven Fabrics Industry Revenue (Million), by End-User Industry 2025 & 2033
- Figure 92: Indonesia APAC Non-Woven Fabrics Industry Volume (K Tons), by End-User Industry 2025 & 2033
- Figure 93: Indonesia APAC Non-Woven Fabrics Industry Revenue Share (%), by End-User Industry 2025 & 2033
- Figure 94: Indonesia APAC Non-Woven Fabrics Industry Volume Share (%), by End-User Industry 2025 & 2033
- Figure 95: Indonesia APAC Non-Woven Fabrics Industry Revenue (Million), by Geography 2025 & 2033
- Figure 96: Indonesia APAC Non-Woven Fabrics Industry Volume (K Tons), by Geography 2025 & 2033
- Figure 97: Indonesia APAC Non-Woven Fabrics Industry Revenue Share (%), by Geography 2025 & 2033
- Figure 98: Indonesia APAC Non-Woven Fabrics Industry Volume Share (%), by Geography 2025 & 2033
- Figure 99: Indonesia APAC Non-Woven Fabrics Industry Revenue (Million), by Country 2025 & 2033
- Figure 100: Indonesia APAC Non-Woven Fabrics Industry Volume (K Tons), by Country 2025 & 2033
- Figure 101: Indonesia APAC Non-Woven Fabrics Industry Revenue Share (%), by Country 2025 & 2033
- Figure 102: Indonesia APAC Non-Woven Fabrics Industry Volume Share (%), by Country 2025 & 2033
- Figure 103: Malaysia APAC Non-Woven Fabrics Industry Revenue (Million), by Technology 2025 & 2033
- Figure 104: Malaysia APAC Non-Woven Fabrics Industry Volume (K Tons), by Technology 2025 & 2033
- Figure 105: Malaysia APAC Non-Woven Fabrics Industry Revenue Share (%), by Technology 2025 & 2033
- Figure 106: Malaysia APAC Non-Woven Fabrics Industry Volume Share (%), by Technology 2025 & 2033
- Figure 107: Malaysia APAC Non-Woven Fabrics Industry Revenue (Million), by Material 2025 & 2033
- Figure 108: Malaysia APAC Non-Woven Fabrics Industry Volume (K Tons), by Material 2025 & 2033
- Figure 109: Malaysia APAC Non-Woven Fabrics Industry Revenue Share (%), by Material 2025 & 2033
- Figure 110: Malaysia APAC Non-Woven Fabrics Industry Volume Share (%), by Material 2025 & 2033
- Figure 111: Malaysia APAC Non-Woven Fabrics Industry Revenue (Million), by End-User Industry 2025 & 2033
- Figure 112: Malaysia APAC Non-Woven Fabrics Industry Volume (K Tons), by End-User Industry 2025 & 2033
- Figure 113: Malaysia APAC Non-Woven Fabrics Industry Revenue Share (%), by End-User Industry 2025 & 2033
- Figure 114: Malaysia APAC Non-Woven Fabrics Industry Volume Share (%), by End-User Industry 2025 & 2033
- Figure 115: Malaysia APAC Non-Woven Fabrics Industry Revenue (Million), by Geography 2025 & 2033
- Figure 116: Malaysia APAC Non-Woven Fabrics Industry Volume (K Tons), by Geography 2025 & 2033
- Figure 117: Malaysia APAC Non-Woven Fabrics Industry Revenue Share (%), by Geography 2025 & 2033
- Figure 118: Malaysia APAC Non-Woven Fabrics Industry Volume Share (%), by Geography 2025 & 2033
- Figure 119: Malaysia APAC Non-Woven Fabrics Industry Revenue (Million), by Country 2025 & 2033
- Figure 120: Malaysia APAC Non-Woven Fabrics Industry Volume (K Tons), by Country 2025 & 2033
- Figure 121: Malaysia APAC Non-Woven Fabrics Industry Revenue Share (%), by Country 2025 & 2033
- Figure 122: Malaysia APAC Non-Woven Fabrics Industry Volume Share (%), by Country 2025 & 2033
- Figure 123: Thailand APAC Non-Woven Fabrics Industry Revenue (Million), by Technology 2025 & 2033
- Figure 124: Thailand APAC Non-Woven Fabrics Industry Volume (K Tons), by Technology 2025 & 2033
- Figure 125: Thailand APAC Non-Woven Fabrics Industry Revenue Share (%), by Technology 2025 & 2033
- Figure 126: Thailand APAC Non-Woven Fabrics Industry Volume Share (%), by Technology 2025 & 2033
- Figure 127: Thailand APAC Non-Woven Fabrics Industry Revenue (Million), by Material 2025 & 2033
- Figure 128: Thailand APAC Non-Woven Fabrics Industry Volume (K Tons), by Material 2025 & 2033
- Figure 129: Thailand APAC Non-Woven Fabrics Industry Revenue Share (%), by Material 2025 & 2033
- Figure 130: Thailand APAC Non-Woven Fabrics Industry Volume Share (%), by Material 2025 & 2033
- Figure 131: Thailand APAC Non-Woven Fabrics Industry Revenue (Million), by End-User Industry 2025 & 2033
- Figure 132: Thailand APAC Non-Woven Fabrics Industry Volume (K Tons), by End-User Industry 2025 & 2033
- Figure 133: Thailand APAC Non-Woven Fabrics Industry Revenue Share (%), by End-User Industry 2025 & 2033
- Figure 134: Thailand APAC Non-Woven Fabrics Industry Volume Share (%), by End-User Industry 2025 & 2033
- Figure 135: Thailand APAC Non-Woven Fabrics Industry Revenue (Million), by Geography 2025 & 2033
- Figure 136: Thailand APAC Non-Woven Fabrics Industry Volume (K Tons), by Geography 2025 & 2033
- Figure 137: Thailand APAC Non-Woven Fabrics Industry Revenue Share (%), by Geography 2025 & 2033
- Figure 138: Thailand APAC Non-Woven Fabrics Industry Volume Share (%), by Geography 2025 & 2033
- Figure 139: Thailand APAC Non-Woven Fabrics Industry Revenue (Million), by Country 2025 & 2033
- Figure 140: Thailand APAC Non-Woven Fabrics Industry Volume (K Tons), by Country 2025 & 2033
- Figure 141: Thailand APAC Non-Woven Fabrics Industry Revenue Share (%), by Country 2025 & 2033
- Figure 142: Thailand APAC Non-Woven Fabrics Industry Volume Share (%), by Country 2025 & 2033
- Figure 143: Vietnam APAC Non-Woven Fabrics Industry Revenue (Million), by Technology 2025 & 2033
- Figure 144: Vietnam APAC Non-Woven Fabrics Industry Volume (K Tons), by Technology 2025 & 2033
- Figure 145: Vietnam APAC Non-Woven Fabrics Industry Revenue Share (%), by Technology 2025 & 2033
- Figure 146: Vietnam APAC Non-Woven Fabrics Industry Volume Share (%), by Technology 2025 & 2033
- Figure 147: Vietnam APAC Non-Woven Fabrics Industry Revenue (Million), by Material 2025 & 2033
- Figure 148: Vietnam APAC Non-Woven Fabrics Industry Volume (K Tons), by Material 2025 & 2033
- Figure 149: Vietnam APAC Non-Woven Fabrics Industry Revenue Share (%), by Material 2025 & 2033
- Figure 150: Vietnam APAC Non-Woven Fabrics Industry Volume Share (%), by Material 2025 & 2033
- Figure 151: Vietnam APAC Non-Woven Fabrics Industry Revenue (Million), by End-User Industry 2025 & 2033
- Figure 152: Vietnam APAC Non-Woven Fabrics Industry Volume (K Tons), by End-User Industry 2025 & 2033
- Figure 153: Vietnam APAC Non-Woven Fabrics Industry Revenue Share (%), by End-User Industry 2025 & 2033
- Figure 154: Vietnam APAC Non-Woven Fabrics Industry Volume Share (%), by End-User Industry 2025 & 2033
- Figure 155: Vietnam APAC Non-Woven Fabrics Industry Revenue (Million), by Geography 2025 & 2033
- Figure 156: Vietnam APAC Non-Woven Fabrics Industry Volume (K Tons), by Geography 2025 & 2033
- Figure 157: Vietnam APAC Non-Woven Fabrics Industry Revenue Share (%), by Geography 2025 & 2033
- Figure 158: Vietnam APAC Non-Woven Fabrics Industry Volume Share (%), by Geography 2025 & 2033
- Figure 159: Vietnam APAC Non-Woven Fabrics Industry Revenue (Million), by Country 2025 & 2033
- Figure 160: Vietnam APAC Non-Woven Fabrics Industry Volume (K Tons), by Country 2025 & 2033
- Figure 161: Vietnam APAC Non-Woven Fabrics Industry Revenue Share (%), by Country 2025 & 2033
- Figure 162: Vietnam APAC Non-Woven Fabrics Industry Volume Share (%), by Country 2025 & 2033
- Figure 163: Rest of Asia Pacific APAC Non-Woven Fabrics Industry Revenue (Million), by Technology 2025 & 2033
- Figure 164: Rest of Asia Pacific APAC Non-Woven Fabrics Industry Volume (K Tons), by Technology 2025 & 2033
- Figure 165: Rest of Asia Pacific APAC Non-Woven Fabrics Industry Revenue Share (%), by Technology 2025 & 2033
- Figure 166: Rest of Asia Pacific APAC Non-Woven Fabrics Industry Volume Share (%), by Technology 2025 & 2033
- Figure 167: Rest of Asia Pacific APAC Non-Woven Fabrics Industry Revenue (Million), by Material 2025 & 2033
- Figure 168: Rest of Asia Pacific APAC Non-Woven Fabrics Industry Volume (K Tons), by Material 2025 & 2033
- Figure 169: Rest of Asia Pacific APAC Non-Woven Fabrics Industry Revenue Share (%), by Material 2025 & 2033
- Figure 170: Rest of Asia Pacific APAC Non-Woven Fabrics Industry Volume Share (%), by Material 2025 & 2033
- Figure 171: Rest of Asia Pacific APAC Non-Woven Fabrics Industry Revenue (Million), by End-User Industry 2025 & 2033
- Figure 172: Rest of Asia Pacific APAC Non-Woven Fabrics Industry Volume (K Tons), by End-User Industry 2025 & 2033
- Figure 173: Rest of Asia Pacific APAC Non-Woven Fabrics Industry Revenue Share (%), by End-User Industry 2025 & 2033
- Figure 174: Rest of Asia Pacific APAC Non-Woven Fabrics Industry Volume Share (%), by End-User Industry 2025 & 2033
- Figure 175: Rest of Asia Pacific APAC Non-Woven Fabrics Industry Revenue (Million), by Geography 2025 & 2033
- Figure 176: Rest of Asia Pacific APAC Non-Woven Fabrics Industry Volume (K Tons), by Geography 2025 & 2033
- Figure 177: Rest of Asia Pacific APAC Non-Woven Fabrics Industry Revenue Share (%), by Geography 2025 & 2033
- Figure 178: Rest of Asia Pacific APAC Non-Woven Fabrics Industry Volume Share (%), by Geography 2025 & 2033
- Figure 179: Rest of Asia Pacific APAC Non-Woven Fabrics Industry Revenue (Million), by Country 2025 & 2033
- Figure 180: Rest of Asia Pacific APAC Non-Woven Fabrics Industry Volume (K Tons), by Country 2025 & 2033
- Figure 181: Rest of Asia Pacific APAC Non-Woven Fabrics Industry Revenue Share (%), by Country 2025 & 2033
- Figure 182: Rest of Asia Pacific APAC Non-Woven Fabrics Industry Volume Share (%), by Country 2025 & 2033
List of Tables
- Table 1: Global APAC Non-Woven Fabrics Industry Revenue Million Forecast, by Technology 2020 & 2033
- Table 2: Global APAC Non-Woven Fabrics Industry Volume K Tons Forecast, by Technology 2020 & 2033
- Table 3: Global APAC Non-Woven Fabrics Industry Revenue Million Forecast, by Material 2020 & 2033
- Table 4: Global APAC Non-Woven Fabrics Industry Volume K Tons Forecast, by Material 2020 & 2033
- Table 5: Global APAC Non-Woven Fabrics Industry Revenue Million Forecast, by End-User Industry 2020 & 2033
- Table 6: Global APAC Non-Woven Fabrics Industry Volume K Tons Forecast, by End-User Industry 2020 & 2033
- Table 7: Global APAC Non-Woven Fabrics Industry Revenue Million Forecast, by Geography 2020 & 2033
- Table 8: Global APAC Non-Woven Fabrics Industry Volume K Tons Forecast, by Geography 2020 & 2033
- Table 9: Global APAC Non-Woven Fabrics Industry Revenue Million Forecast, by Region 2020 & 2033
- Table 10: Global APAC Non-Woven Fabrics Industry Volume K Tons Forecast, by Region 2020 & 2033
- Table 11: Global APAC Non-Woven Fabrics Industry Revenue Million Forecast, by Technology 2020 & 2033
- Table 12: Global APAC Non-Woven Fabrics Industry Volume K Tons Forecast, by Technology 2020 & 2033
- Table 13: Global APAC Non-Woven Fabrics Industry Revenue Million Forecast, by Material 2020 & 2033
- Table 14: Global APAC Non-Woven Fabrics Industry Volume K Tons Forecast, by Material 2020 & 2033
- Table 15: Global APAC Non-Woven Fabrics Industry Revenue Million Forecast, by End-User Industry 2020 & 2033
- Table 16: Global APAC Non-Woven Fabrics Industry Volume K Tons Forecast, by End-User Industry 2020 & 2033
- Table 17: Global APAC Non-Woven Fabrics Industry Revenue Million Forecast, by Geography 2020 & 2033
- Table 18: Global APAC Non-Woven Fabrics Industry Volume K Tons Forecast, by Geography 2020 & 2033
- Table 19: Global APAC Non-Woven Fabrics Industry Revenue Million Forecast, by Country 2020 & 2033
- Table 20: Global APAC Non-Woven Fabrics Industry Volume K Tons Forecast, by Country 2020 & 2033
- Table 21: Global APAC Non-Woven Fabrics Industry Revenue Million Forecast, by Technology 2020 & 2033
- Table 22: Global APAC Non-Woven Fabrics Industry Volume K Tons Forecast, by Technology 2020 & 2033
- Table 23: Global APAC Non-Woven Fabrics Industry Revenue Million Forecast, by Material 2020 & 2033
- Table 24: Global APAC Non-Woven Fabrics Industry Volume K Tons Forecast, by Material 2020 & 2033
- Table 25: Global APAC Non-Woven Fabrics Industry Revenue Million Forecast, by End-User Industry 2020 & 2033
- Table 26: Global APAC Non-Woven Fabrics Industry Volume K Tons Forecast, by End-User Industry 2020 & 2033
- Table 27: Global APAC Non-Woven Fabrics Industry Revenue Million Forecast, by Geography 2020 & 2033
- Table 28: Global APAC Non-Woven Fabrics Industry Volume K Tons Forecast, by Geography 2020 & 2033
- Table 29: Global APAC Non-Woven Fabrics Industry Revenue Million Forecast, by Country 2020 & 2033
- Table 30: Global APAC Non-Woven Fabrics Industry Volume K Tons Forecast, by Country 2020 & 2033
- Table 31: Global APAC Non-Woven Fabrics Industry Revenue Million Forecast, by Technology 2020 & 2033
- Table 32: Global APAC Non-Woven Fabrics Industry Volume K Tons Forecast, by Technology 2020 & 2033
- Table 33: Global APAC Non-Woven Fabrics Industry Revenue Million Forecast, by Material 2020 & 2033
- Table 34: Global APAC Non-Woven Fabrics Industry Volume K Tons Forecast, by Material 2020 & 2033
- Table 35: Global APAC Non-Woven Fabrics Industry Revenue Million Forecast, by End-User Industry 2020 & 2033
- Table 36: Global APAC Non-Woven Fabrics Industry Volume K Tons Forecast, by End-User Industry 2020 & 2033
- Table 37: Global APAC Non-Woven Fabrics Industry Revenue Million Forecast, by Geography 2020 & 2033
- Table 38: Global APAC Non-Woven Fabrics Industry Volume K Tons Forecast, by Geography 2020 & 2033
- Table 39: Global APAC Non-Woven Fabrics Industry Revenue Million Forecast, by Country 2020 & 2033
- Table 40: Global APAC Non-Woven Fabrics Industry Volume K Tons Forecast, by Country 2020 & 2033
- Table 41: Global APAC Non-Woven Fabrics Industry Revenue Million Forecast, by Technology 2020 & 2033
- Table 42: Global APAC Non-Woven Fabrics Industry Volume K Tons Forecast, by Technology 2020 & 2033
- Table 43: Global APAC Non-Woven Fabrics Industry Revenue Million Forecast, by Material 2020 & 2033
- Table 44: Global APAC Non-Woven Fabrics Industry Volume K Tons Forecast, by Material 2020 & 2033
- Table 45: Global APAC Non-Woven Fabrics Industry Revenue Million Forecast, by End-User Industry 2020 & 2033
- Table 46: Global APAC Non-Woven Fabrics Industry Volume K Tons Forecast, by End-User Industry 2020 & 2033
- Table 47: Global APAC Non-Woven Fabrics Industry Revenue Million Forecast, by Geography 2020 & 2033
- Table 48: Global APAC Non-Woven Fabrics Industry Volume K Tons Forecast, by Geography 2020 & 2033
- Table 49: Global APAC Non-Woven Fabrics Industry Revenue Million Forecast, by Country 2020 & 2033
- Table 50: Global APAC Non-Woven Fabrics Industry Volume K Tons Forecast, by Country 2020 & 2033
- Table 51: Global APAC Non-Woven Fabrics Industry Revenue Million Forecast, by Technology 2020 & 2033
- Table 52: Global APAC Non-Woven Fabrics Industry Volume K Tons Forecast, by Technology 2020 & 2033
- Table 53: Global APAC Non-Woven Fabrics Industry Revenue Million Forecast, by Material 2020 & 2033
- Table 54: Global APAC Non-Woven Fabrics Industry Volume K Tons Forecast, by Material 2020 & 2033
- Table 55: Global APAC Non-Woven Fabrics Industry Revenue Million Forecast, by End-User Industry 2020 & 2033
- Table 56: Global APAC Non-Woven Fabrics Industry Volume K Tons Forecast, by End-User Industry 2020 & 2033
- Table 57: Global APAC Non-Woven Fabrics Industry Revenue Million Forecast, by Geography 2020 & 2033
- Table 58: Global APAC Non-Woven Fabrics Industry Volume K Tons Forecast, by Geography 2020 & 2033
- Table 59: Global APAC Non-Woven Fabrics Industry Revenue Million Forecast, by Country 2020 & 2033
- Table 60: Global APAC Non-Woven Fabrics Industry Volume K Tons Forecast, by Country 2020 & 2033
- Table 61: Global APAC Non-Woven Fabrics Industry Revenue Million Forecast, by Technology 2020 & 2033
- Table 62: Global APAC Non-Woven Fabrics Industry Volume K Tons Forecast, by Technology 2020 & 2033
- Table 63: Global APAC Non-Woven Fabrics Industry Revenue Million Forecast, by Material 2020 & 2033
- Table 64: Global APAC Non-Woven Fabrics Industry Volume K Tons Forecast, by Material 2020 & 2033
- Table 65: Global APAC Non-Woven Fabrics Industry Revenue Million Forecast, by End-User Industry 2020 & 2033
- Table 66: Global APAC Non-Woven Fabrics Industry Volume K Tons Forecast, by End-User Industry 2020 & 2033
- Table 67: Global APAC Non-Woven Fabrics Industry Revenue Million Forecast, by Geography 2020 & 2033
- Table 68: Global APAC Non-Woven Fabrics Industry Volume K Tons Forecast, by Geography 2020 & 2033
- Table 69: Global APAC Non-Woven Fabrics Industry Revenue Million Forecast, by Country 2020 & 2033
- Table 70: Global APAC Non-Woven Fabrics Industry Volume K Tons Forecast, by Country 2020 & 2033
- Table 71: Global APAC Non-Woven Fabrics Industry Revenue Million Forecast, by Technology 2020 & 2033
- Table 72: Global APAC Non-Woven Fabrics Industry Volume K Tons Forecast, by Technology 2020 & 2033
- Table 73: Global APAC Non-Woven Fabrics Industry Revenue Million Forecast, by Material 2020 & 2033
- Table 74: Global APAC Non-Woven Fabrics Industry Volume K Tons Forecast, by Material 2020 & 2033
- Table 75: Global APAC Non-Woven Fabrics Industry Revenue Million Forecast, by End-User Industry 2020 & 2033
- Table 76: Global APAC Non-Woven Fabrics Industry Volume K Tons Forecast, by End-User Industry 2020 & 2033
- Table 77: Global APAC Non-Woven Fabrics Industry Revenue Million Forecast, by Geography 2020 & 2033
- Table 78: Global APAC Non-Woven Fabrics Industry Volume K Tons Forecast, by Geography 2020 & 2033
- Table 79: Global APAC Non-Woven Fabrics Industry Revenue Million Forecast, by Country 2020 & 2033
- Table 80: Global APAC Non-Woven Fabrics Industry Volume K Tons Forecast, by Country 2020 & 2033
- Table 81: Global APAC Non-Woven Fabrics Industry Revenue Million Forecast, by Technology 2020 & 2033
- Table 82: Global APAC Non-Woven Fabrics Industry Volume K Tons Forecast, by Technology 2020 & 2033
- Table 83: Global APAC Non-Woven Fabrics Industry Revenue Million Forecast, by Material 2020 & 2033
- Table 84: Global APAC Non-Woven Fabrics Industry Volume K Tons Forecast, by Material 2020 & 2033
- Table 85: Global APAC Non-Woven Fabrics Industry Revenue Million Forecast, by End-User Industry 2020 & 2033
- Table 86: Global APAC Non-Woven Fabrics Industry Volume K Tons Forecast, by End-User Industry 2020 & 2033
- Table 87: Global APAC Non-Woven Fabrics Industry Revenue Million Forecast, by Geography 2020 & 2033
- Table 88: Global APAC Non-Woven Fabrics Industry Volume K Tons Forecast, by Geography 2020 & 2033
- Table 89: Global APAC Non-Woven Fabrics Industry Revenue Million Forecast, by Country 2020 & 2033
- Table 90: Global APAC Non-Woven Fabrics Industry Volume K Tons Forecast, by Country 2020 & 2033
- Table 91: Global APAC Non-Woven Fabrics Industry Revenue Million Forecast, by Technology 2020 & 2033
- Table 92: Global APAC Non-Woven Fabrics Industry Volume K Tons Forecast, by Technology 2020 & 2033
- Table 93: Global APAC Non-Woven Fabrics Industry Revenue Million Forecast, by Material 2020 & 2033
- Table 94: Global APAC Non-Woven Fabrics Industry Volume K Tons Forecast, by Material 2020 & 2033
- Table 95: Global APAC Non-Woven Fabrics Industry Revenue Million Forecast, by End-User Industry 2020 & 2033
- Table 96: Global APAC Non-Woven Fabrics Industry Volume K Tons Forecast, by End-User Industry 2020 & 2033
- Table 97: Global APAC Non-Woven Fabrics Industry Revenue Million Forecast, by Geography 2020 & 2033
- Table 98: Global APAC Non-Woven Fabrics Industry Volume K Tons Forecast, by Geography 2020 & 2033
- Table 99: Global APAC Non-Woven Fabrics Industry Revenue Million Forecast, by Country 2020 & 2033
- Table 100: Global APAC Non-Woven Fabrics Industry Volume K Tons Forecast, by Country 2020 & 2033
Frequently Asked Questions
1. What is the projected Compound Annual Growth Rate (CAGR) of the APAC Non-Woven Fabrics Industry?
The projected CAGR is approximately > 8.00%.
2. Which companies are prominent players in the APAC Non-Woven Fabrics Industry?
Key companies in the market include Ahlstrom, Glatfelter Corporation, Global Non Wovens Limited, Ginni Filaments, Freudenberg Performance Materials, Cygnus Group, Eximius Innovative Pvt Ltd, Fitesa S A, DuPont, Autotech Nonwovens Pvt Ltd, TORAY INDUSTRIES INC *List Not Exhaustive, Johns Manville, Berry Global Inc, Reliance Non-woven Industry LLC.
3. What are the main segments of the APAC Non-Woven Fabrics Industry?
The market segments include Technology, Material, End-User Industry, Geography.
4. Can you provide details about the market size?
The market size is estimated to be USD 36.76 Million as of 2022.
5. What are some drivers contributing to market growth?
Increasing Application Base in the Healthcare Industry; Growth in The Automotive Industry; Increasing Demand for Non-Woven Fabrics in The Textile Industry.
6. What are the notable trends driving market growth?
Healthcare End-User Industry to Dominate The Market.
7. Are there any restraints impacting market growth?
Lack of Awareness Among Consumers; Volatility in Raw Material Prices.
8. Can you provide examples of recent developments in the market?
November 2022: Fitesa announced the expansion of its production capacity for nonwoven fabrics for medical applications. The company is expected to invest in new machinery to meet the growing demand for these products.
9. What pricing options are available for accessing the report?
Pricing options include single-user, multi-user, and enterprise licenses priced at USD 4750, USD 5250, and USD 8750 respectively.
10. Is the market size provided in terms of value or volume?
The market size is provided in terms of value, measured in Million and volume, measured in K Tons.
11. Are there any specific market keywords associated with the report?
Yes, the market keyword associated with the report is "APAC Non-Woven Fabrics Industry," which aids in identifying and referencing the specific market segment covered.
12. How do I determine which pricing option suits my needs best?
The pricing options vary based on user requirements and access needs. Individual users may opt for single-user licenses, while businesses requiring broader access may choose multi-user or enterprise licenses for cost-effective access to the report.
13. Are there any additional resources or data provided in the APAC Non-Woven Fabrics Industry report?
While the report offers comprehensive insights, it's advisable to review the specific contents or supplementary materials provided to ascertain if additional resources or data are available.
14. How can I stay updated on further developments or reports in the APAC Non-Woven Fabrics Industry?
To stay informed about further developments, trends, and reports in the APAC Non-Woven Fabrics Industry, consider subscribing to industry newsletters, following relevant companies and organizations, or regularly checking reputable industry news sources and publications.
Methodology
Step 1 - Identification of Relevant Samples Size from Population Database


Step 2 - Approaches for Defining Global Market Size (Value, Volume* & Price*)

Note*: In applicable scenarios
Step 3 - Data Sources
Primary Research
- Web Analytics
- Survey Reports
- Research Institute
- Latest Research Reports
- Opinion Leaders
Secondary Research
- Annual Reports
- White Paper
- Latest Press Release
- Industry Association
- Paid Database
- Investor Presentations

Step 4 - Data Triangulation
Involves using different sources of information in order to increase the validity of a study
These sources are likely to be stakeholders in a program - participants, other researchers, program staff, other community members, and so on.
Then we put all data in single framework & apply various statistical tools to find out the dynamic on the market.
During the analysis stage, feedback from the stakeholder groups would be compared to determine areas of agreement as well as areas of divergence