

Key Insights
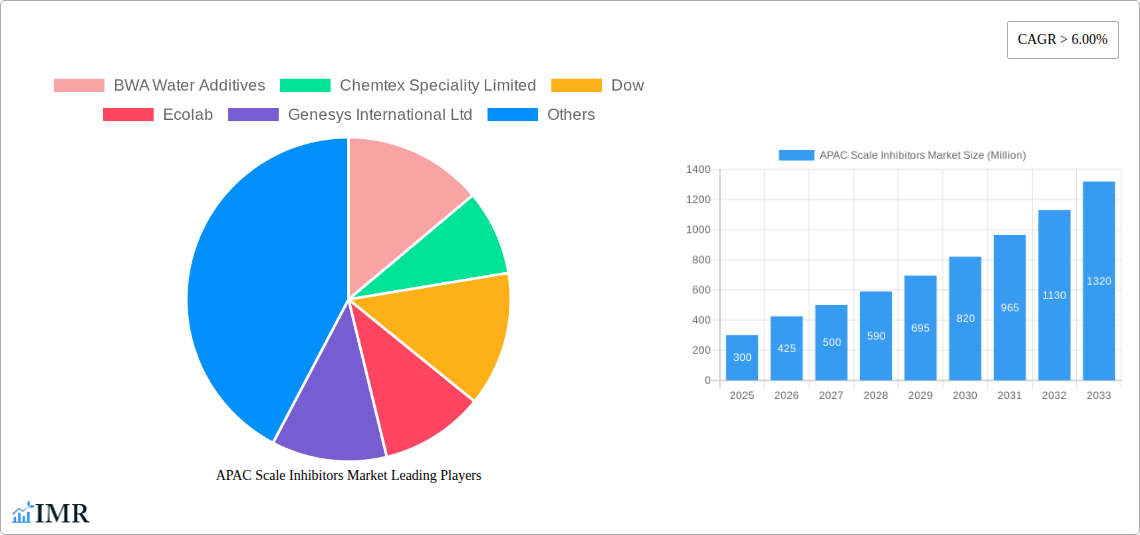
The Asia Pacific (APAC) scale inhibitors market is poised for substantial expansion, driven by escalating industrialization, rigorous environmental mandates, and heightened water demand across critical sectors including power generation, oil & gas, and manufacturing. Projections indicate a Compound Annual Growth Rate (CAGR) of 5.1%, building upon a 2025 market size of $3.98 billion. This growth trajectory is further propelled by ongoing technological innovations yielding more efficient and eco-friendly scale inhibitor solutions, alongside the increasing adoption of advanced water treatment technologies and a growing awareness of water scarcity imperatives.
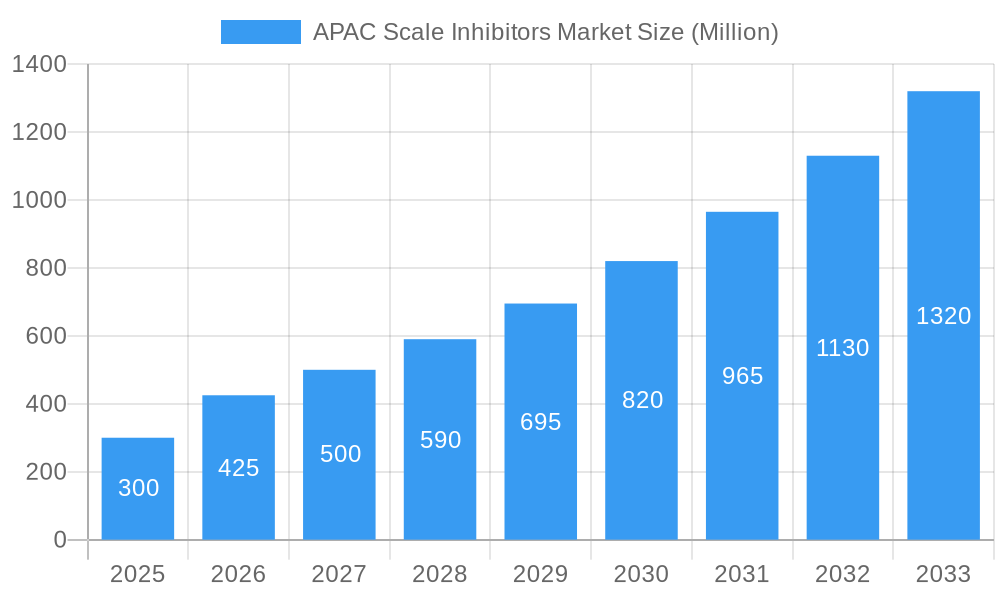
APAC Scale Inhibitors Market Market Size (In Billion)
While the market faces potential headwinds from volatile raw material costs and evolving regulatory landscapes, the overall outlook remains exceptionally positive. Key market segments encompass diverse inhibitor types such as phosphonates and polyacrylates, applications including cooling and boiler water systems, and significant regional hubs within APAC, notably China, India, and Southeast Asia. Leading market participants like Dow, Ecolab, and Kemira are expected to maintain dominant positions, leveraging their established brand equity, expansive distribution networks, and technological prowess.
APAC Scale Inhibitors Market Company Market Share
The forecast period, extending from 2025 to 2033, anticipates sustained market growth, underpinned by strategic investments in infrastructure development and burgeoning industrial activities across the APAC region. Regional performance will be intrinsically linked to economic growth dynamics and governmental policies governing water resource management.
Building on a projected 2025 market valuation of $3.98 billion and a CAGR of 5.1%, the APAC scale inhibitors market is set for continued robust expansion. The competitive arena features a blend of global and regional enterprises, fostering a dynamic environment ripe with opportunities for both established players and emerging innovators. Companies are actively pursuing product development to offer specialized solutions that cater to the distinct industrial requirements and regional contexts within APAC. Future market buoyancy will be contingent upon sustained industrial expansion, the wider adoption of sophisticated water treatment methodologies, and an unwavering commitment to environmental sustainability throughout the region.
APAC Scale Inhibitors Market: A Comprehensive Report (2019-2033)
This comprehensive report offers an in-depth analysis of the APAC Scale Inhibitors market, providing crucial insights for businesses operating within the water treatment and industrial chemicals sectors. The study covers the period 2019-2033, with a focus on the forecast period 2025-2033, using 2025 as the base year and estimated year. The report segments the market and provides a detailed analysis of key players, trends, and future opportunities. The total market size in 2025 is estimated at XXX Million.
APAC Scale Inhibitors Market Market Dynamics & Structure
The APAC Scale Inhibitors market is characterized by a moderately concentrated structure, with key players holding significant market share. Market concentration is estimated at xx% in 2025. Technological innovation, driven by the need for environmentally friendly and cost-effective solutions, is a major driver. Stringent environmental regulations across the region are shaping product development and adoption. Competitive pressures from substitute products, such as alternative water treatment methods, exist, although their market share remains relatively small at xx%. End-user demographics are diverse, encompassing power generation, oil & gas, and industrial manufacturing sectors. The past five years have witnessed a moderate level of M&A activity, with approximately xx deals recorded, primarily focused on expanding geographic reach and product portfolios.
- Market Concentration: xx% in 2025 (estimated)
- Key Drivers: Technological innovation, stringent environmental regulations, increasing industrialization.
- Challenges: Competition from substitutes, regulatory hurdles, and price sensitivity.
- M&A Activity: Approximately xx deals (2019-2024)
APAC Scale Inhibitors Market Growth Trends & Insights
The APAC Scale Inhibitors market has experienced substantial growth over the historical period (2019-2024), with a CAGR of xx%. This growth is fueled by increasing industrial activity, rising investments in infrastructure development (particularly in power generation and water treatment facilities), and growing awareness of the need for efficient water management. Market penetration is currently estimated at xx% in 2025 and is expected to increase significantly over the forecast period. Technological disruptions, such as the development of advanced polymer-based inhibitors and digital monitoring solutions, are further driving market expansion. Shifting consumer preferences towards sustainable and environmentally responsible practices are influencing the demand for eco-friendly scale inhibitors. The market size is projected to reach XXX Million by 2033, indicating a strong growth trajectory.
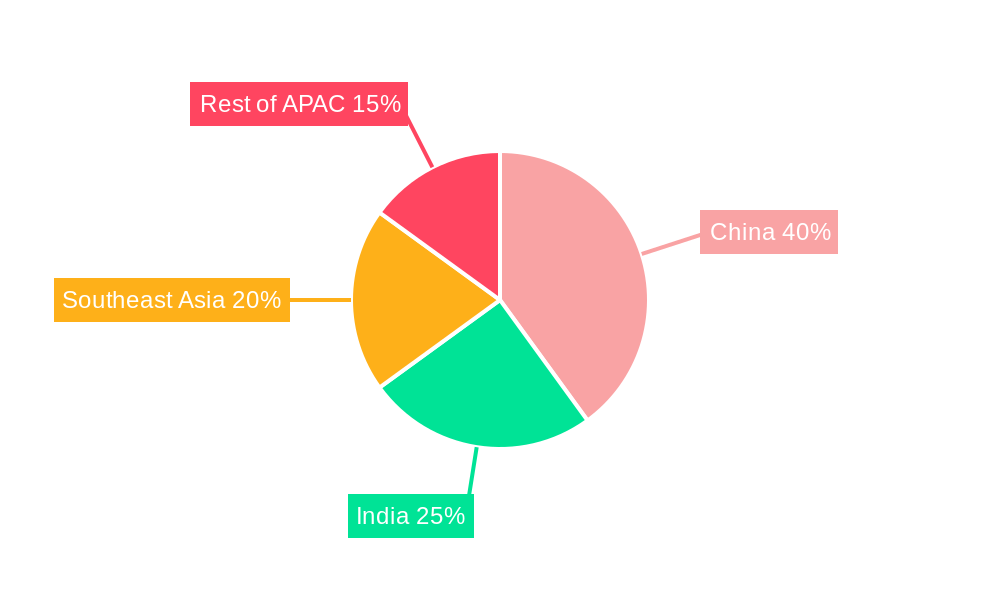
Dominant Regions, Countries, or Segments in APAC Scale Inhibitors Market
China and India are the dominant markets within the APAC region, accounting for xx% and xx% of the total market share in 2025, respectively. Their dominance is driven by rapid industrialization, robust economic growth, and substantial investments in infrastructure projects. The power generation and oil & gas segments are significant contributors to market growth in these countries. Other key countries with significant growth potential include South Korea, Japan, and Singapore.
- China: High industrial activity, significant investments in infrastructure.
- India: Rapid economic growth, rising demand from diverse sectors.
- Other Key Countries: South Korea, Japan, and Singapore (significant growth potential)
- Market Share (2025): China (xx%), India (xx%), Others (xx%).
APAC Scale Inhibitors Market Product Landscape
The APAC Scale Inhibitors market offers a diverse range of products, including organic and inorganic inhibitors, each with unique applications and performance characteristics. Recent innovations focus on developing environmentally friendly, high-performance inhibitors with enhanced scalability and cost-effectiveness. Key advancements include the use of advanced polymers and the integration of digital technologies for optimized dosage and monitoring. These advancements improve efficiency, reduce environmental impact, and offer unique selling propositions in terms of performance and sustainability.
Key Drivers, Barriers & Challenges in APAC Scale Inhibitors Market
Key Drivers: Increasing industrialization, stringent environmental regulations, and the growing need for efficient water management are the primary drivers. Government initiatives promoting sustainable water practices also contribute.
Challenges: Fluctuations in raw material prices, supply chain disruptions, and intense competition among established players pose significant challenges. Regulatory hurdles and variations in environmental standards across different APAC countries also impact market growth. The estimated impact of supply chain issues on market growth in 2025 is xx%.
Emerging Opportunities in APAC Scale Inhibitors Market
Emerging opportunities include the expansion into untapped markets (e.g., smaller industrial sectors), the development of specialized inhibitors for niche applications (e.g., desalination plants), and the increasing adoption of sustainable and eco-friendly inhibitors. Growing demand from renewable energy sources and increasing awareness of water scarcity offer additional growth avenues.
Growth Accelerators in the APAC Scale Inhibitors Market Industry
Technological breakthroughs in inhibitor formulation, strategic partnerships between chemical manufacturers and water treatment companies, and the expansion of market reach into emerging economies are accelerating market growth. Government incentives for water conservation and environmental protection further stimulate the adoption of advanced scale inhibitors.
Key Players Shaping the APAC Scale Inhibitors Market Market
- BWA Water Additives
- Chemtex Speciality Limited
- Dow
- Ecolab
- Genesys International Ltd
- Ion Exchange India Limited
- Italmatch Chemicals S P A
- Kemira
- King Lee Technologies
- Kurita Water Industries Ltd
- Solenis
- Suez
- Thermax Ltd
- List Not Exhaustive
Notable Milestones in APAC Scale Inhibitors Market Sector
- 2022 Q4: Launch of a new bio-based scale inhibitor by Company X.
- 2023 Q1: Merger between Company Y and Company Z, expanding market reach.
- 2024 Q2: Introduction of a novel digital monitoring system by Company A.
- Further milestones will be detailed in the full report.
In-Depth APAC Scale Inhibitors Market Market Outlook
The APAC Scale Inhibitors market is poised for significant growth over the forecast period, driven by sustained industrial expansion, increasing environmental awareness, and technological advancements. Strategic partnerships, targeted investments in R&D, and expansion into untapped market segments will further enhance future growth potential. The market presents significant opportunities for both established players and new entrants, particularly those focusing on sustainable and innovative solutions.
APAC Scale Inhibitors Market Segmentation
-
1. Type
- 1.1. Scale & Corrosion Inhibitors
- 1.2. Coagulants & Flocculants
- 1.3. pH Boosters
- 1.4. Oxygen Scavengers
- 1.5. Others
-
2. Chemistry
- 2.1. Basic Chemicals
- 2.2. Blended/Specialty Chemicals
-
3. End-user Industry
- 3.1. Power Generation
- 3.2. Steel & Metal Industry
- 3.3. Oil Refinery
- 3.4. Chemical & Petrochemical
- 3.5. Textile & Dye Industry
- 3.6. Sugar Mill
- 3.7. Paper Mill
- 3.8. Food & Beverage
- 3.9. Institutional
- 3.10. Pharmaceutical
- 3.11. Others
-
4. Geography
- 4.1. China
- 4.2. India
- 4.3. Japan
- 4.4. South Korea
- 4.5. ASEAN Countries
- 4.6. Rest of Asia-Pacific
APAC Scale Inhibitors Market Segmentation By Geography
- 1. China
- 2. India
- 3. Japan
- 4. South Korea
- 5. ASEAN Countries
- 6. Rest of Asia Pacific
APAC Scale Inhibitors Market Regional Market Share
Geographic Coverage of APAC Scale Inhibitors Market
APAC Scale Inhibitors Market REPORT HIGHLIGHTS
| Aspects | Details |
|---|---|
| Study Period | 2020-2034 |
| Base Year | 2025 |
| Estimated Year | 2026 |
| Forecast Period | 2026-2034 |
| Historical Period | 2020-2025 |
| Growth Rate | CAGR of 5.1% from 2020-2034 |
| Segmentation |
|
Table of Contents
- 1. Introduction
- 1.1. Research Scope
- 1.2. Market Segmentation
- 1.3. Research Objective
- 1.4. Definitions and Assumptions
- 2. Executive Summary
- 2.1. Market Snapshot
- 3. Market Dynamics
- 3.1. Market Drivers
- 3.2. Market Restrains
- 3.3. Market Trends
- 3.4. Market Opportunities
- 4. Market Factor Analysis
- 4.1. Porters Five Forces
- 4.1.1. Bargaining Power of Suppliers
- 4.1.2. Bargaining Power of Buyers
- 4.1.3. Threat of New Entrants
- 4.1.4. Threat of Substitutes
- 4.1.5. Competitive Rivalry
- 4.2. PESTEL analysis
- 4.3. BCG Analysis
- 4.3.1. Stars (High Growth, High Market Share)
- 4.3.2. Cash Cows (Low Growth, High Market Share)
- 4.3.3. Question Mark (High Growth, Low Market Share)
- 4.3.4. Dogs (Low Growth, Low Market Share)
- 4.4. Ansoff Matrix Analysis
- 4.5. Supply Chain Analysis
- 4.6. Regulatory Landscape
- 4.7. Current Market Potential and Opportunity Assessment (TAM–SAM–SOM Framework)
- 4.8. IMR Analyst Note
- 4.1. Porters Five Forces
- 5. Market Analysis, Insights and Forecast 2021-2033
- 5.1. Market Analysis, Insights and Forecast - by Type
- 5.1.1. Scale & Corrosion Inhibitors
- 5.1.2. Coagulants & Flocculants
- 5.1.3. pH Boosters
- 5.1.4. Oxygen Scavengers
- 5.1.5. Others
- 5.2. Market Analysis, Insights and Forecast - by Chemistry
- 5.2.1. Basic Chemicals
- 5.2.2. Blended/Specialty Chemicals
- 5.3. Market Analysis, Insights and Forecast - by End-user Industry
- 5.3.1. Power Generation
- 5.3.2. Steel & Metal Industry
- 5.3.3. Oil Refinery
- 5.3.4. Chemical & Petrochemical
- 5.3.5. Textile & Dye Industry
- 5.3.6. Sugar Mill
- 5.3.7. Paper Mill
- 5.3.8. Food & Beverage
- 5.3.9. Institutional
- 5.3.10. Pharmaceutical
- 5.3.11. Others
- 5.4. Market Analysis, Insights and Forecast - by Geography
- 5.4.1. China
- 5.4.2. India
- 5.4.3. Japan
- 5.4.4. South Korea
- 5.4.5. ASEAN Countries
- 5.4.6. Rest of Asia-Pacific
- 5.5. Market Analysis, Insights and Forecast - by Region
- 5.5.1. China
- 5.5.2. India
- 5.5.3. Japan
- 5.5.4. South Korea
- 5.5.5. ASEAN Countries
- 5.5.6. Rest of Asia Pacific
- 5.1. Market Analysis, Insights and Forecast - by Type
- 6. Global APAC Scale Inhibitors Market Analysis, Insights and Forecast, 2021-2033
- 6.1. Market Analysis, Insights and Forecast - by Type
- 6.1.1. Scale & Corrosion Inhibitors
- 6.1.2. Coagulants & Flocculants
- 6.1.3. pH Boosters
- 6.1.4. Oxygen Scavengers
- 6.1.5. Others
- 6.2. Market Analysis, Insights and Forecast - by Chemistry
- 6.2.1. Basic Chemicals
- 6.2.2. Blended/Specialty Chemicals
- 6.3. Market Analysis, Insights and Forecast - by End-user Industry
- 6.3.1. Power Generation
- 6.3.2. Steel & Metal Industry
- 6.3.3. Oil Refinery
- 6.3.4. Chemical & Petrochemical
- 6.3.5. Textile & Dye Industry
- 6.3.6. Sugar Mill
- 6.3.7. Paper Mill
- 6.3.8. Food & Beverage
- 6.3.9. Institutional
- 6.3.10. Pharmaceutical
- 6.3.11. Others
- 6.4. Market Analysis, Insights and Forecast - by Geography
- 6.4.1. China
- 6.4.2. India
- 6.4.3. Japan
- 6.4.4. South Korea
- 6.4.5. ASEAN Countries
- 6.4.6. Rest of Asia-Pacific
- 6.1. Market Analysis, Insights and Forecast - by Type
- 7. China APAC Scale Inhibitors Market Analysis, Insights and Forecast, 2020-2032
- 7.1. Market Analysis, Insights and Forecast - by Type
- 7.1.1. Scale & Corrosion Inhibitors
- 7.1.2. Coagulants & Flocculants
- 7.1.3. pH Boosters
- 7.1.4. Oxygen Scavengers
- 7.1.5. Others
- 7.2. Market Analysis, Insights and Forecast - by Chemistry
- 7.2.1. Basic Chemicals
- 7.2.2. Blended/Specialty Chemicals
- 7.3. Market Analysis, Insights and Forecast - by End-user Industry
- 7.3.1. Power Generation
- 7.3.2. Steel & Metal Industry
- 7.3.3. Oil Refinery
- 7.3.4. Chemical & Petrochemical
- 7.3.5. Textile & Dye Industry
- 7.3.6. Sugar Mill
- 7.3.7. Paper Mill
- 7.3.8. Food & Beverage
- 7.3.9. Institutional
- 7.3.10. Pharmaceutical
- 7.3.11. Others
- 7.4. Market Analysis, Insights and Forecast - by Geography
- 7.4.1. China
- 7.4.2. India
- 7.4.3. Japan
- 7.4.4. South Korea
- 7.4.5. ASEAN Countries
- 7.4.6. Rest of Asia-Pacific
- 7.1. Market Analysis, Insights and Forecast - by Type
- 8. India APAC Scale Inhibitors Market Analysis, Insights and Forecast, 2020-2032
- 8.1. Market Analysis, Insights and Forecast - by Type
- 8.1.1. Scale & Corrosion Inhibitors
- 8.1.2. Coagulants & Flocculants
- 8.1.3. pH Boosters
- 8.1.4. Oxygen Scavengers
- 8.1.5. Others
- 8.2. Market Analysis, Insights and Forecast - by Chemistry
- 8.2.1. Basic Chemicals
- 8.2.2. Blended/Specialty Chemicals
- 8.3. Market Analysis, Insights and Forecast - by End-user Industry
- 8.3.1. Power Generation
- 8.3.2. Steel & Metal Industry
- 8.3.3. Oil Refinery
- 8.3.4. Chemical & Petrochemical
- 8.3.5. Textile & Dye Industry
- 8.3.6. Sugar Mill
- 8.3.7. Paper Mill
- 8.3.8. Food & Beverage
- 8.3.9. Institutional
- 8.3.10. Pharmaceutical
- 8.3.11. Others
- 8.4. Market Analysis, Insights and Forecast - by Geography
- 8.4.1. China
- 8.4.2. India
- 8.4.3. Japan
- 8.4.4. South Korea
- 8.4.5. ASEAN Countries
- 8.4.6. Rest of Asia-Pacific
- 8.1. Market Analysis, Insights and Forecast - by Type
- 9. Japan APAC Scale Inhibitors Market Analysis, Insights and Forecast, 2020-2032
- 9.1. Market Analysis, Insights and Forecast - by Type
- 9.1.1. Scale & Corrosion Inhibitors
- 9.1.2. Coagulants & Flocculants
- 9.1.3. pH Boosters
- 9.1.4. Oxygen Scavengers
- 9.1.5. Others
- 9.2. Market Analysis, Insights and Forecast - by Chemistry
- 9.2.1. Basic Chemicals
- 9.2.2. Blended/Specialty Chemicals
- 9.3. Market Analysis, Insights and Forecast - by End-user Industry
- 9.3.1. Power Generation
- 9.3.2. Steel & Metal Industry
- 9.3.3. Oil Refinery
- 9.3.4. Chemical & Petrochemical
- 9.3.5. Textile & Dye Industry
- 9.3.6. Sugar Mill
- 9.3.7. Paper Mill
- 9.3.8. Food & Beverage
- 9.3.9. Institutional
- 9.3.10. Pharmaceutical
- 9.3.11. Others
- 9.4. Market Analysis, Insights and Forecast - by Geography
- 9.4.1. China
- 9.4.2. India
- 9.4.3. Japan
- 9.4.4. South Korea
- 9.4.5. ASEAN Countries
- 9.4.6. Rest of Asia-Pacific
- 9.1. Market Analysis, Insights and Forecast - by Type
- 10. South Korea APAC Scale Inhibitors Market Analysis, Insights and Forecast, 2020-2032
- 10.1. Market Analysis, Insights and Forecast - by Type
- 10.1.1. Scale & Corrosion Inhibitors
- 10.1.2. Coagulants & Flocculants
- 10.1.3. pH Boosters
- 10.1.4. Oxygen Scavengers
- 10.1.5. Others
- 10.2. Market Analysis, Insights and Forecast - by Chemistry
- 10.2.1. Basic Chemicals
- 10.2.2. Blended/Specialty Chemicals
- 10.3. Market Analysis, Insights and Forecast - by End-user Industry
- 10.3.1. Power Generation
- 10.3.2. Steel & Metal Industry
- 10.3.3. Oil Refinery
- 10.3.4. Chemical & Petrochemical
- 10.3.5. Textile & Dye Industry
- 10.3.6. Sugar Mill
- 10.3.7. Paper Mill
- 10.3.8. Food & Beverage
- 10.3.9. Institutional
- 10.3.10. Pharmaceutical
- 10.3.11. Others
- 10.4. Market Analysis, Insights and Forecast - by Geography
- 10.4.1. China
- 10.4.2. India
- 10.4.3. Japan
- 10.4.4. South Korea
- 10.4.5. ASEAN Countries
- 10.4.6. Rest of Asia-Pacific
- 10.1. Market Analysis, Insights and Forecast - by Type
- 11. ASEAN Countries APAC Scale Inhibitors Market Analysis, Insights and Forecast, 2020-2032
- 11.1. Market Analysis, Insights and Forecast - by Type
- 11.1.1. Scale & Corrosion Inhibitors
- 11.1.2. Coagulants & Flocculants
- 11.1.3. pH Boosters
- 11.1.4. Oxygen Scavengers
- 11.1.5. Others
- 11.2. Market Analysis, Insights and Forecast - by Chemistry
- 11.2.1. Basic Chemicals
- 11.2.2. Blended/Specialty Chemicals
- 11.3. Market Analysis, Insights and Forecast - by End-user Industry
- 11.3.1. Power Generation
- 11.3.2. Steel & Metal Industry
- 11.3.3. Oil Refinery
- 11.3.4. Chemical & Petrochemical
- 11.3.5. Textile & Dye Industry
- 11.3.6. Sugar Mill
- 11.3.7. Paper Mill
- 11.3.8. Food & Beverage
- 11.3.9. Institutional
- 11.3.10. Pharmaceutical
- 11.3.11. Others
- 11.4. Market Analysis, Insights and Forecast - by Geography
- 11.4.1. China
- 11.4.2. India
- 11.4.3. Japan
- 11.4.4. South Korea
- 11.4.5. ASEAN Countries
- 11.4.6. Rest of Asia-Pacific
- 11.1. Market Analysis, Insights and Forecast - by Type
- 12. Rest of Asia Pacific APAC Scale Inhibitors Market Analysis, Insights and Forecast, 2020-2032
- 12.1. Market Analysis, Insights and Forecast - by Type
- 12.1.1. Scale & Corrosion Inhibitors
- 12.1.2. Coagulants & Flocculants
- 12.1.3. pH Boosters
- 12.1.4. Oxygen Scavengers
- 12.1.5. Others
- 12.2. Market Analysis, Insights and Forecast - by Chemistry
- 12.2.1. Basic Chemicals
- 12.2.2. Blended/Specialty Chemicals
- 12.3. Market Analysis, Insights and Forecast - by End-user Industry
- 12.3.1. Power Generation
- 12.3.2. Steel & Metal Industry
- 12.3.3. Oil Refinery
- 12.3.4. Chemical & Petrochemical
- 12.3.5. Textile & Dye Industry
- 12.3.6. Sugar Mill
- 12.3.7. Paper Mill
- 12.3.8. Food & Beverage
- 12.3.9. Institutional
- 12.3.10. Pharmaceutical
- 12.3.11. Others
- 12.4. Market Analysis, Insights and Forecast - by Geography
- 12.4.1. China
- 12.4.2. India
- 12.4.3. Japan
- 12.4.4. South Korea
- 12.4.5. ASEAN Countries
- 12.4.6. Rest of Asia-Pacific
- 12.1. Market Analysis, Insights and Forecast - by Type
- 13. Competitive Analysis
- 13.1. Company Profiles
- 13.1.1 BWA Water Additives
- 13.1.1.1. Company Overview
- 13.1.1.2. Products
- 13.1.1.3. Company Financials
- 13.1.1.4. SWOT Analysis
- 13.1.2 Chemtex Speciality Limited
- 13.1.2.1. Company Overview
- 13.1.2.2. Products
- 13.1.2.3. Company Financials
- 13.1.2.4. SWOT Analysis
- 13.1.3 Dow
- 13.1.3.1. Company Overview
- 13.1.3.2. Products
- 13.1.3.3. Company Financials
- 13.1.3.4. SWOT Analysis
- 13.1.4 Ecolab
- 13.1.4.1. Company Overview
- 13.1.4.2. Products
- 13.1.4.3. Company Financials
- 13.1.4.4. SWOT Analysis
- 13.1.5 Genesys International Ltd
- 13.1.5.1. Company Overview
- 13.1.5.2. Products
- 13.1.5.3. Company Financials
- 13.1.5.4. SWOT Analysis
- 13.1.6 Ion Exchange India Limited
- 13.1.6.1. Company Overview
- 13.1.6.2. Products
- 13.1.6.3. Company Financials
- 13.1.6.4. SWOT Analysis
- 13.1.7 Italmatch Chemicals S P A
- 13.1.7.1. Company Overview
- 13.1.7.2. Products
- 13.1.7.3. Company Financials
- 13.1.7.4. SWOT Analysis
- 13.1.8 Kemira
- 13.1.8.1. Company Overview
- 13.1.8.2. Products
- 13.1.8.3. Company Financials
- 13.1.8.4. SWOT Analysis
- 13.1.9 King Lee Technologies
- 13.1.9.1. Company Overview
- 13.1.9.2. Products
- 13.1.9.3. Company Financials
- 13.1.9.4. SWOT Analysis
- 13.1.10 Kurita Water Industries Ltd
- 13.1.10.1. Company Overview
- 13.1.10.2. Products
- 13.1.10.3. Company Financials
- 13.1.10.4. SWOT Analysis
- 13.1.11 Solenis
- 13.1.11.1. Company Overview
- 13.1.11.2. Products
- 13.1.11.3. Company Financials
- 13.1.11.4. SWOT Analysis
- 13.1.12 Suez
- 13.1.12.1. Company Overview
- 13.1.12.2. Products
- 13.1.12.3. Company Financials
- 13.1.12.4. SWOT Analysis
- 13.1.13 Thermax Ltd*List Not Exhaustive
- 13.1.13.1. Company Overview
- 13.1.13.2. Products
- 13.1.13.3. Company Financials
- 13.1.13.4. SWOT Analysis
- 13.1.1 BWA Water Additives
- 13.2. Market Entropy
- 13.2.1 Company's Key Areas Served
- 13.2.2 Recent Developments
- 13.3. Company Market Share Analysis 2025
- 13.3.1 Top 5 Companies Market Share Analysis
- 13.3.2 Top 3 Companies Market Share Analysis
- 13.4. List of Potential Customers
- 14. Research Methodology
List of Figures
- Figure 1: Global APAC Scale Inhibitors Market Revenue Breakdown (billion, %) by Region 2025 & 2033
- Figure 2: China APAC Scale Inhibitors Market Revenue (billion), by Type 2025 & 2033
- Figure 3: China APAC Scale Inhibitors Market Revenue Share (%), by Type 2025 & 2033
- Figure 4: China APAC Scale Inhibitors Market Revenue (billion), by Chemistry 2025 & 2033
- Figure 5: China APAC Scale Inhibitors Market Revenue Share (%), by Chemistry 2025 & 2033
- Figure 6: China APAC Scale Inhibitors Market Revenue (billion), by End-user Industry 2025 & 2033
- Figure 7: China APAC Scale Inhibitors Market Revenue Share (%), by End-user Industry 2025 & 2033
- Figure 8: China APAC Scale Inhibitors Market Revenue (billion), by Geography 2025 & 2033
- Figure 9: China APAC Scale Inhibitors Market Revenue Share (%), by Geography 2025 & 2033
- Figure 10: China APAC Scale Inhibitors Market Revenue (billion), by Country 2025 & 2033
- Figure 11: China APAC Scale Inhibitors Market Revenue Share (%), by Country 2025 & 2033
- Figure 12: India APAC Scale Inhibitors Market Revenue (billion), by Type 2025 & 2033
- Figure 13: India APAC Scale Inhibitors Market Revenue Share (%), by Type 2025 & 2033
- Figure 14: India APAC Scale Inhibitors Market Revenue (billion), by Chemistry 2025 & 2033
- Figure 15: India APAC Scale Inhibitors Market Revenue Share (%), by Chemistry 2025 & 2033
- Figure 16: India APAC Scale Inhibitors Market Revenue (billion), by End-user Industry 2025 & 2033
- Figure 17: India APAC Scale Inhibitors Market Revenue Share (%), by End-user Industry 2025 & 2033
- Figure 18: India APAC Scale Inhibitors Market Revenue (billion), by Geography 2025 & 2033
- Figure 19: India APAC Scale Inhibitors Market Revenue Share (%), by Geography 2025 & 2033
- Figure 20: India APAC Scale Inhibitors Market Revenue (billion), by Country 2025 & 2033
- Figure 21: India APAC Scale Inhibitors Market Revenue Share (%), by Country 2025 & 2033
- Figure 22: Japan APAC Scale Inhibitors Market Revenue (billion), by Type 2025 & 2033
- Figure 23: Japan APAC Scale Inhibitors Market Revenue Share (%), by Type 2025 & 2033
- Figure 24: Japan APAC Scale Inhibitors Market Revenue (billion), by Chemistry 2025 & 2033
- Figure 25: Japan APAC Scale Inhibitors Market Revenue Share (%), by Chemistry 2025 & 2033
- Figure 26: Japan APAC Scale Inhibitors Market Revenue (billion), by End-user Industry 2025 & 2033
- Figure 27: Japan APAC Scale Inhibitors Market Revenue Share (%), by End-user Industry 2025 & 2033
- Figure 28: Japan APAC Scale Inhibitors Market Revenue (billion), by Geography 2025 & 2033
- Figure 29: Japan APAC Scale Inhibitors Market Revenue Share (%), by Geography 2025 & 2033
- Figure 30: Japan APAC Scale Inhibitors Market Revenue (billion), by Country 2025 & 2033
- Figure 31: Japan APAC Scale Inhibitors Market Revenue Share (%), by Country 2025 & 2033
- Figure 32: South Korea APAC Scale Inhibitors Market Revenue (billion), by Type 2025 & 2033
- Figure 33: South Korea APAC Scale Inhibitors Market Revenue Share (%), by Type 2025 & 2033
- Figure 34: South Korea APAC Scale Inhibitors Market Revenue (billion), by Chemistry 2025 & 2033
- Figure 35: South Korea APAC Scale Inhibitors Market Revenue Share (%), by Chemistry 2025 & 2033
- Figure 36: South Korea APAC Scale Inhibitors Market Revenue (billion), by End-user Industry 2025 & 2033
- Figure 37: South Korea APAC Scale Inhibitors Market Revenue Share (%), by End-user Industry 2025 & 2033
- Figure 38: South Korea APAC Scale Inhibitors Market Revenue (billion), by Geography 2025 & 2033
- Figure 39: South Korea APAC Scale Inhibitors Market Revenue Share (%), by Geography 2025 & 2033
- Figure 40: South Korea APAC Scale Inhibitors Market Revenue (billion), by Country 2025 & 2033
- Figure 41: South Korea APAC Scale Inhibitors Market Revenue Share (%), by Country 2025 & 2033
- Figure 42: ASEAN Countries APAC Scale Inhibitors Market Revenue (billion), by Type 2025 & 2033
- Figure 43: ASEAN Countries APAC Scale Inhibitors Market Revenue Share (%), by Type 2025 & 2033
- Figure 44: ASEAN Countries APAC Scale Inhibitors Market Revenue (billion), by Chemistry 2025 & 2033
- Figure 45: ASEAN Countries APAC Scale Inhibitors Market Revenue Share (%), by Chemistry 2025 & 2033
- Figure 46: ASEAN Countries APAC Scale Inhibitors Market Revenue (billion), by End-user Industry 2025 & 2033
- Figure 47: ASEAN Countries APAC Scale Inhibitors Market Revenue Share (%), by End-user Industry 2025 & 2033
- Figure 48: ASEAN Countries APAC Scale Inhibitors Market Revenue (billion), by Geography 2025 & 2033
- Figure 49: ASEAN Countries APAC Scale Inhibitors Market Revenue Share (%), by Geography 2025 & 2033
- Figure 50: ASEAN Countries APAC Scale Inhibitors Market Revenue (billion), by Country 2025 & 2033
- Figure 51: ASEAN Countries APAC Scale Inhibitors Market Revenue Share (%), by Country 2025 & 2033
- Figure 52: Rest of Asia Pacific APAC Scale Inhibitors Market Revenue (billion), by Type 2025 & 2033
- Figure 53: Rest of Asia Pacific APAC Scale Inhibitors Market Revenue Share (%), by Type 2025 & 2033
- Figure 54: Rest of Asia Pacific APAC Scale Inhibitors Market Revenue (billion), by Chemistry 2025 & 2033
- Figure 55: Rest of Asia Pacific APAC Scale Inhibitors Market Revenue Share (%), by Chemistry 2025 & 2033
- Figure 56: Rest of Asia Pacific APAC Scale Inhibitors Market Revenue (billion), by End-user Industry 2025 & 2033
- Figure 57: Rest of Asia Pacific APAC Scale Inhibitors Market Revenue Share (%), by End-user Industry 2025 & 2033
- Figure 58: Rest of Asia Pacific APAC Scale Inhibitors Market Revenue (billion), by Geography 2025 & 2033
- Figure 59: Rest of Asia Pacific APAC Scale Inhibitors Market Revenue Share (%), by Geography 2025 & 2033
- Figure 60: Rest of Asia Pacific APAC Scale Inhibitors Market Revenue (billion), by Country 2025 & 2033
- Figure 61: Rest of Asia Pacific APAC Scale Inhibitors Market Revenue Share (%), by Country 2025 & 2033
List of Tables
- Table 1: Global APAC Scale Inhibitors Market Revenue billion Forecast, by Type 2020 & 2033
- Table 2: Global APAC Scale Inhibitors Market Revenue billion Forecast, by Chemistry 2020 & 2033
- Table 3: Global APAC Scale Inhibitors Market Revenue billion Forecast, by End-user Industry 2020 & 2033
- Table 4: Global APAC Scale Inhibitors Market Revenue billion Forecast, by Geography 2020 & 2033
- Table 5: Global APAC Scale Inhibitors Market Revenue billion Forecast, by Region 2020 & 2033
- Table 6: Global APAC Scale Inhibitors Market Revenue billion Forecast, by Type 2020 & 2033
- Table 7: Global APAC Scale Inhibitors Market Revenue billion Forecast, by Chemistry 2020 & 2033
- Table 8: Global APAC Scale Inhibitors Market Revenue billion Forecast, by End-user Industry 2020 & 2033
- Table 9: Global APAC Scale Inhibitors Market Revenue billion Forecast, by Geography 2020 & 2033
- Table 10: Global APAC Scale Inhibitors Market Revenue billion Forecast, by Country 2020 & 2033
- Table 11: Global APAC Scale Inhibitors Market Revenue billion Forecast, by Type 2020 & 2033
- Table 12: Global APAC Scale Inhibitors Market Revenue billion Forecast, by Chemistry 2020 & 2033
- Table 13: Global APAC Scale Inhibitors Market Revenue billion Forecast, by End-user Industry 2020 & 2033
- Table 14: Global APAC Scale Inhibitors Market Revenue billion Forecast, by Geography 2020 & 2033
- Table 15: Global APAC Scale Inhibitors Market Revenue billion Forecast, by Country 2020 & 2033
- Table 16: Global APAC Scale Inhibitors Market Revenue billion Forecast, by Type 2020 & 2033
- Table 17: Global APAC Scale Inhibitors Market Revenue billion Forecast, by Chemistry 2020 & 2033
- Table 18: Global APAC Scale Inhibitors Market Revenue billion Forecast, by End-user Industry 2020 & 2033
- Table 19: Global APAC Scale Inhibitors Market Revenue billion Forecast, by Geography 2020 & 2033
- Table 20: Global APAC Scale Inhibitors Market Revenue billion Forecast, by Country 2020 & 2033
- Table 21: Global APAC Scale Inhibitors Market Revenue billion Forecast, by Type 2020 & 2033
- Table 22: Global APAC Scale Inhibitors Market Revenue billion Forecast, by Chemistry 2020 & 2033
- Table 23: Global APAC Scale Inhibitors Market Revenue billion Forecast, by End-user Industry 2020 & 2033
- Table 24: Global APAC Scale Inhibitors Market Revenue billion Forecast, by Geography 2020 & 2033
- Table 25: Global APAC Scale Inhibitors Market Revenue billion Forecast, by Country 2020 & 2033
- Table 26: Global APAC Scale Inhibitors Market Revenue billion Forecast, by Type 2020 & 2033
- Table 27: Global APAC Scale Inhibitors Market Revenue billion Forecast, by Chemistry 2020 & 2033
- Table 28: Global APAC Scale Inhibitors Market Revenue billion Forecast, by End-user Industry 2020 & 2033
- Table 29: Global APAC Scale Inhibitors Market Revenue billion Forecast, by Geography 2020 & 2033
- Table 30: Global APAC Scale Inhibitors Market Revenue billion Forecast, by Country 2020 & 2033
- Table 31: Global APAC Scale Inhibitors Market Revenue billion Forecast, by Type 2020 & 2033
- Table 32: Global APAC Scale Inhibitors Market Revenue billion Forecast, by Chemistry 2020 & 2033
- Table 33: Global APAC Scale Inhibitors Market Revenue billion Forecast, by End-user Industry 2020 & 2033
- Table 34: Global APAC Scale Inhibitors Market Revenue billion Forecast, by Geography 2020 & 2033
- Table 35: Global APAC Scale Inhibitors Market Revenue billion Forecast, by Country 2020 & 2033
Frequently Asked Questions
1. What is the projected Compound Annual Growth Rate (CAGR) of the APAC Scale Inhibitors Market?
The projected CAGR is approximately 5.1%.
2. Which companies are prominent players in the APAC Scale Inhibitors Market?
Key companies in the market include BWA Water Additives, Chemtex Speciality Limited, Dow, Ecolab, Genesys International Ltd, Ion Exchange India Limited, Italmatch Chemicals S P A, Kemira, King Lee Technologies, Kurita Water Industries Ltd, Solenis, Suez, Thermax Ltd*List Not Exhaustive.
3. What are the main segments of the APAC Scale Inhibitors Market?
The market segments include Type, Chemistry, End-user Industry, Geography.
4. Can you provide details about the market size?
The market size is estimated to be USD 3.98 billion as of 2022.
5. What are some drivers contributing to market growth?
; Accelerating usage in Power Industry; Growing Popularity of Zero Liquid Blowdown.
6. What are the notable trends driving market growth?
Scale & Corrosion Inhibitors to Dominate the Market.
7. Are there any restraints impacting market growth?
; Accelerating usage in Power Industry; Growing Popularity of Zero Liquid Blowdown.
8. Can you provide examples of recent developments in the market?
N/A
9. What pricing options are available for accessing the report?
Pricing options include single-user, multi-user, and enterprise licenses priced at USD 4750, USD 5250, and USD 8750 respectively.
10. Is the market size provided in terms of value or volume?
The market size is provided in terms of value, measured in billion.
11. Are there any specific market keywords associated with the report?
Yes, the market keyword associated with the report is "APAC Scale Inhibitors Market," which aids in identifying and referencing the specific market segment covered.
12. How do I determine which pricing option suits my needs best?
The pricing options vary based on user requirements and access needs. Individual users may opt for single-user licenses, while businesses requiring broader access may choose multi-user or enterprise licenses for cost-effective access to the report.
13. Are there any additional resources or data provided in the APAC Scale Inhibitors Market report?
While the report offers comprehensive insights, it's advisable to review the specific contents or supplementary materials provided to ascertain if additional resources or data are available.
14. How can I stay updated on further developments or reports in the APAC Scale Inhibitors Market?
To stay informed about further developments, trends, and reports in the APAC Scale Inhibitors Market, consider subscribing to industry newsletters, following relevant companies and organizations, or regularly checking reputable industry news sources and publications.
Methodology
Step 1 - Identification of Relevant Samples Size from Population Database


Step 2 - Approaches for Defining Global Market Size (Value, Volume* & Price*)

Note*: In applicable scenarios
Step 3 - Data Sources
Primary Research
- Web Analytics
- Survey Reports
- Research Institute
- Latest Research Reports
- Opinion Leaders
Secondary Research
- Annual Reports
- White Paper
- Latest Press Release
- Industry Association
- Paid Database
- Investor Presentations

Step 4 - Data Triangulation
Involves using different sources of information in order to increase the validity of a study
These sources are likely to be stakeholders in a program - participants, other researchers, program staff, other community members, and so on.
Then we put all data in single framework & apply various statistical tools to find out the dynamic on the market.
During the analysis stage, feedback from the stakeholder groups would be compared to determine areas of agreement as well as areas of divergence