

Key Insights
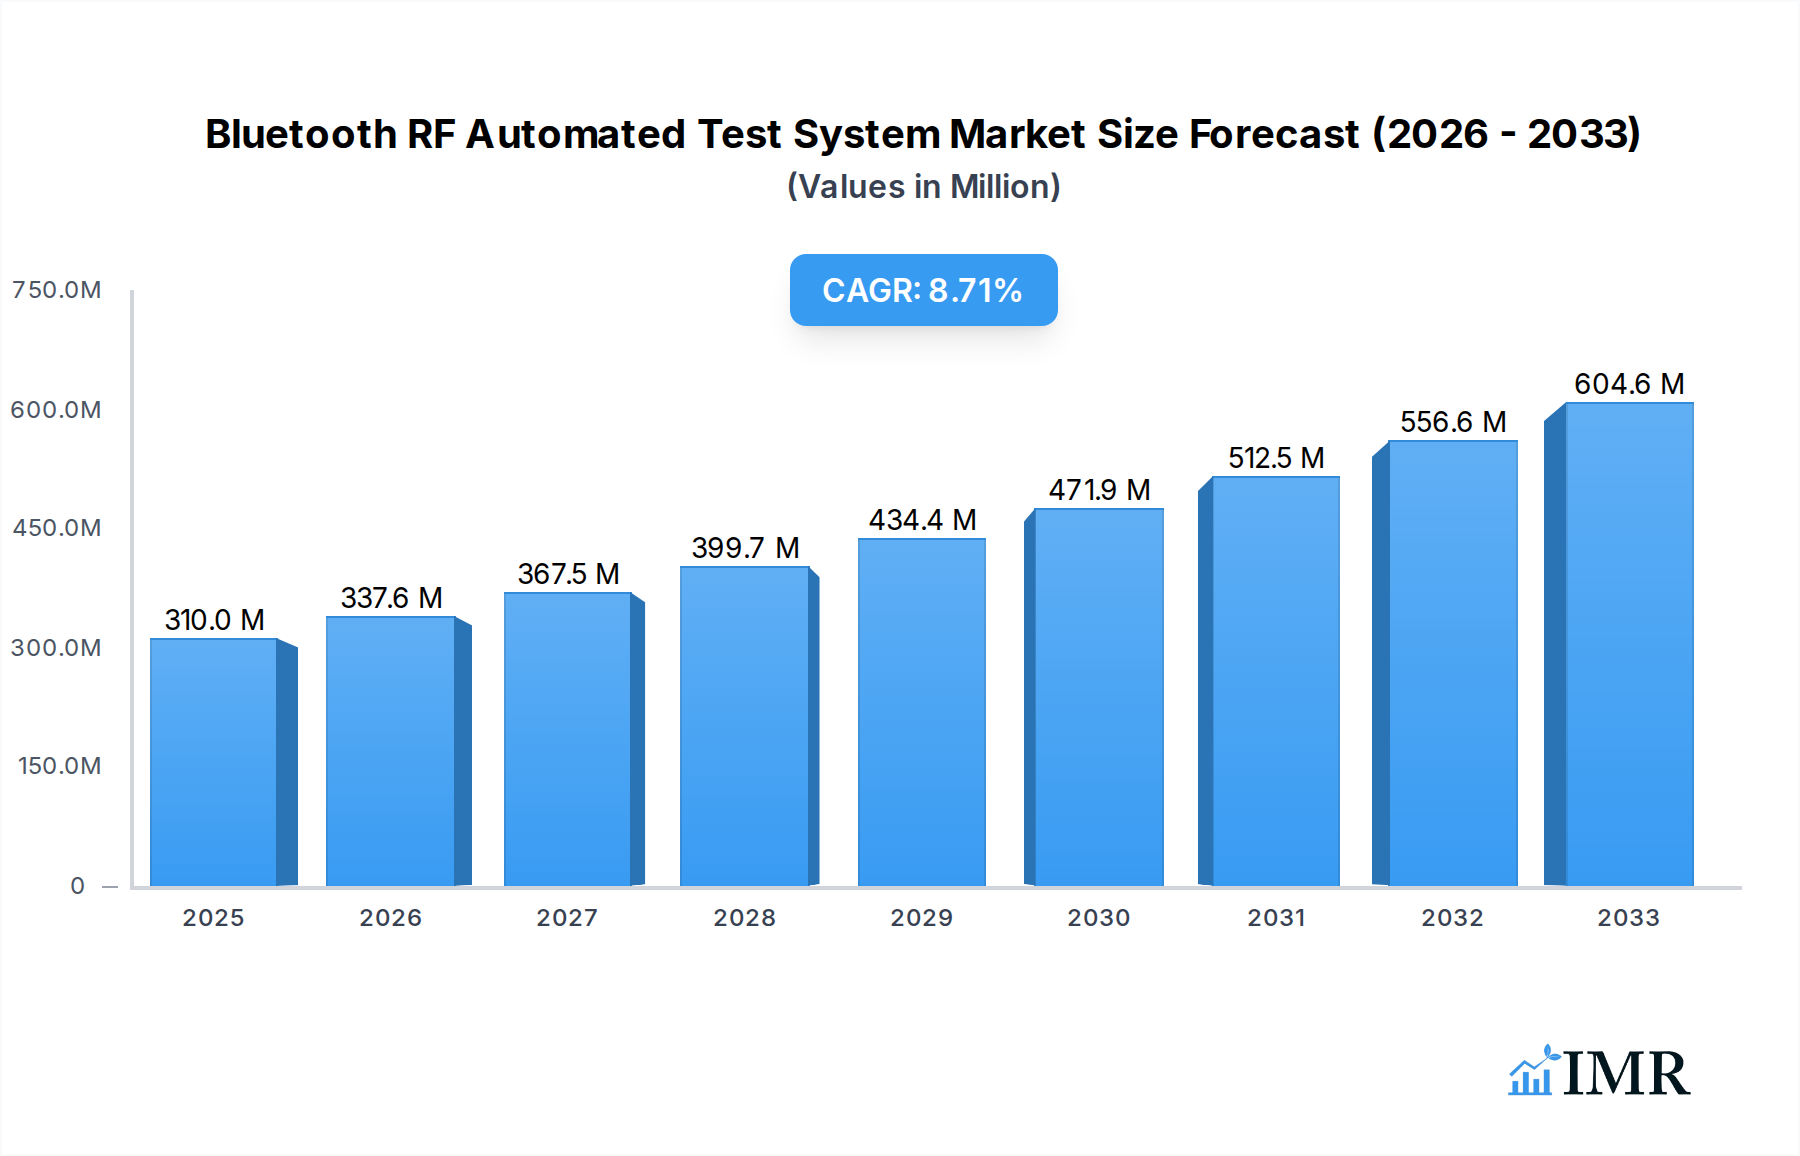
The global Bluetooth RF Automated Test System market is poised for significant expansion, projected to reach a market size of $310 million in 2025. This robust growth is fueled by an impressive Compound Annual Growth Rate (CAGR) of 9.06%, indicating a dynamic and expanding sector. The increasing adoption of Bluetooth technology across diverse applications, from the rapidly evolving telecommunications and consumer electronics sectors to the stringent demands of the aerospace and military industries, is a primary growth driver. Advancements in Bluetooth versions, particularly the enhanced capabilities of Bluetooth 5.0 and 5.1, which offer superior data transfer rates, extended range, and improved power efficiency, necessitate sophisticated and automated testing solutions to ensure device performance and interoperability. This rising demand for comprehensive and efficient testing infrastructure directly translates into market growth.

Bluetooth RF Automated Test System Market Size (In Million)
Further propelling this market forward are several key trends, including the growing emphasis on IoT device connectivity and the proliferation of smart devices, all of which rely heavily on reliable Bluetooth communication. The demand for higher testing throughput and reduced testing times in manufacturing environments also strongly supports the adoption of automated test systems. While the market exhibits a strong upward trajectory, potential restraints such as the initial high investment cost for advanced automated test systems and the availability of skilled personnel for operation and maintenance could pose challenges. However, the long-term benefits of enhanced product quality, reduced time-to-market, and improved testing accuracy are expected to outweigh these concerns. The market segmentation across various applications and the increasing technological sophistication of Bluetooth versions ensure a broad and sustained demand for these critical testing solutions.
Bluetooth RF Automated Test System Company Market Share
This in-depth market research report provides a definitive analysis of the global Bluetooth RF Automated Test System market, offering critical insights for stakeholders across telecommunications, industry, aerospace, military, and other sectors. Covering a study period from 2019 to 2033, with a base year of 2025, this report delivers actionable intelligence on market dynamics, growth trends, regional dominance, product landscapes, and future opportunities.
Bluetooth RF Automated Test System Market Dynamics & Structure
The Bluetooth RF Automated Test System market is characterized by a moderate to high level of concentration, with a few dominant players accounting for a significant portion of the market share. Technological innovation remains a primary driver, fueled by the relentless evolution of Bluetooth standards from Bluetooth 4.2 to the advanced capabilities of Bluetooth 5.0 and 5.1. Regulatory frameworks, particularly those mandating compliance and certification for wireless devices, play a crucial role in shaping market demand. Competitive product substitutes, while present in certain niche applications, are largely outpaced by the comprehensive testing solutions offered by specialized RF automated test systems. End-user demographics are increasingly diverse, spanning from consumer electronics manufacturers to enterprise solutions providers and critical infrastructure operators. Mergers and acquisitions (M&A) are a notable trend, with companies consolidating to expand their product portfolios, technological expertise, and geographical reach. For instance, approximately 15-20% of the market value is influenced by strategic acquisitions over the historical period. Innovation barriers primarily stem from the high cost of R&D, the complexity of evolving Bluetooth specifications, and the need for specialized engineering talent.
- Market Concentration: Dominated by a few key global players, with a growing presence of regional specialists.
- Technological Innovation Drivers: Advancements in Bluetooth versions (e.g., LE Audio, Mesh networking) necessitating more sophisticated testing.
- Regulatory Frameworks: Stringent certification requirements for RF devices in major markets.
- Competitive Product Substitutes: Limited in comprehensive RF testing, but point solutions exist for specific functionalities.
- End-User Demographics: Broad adoption across consumer electronics, automotive, industrial IoT, and medical devices.
- M&A Trends: Strategic acquisitions for market consolidation and technology integration.
Bluetooth RF Automated Test System Growth Trends & Insights
The global Bluetooth RF Automated Test System market is projected for substantial growth, driven by the ubiquitous adoption of Bluetooth technology across a myriad of applications. The market size, estimated at $1.8 billion in 2025, is anticipated to reach $3.5 billion by 2033, exhibiting a Compound Annual Growth Rate (CAGR) of approximately 8.5% during the forecast period (2025-2033). This growth trajectory is significantly influenced by the increasing complexity and feature sets of new Bluetooth versions, such as Bluetooth 5.1, which offers enhanced direction finding capabilities, and the upcoming Bluetooth 5.2 and beyond, incorporating features like LE Audio for improved audio streaming and reduced power consumption. The adoption rates for these advanced standards are steadily increasing, compelling manufacturers to invest in sophisticated automated test systems to ensure product quality and interoperability.
Technological disruptions, including the rise of AI-powered test optimization and cloud-based testing solutions, are further reshaping the market. These innovations promise to reduce testing times, lower costs, and improve the accuracy of RF performance validation. Consumer behavior shifts, such as the growing demand for seamless connectivity in smart homes, wearables, and connected vehicles, are directly translating into increased demand for Bluetooth-enabled devices, thereby fueling the need for robust testing infrastructure. The penetration of Bluetooth technology in emerging markets, coupled with stringent quality control measures implemented by regulatory bodies worldwide, are also key growth enablers. For instance, the Telecommunications segment alone accounted for over 45% of the market in 2025, showcasing its pivotal role. The increasing average selling price of automated test systems, driven by enhanced capabilities and precision, is also contributing to market value growth. By 2025, approximately 70% of new Bluetooth device development cycles were already incorporating advanced automated testing protocols, a trend that is expected to continue its upward ascent.
Dominant Regions, Countries, or Segments in Bluetooth RF Automated Test System
The Telecommunications application segment stands out as the dominant force driving the global Bluetooth RF Automated Test System market. In 2025, this segment is estimated to hold a substantial market share of approximately 48%, driven by the continuous innovation and massive deployment of mobile devices, wireless infrastructure, and IoT communication modules that heavily rely on Bluetooth connectivity. Countries within North America and Asia-Pacific are particularly leading this growth. In North America, the robust presence of leading telecommunications companies and a strong demand for high-speed wireless solutions contribute significantly. For example, the United States, with its advanced technological ecosystem and significant investment in 5G infrastructure which often integrates Bluetooth for device pairing and local control, represents a key market.
In the Asia-Pacific region, countries like China, South Korea, and Taiwan are at the forefront, not only as massive manufacturing hubs for telecommunications equipment and consumer electronics but also as significant adopters of advanced wireless technologies. The sheer volume of Bluetooth-enabled devices manufactured and consumed in this region, from smartphones and smartwatches to industrial communication devices, directly translates into a massive demand for RF automated test systems. Furthermore, the increasing integration of Bluetooth in the Industry segment, particularly for industrial IoT (IIoT) applications and machine-to-machine communication, is a rapidly growing sub-segment, estimated to account for 25% of the market by 2025 and projected to grow at a CAGR of 9%. This growth is propelled by the need for reliable wireless connectivity in automated factories and smart grids.
The dominance of the Telecommunications segment is further amplified by the increasing adoption of Bluetooth 5.1, which is projected to capture over 35% of the market by 2025 due to its enhanced location services and increased range, crucial for applications like asset tracking and proximity marketing. The Military segment, while smaller in volume, presents high-value opportunities due to stringent testing requirements for secure and reliable communication systems, estimated at 10% of the market in 2025. Economic policies favoring technological advancements and infrastructure development in these leading countries, coupled with significant R&D investments by major players, solidify the dominance of the Telecommunications segment and key regions like North America and Asia-Pacific in the Bluetooth RF Automated Test System market.
- Dominant Application Segment: Telecommunications (approx. 48% market share in 2025).
- Key Regional Drivers: North America and Asia-Pacific.
- Leading Countries: United States, China, South Korea, Taiwan.
- Growing Segment: Industry (approx. 25% market share in 2025, CAGR of 9%).
- Dominant Bluetooth Type: Bluetooth 5.1 (approx. 35% market share in 2025).
- High-Value Segment: Military (approx. 10% market share in 2025).
Bluetooth RF Automated Test System Product Landscape
The Bluetooth RF Automated Test System product landscape is characterized by increasingly sophisticated and integrated solutions designed to address the evolving complexities of wireless communication. Manufacturers are focusing on developing high-performance test platforms capable of conducting comprehensive RF, baseband, and protocol testing for various Bluetooth versions, including Bluetooth 4.2, 5.0, and the latest 5.1 standards. Innovations include advanced signal generation and analysis capabilities, wider frequency range coverage, and enhanced throughput testing. Many systems now offer modular architectures, allowing for customization and scalability to meet specific testing needs, from development and R&D to manufacturing and quality assurance. Unique selling propositions include faster test times, improved measurement accuracy, reduced cost of test, and support for emerging Bluetooth features like LE Audio and Mesh networking.
Key Drivers, Barriers & Challenges in Bluetooth RF Automated Test System
Key Drivers: The Bluetooth RF Automated Test System market is propelled by several key factors. The relentless expansion of the Internet of Things (IoT) ecosystem, with billions of connected devices relying on Bluetooth for seamless connectivity, is a primary driver. Furthermore, the continuous evolution of Bluetooth standards, such as the introduction of Bluetooth 5.1 with enhanced location services and the upcoming LE Audio, necessitates advanced and precise testing solutions. Stringent regulatory compliance and certification requirements across various industries, including telecommunications, automotive, and healthcare, mandate rigorous RF testing. The growing demand for high-quality wireless audio and data transmission in consumer electronics also fuels market expansion.
Barriers & Challenges: Despite the growth, the market faces several barriers and challenges. The significant upfront investment required for sophisticated automated test equipment can be a barrier for smaller manufacturers or startups. The complexity of Bluetooth protocols and the rapid pace of technological advancements demand continuous updates and specialized expertise, leading to a shortage of skilled personnel. Supply chain disruptions, particularly for critical electronic components, can impact production and lead times for test systems. Intense competition among established players and emerging regional manufacturers puts pressure on pricing and profit margins, with an estimated 5-10% price erosion in certain product categories due to competitive pressures.
Emerging Opportunities in Bluetooth RF Automated Test System
Emerging opportunities in the Bluetooth RF Automated Test System sector are abundant, driven by the increasing integration of Bluetooth in novel applications. The burgeoning field of connected health devices and medical wearables presents a significant avenue for growth, requiring highly accurate and reliable RF testing to ensure patient safety and data integrity. The automotive industry's continuous drive towards advanced driver-assistance systems (ADAS) and in-car infotainment, heavily reliant on Bluetooth connectivity for communication and user interaction, offers substantial potential. Furthermore, the expansion of smart city initiatives and industrial automation projects demanding robust wireless sensor networks presents untapped markets for specialized testing solutions. The increasing demand for interoperability testing between different Bluetooth versions and with other wireless technologies also opens up opportunities for comprehensive testing suites.
Growth Accelerators in the Bluetooth RF Automated Test System Industry
Several catalysts are accelerating long-term growth in the Bluetooth RF Automated Test System industry. Technological breakthroughs in areas like artificial intelligence (AI) and machine learning (ML) are enabling more intelligent and efficient test automation, reducing testing times and costs. Strategic partnerships and collaborations between test equipment manufacturers, semiconductor vendors, and device manufacturers are fostering innovation and faster product development cycles. The increasing adoption of cloud-based testing platforms is democratizing access to advanced testing capabilities, particularly for small and medium-sized enterprises. Furthermore, the ongoing global expansion of 5G networks, which often leverage Bluetooth for device proximity and local control, creates a symbiotic growth effect, driving demand for robust Bluetooth testing.
Key Players Shaping the Bluetooth RF Automated Test System Market
- Cobham
- Rohde & Schwarz
- LitePoint (Teradyne)
- Keysight Technologies
- National Instruments
- Spirent Communications
- Anritsu Corporation
- NetScout Systems
- TESCOM(Emerson Elecrtic)
- Beijing StarPoint Technology
- Dongguan Aopu New Audio Technology
- Beijing Oriental Zhongke Integrated Technology
- Dongguan Qihang Electronic Technology
- Shenzhen Guangke Feitong Technology
- Shenzhen Guide Measurement and Control Technology
Notable Milestones in Bluetooth RF Automated Test System Sector
- 2019: Rohde & Schwarz launches advanced Bluetooth 5 test solutions, enhancing coexistence testing capabilities.
- 2020: LitePoint introduces new test platforms supporting Bluetooth 5.1 direction finding, critical for location-based services.
- 2021: Keysight Technologies announces enhanced performance validation for Bluetooth Low Energy (BLE) audio applications.
- 2022: Spirent Communications acquires a company specializing in IoT device testing, expanding its automated testing portfolio.
- 2023: Anritsu Corporation releases a new generation of Bluetooth testers offering higher throughput and improved accuracy for mass production.
- 2024: National Instruments unveils a flexible and scalable platform to support the evolving Bluetooth standard iterations.
- Early 2025: Several Chinese manufacturers, including Beijing StarPoint Technology and Dongguan Aopu New Audio Technology, announce increased investment in R&D for next-generation Bluetooth testing.
- Mid 2025: Industry-wide discussions around standardized testing protocols for Bluetooth Mesh networking gain momentum.
In-Depth Bluetooth RF Automated Test System Market Outlook
The future outlook for the Bluetooth RF Automated Test System market is exceptionally robust, driven by the relentless innovation in wireless technology and the ever-expanding universe of connected devices. Growth accelerators such as AI-driven test optimization, the increasing adoption of LE Audio, and the critical need for reliable connectivity in industrial IoT and automotive applications will continue to fuel market expansion. Strategic partnerships and the development of more integrated, cost-effective testing solutions will further democratize access to advanced capabilities, ensuring widespread adoption across all segments. The market is poised for sustained growth, offering significant opportunities for companies that can deliver cutting-edge, reliable, and scalable RF testing solutions to meet the evolving demands of the global wireless ecosystem. The forecast suggests a continued upward trajectory, solidifying Bluetooth's position as a cornerstone of modern connectivity.
Bluetooth RF Automated Test System Segmentation
-
1. Application
- 1.1. Telecommunications
- 1.2. Industry
- 1.3. Aerospace
- 1.4. Military
- 1.5. Others
-
2. Types
- 2.1. Bluetooth 4.2
- 2.2. Bluetooth 5.0
- 2.3. Bluetooth 5.1
Bluetooth RF Automated Test System Segmentation By Geography
-
1. North America
- 1.1. United States
- 1.2. Canada
- 1.3. Mexico
-
2. South America
- 2.1. Brazil
- 2.2. Argentina
- 2.3. Rest of South America
-
3. Europe
- 3.1. United Kingdom
- 3.2. Germany
- 3.3. France
- 3.4. Italy
- 3.5. Spain
- 3.6. Russia
- 3.7. Benelux
- 3.8. Nordics
- 3.9. Rest of Europe
-
4. Middle East & Africa
- 4.1. Turkey
- 4.2. Israel
- 4.3. GCC
- 4.4. North Africa
- 4.5. South Africa
- 4.6. Rest of Middle East & Africa
-
5. Asia Pacific
- 5.1. China
- 5.2. India
- 5.3. Japan
- 5.4. South Korea
- 5.5. ASEAN
- 5.6. Oceania
- 5.7. Rest of Asia Pacific
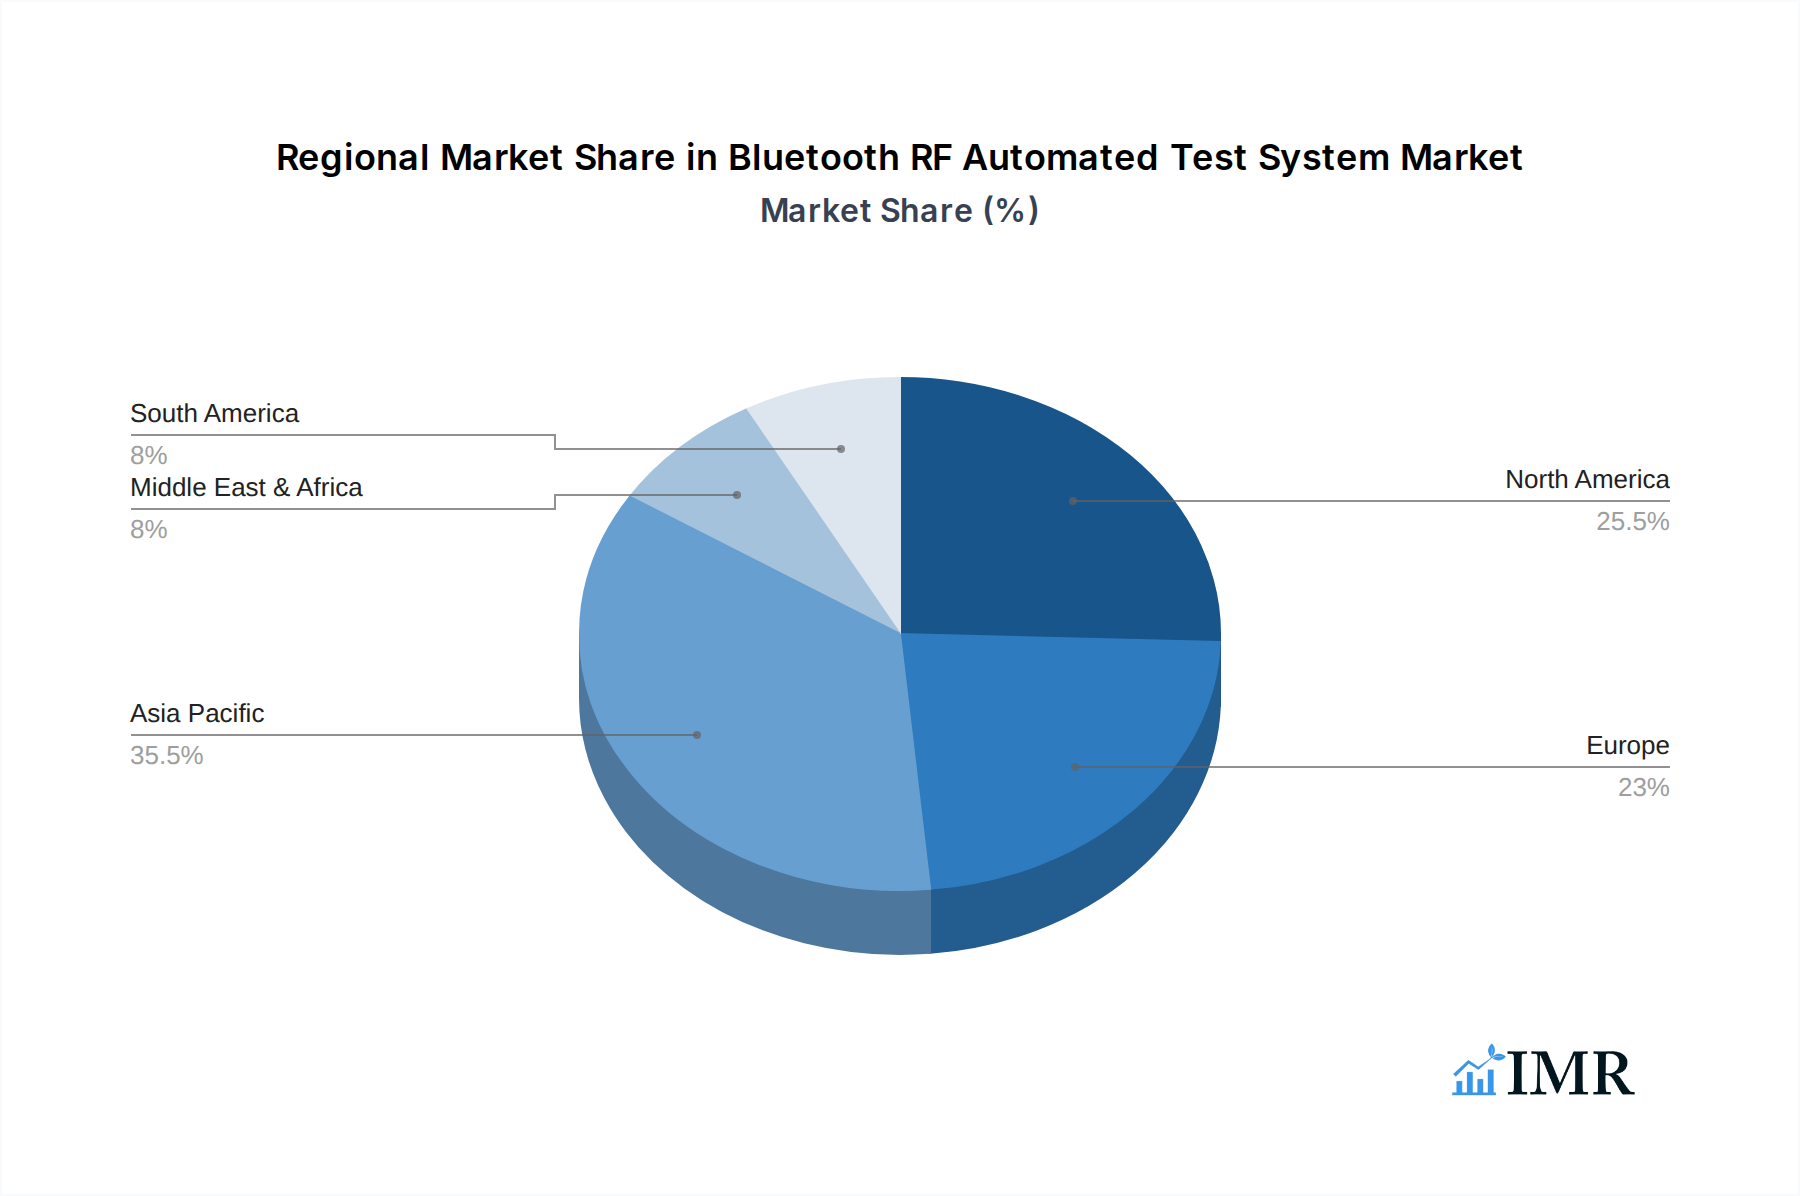
Bluetooth RF Automated Test System Regional Market Share
Geographic Coverage of Bluetooth RF Automated Test System
Bluetooth RF Automated Test System REPORT HIGHLIGHTS
| Aspects | Details |
|---|---|
| Study Period | 2020-2034 |
| Base Year | 2025 |
| Estimated Year | 2026 |
| Forecast Period | 2026-2034 |
| Historical Period | 2020-2025 |
| Growth Rate | CAGR of 9.06% from 2020-2034 |
| Segmentation |
|
Table of Contents
- 1. Introduction
- 1.1. Research Scope
- 1.2. Market Segmentation
- 1.3. Research Methodology
- 1.4. Definitions and Assumptions
- 2. Executive Summary
- 2.1. Introduction
- 3. Market Dynamics
- 3.1. Introduction
- 3.2. Market Drivers
- 3.3. Market Restrains
- 3.4. Market Trends
- 4. Market Factor Analysis
- 4.1. Porters Five Forces
- 4.2. Supply/Value Chain
- 4.3. PESTEL analysis
- 4.4. Market Entropy
- 4.5. Patent/Trademark Analysis
- 5. Global Bluetooth RF Automated Test System Analysis, Insights and Forecast, 2020-2032
- 5.1. Market Analysis, Insights and Forecast - by Application
- 5.1.1. Telecommunications
- 5.1.2. Industry
- 5.1.3. Aerospace
- 5.1.4. Military
- 5.1.5. Others
- 5.2. Market Analysis, Insights and Forecast - by Types
- 5.2.1. Bluetooth 4.2
- 5.2.2. Bluetooth 5.0
- 5.2.3. Bluetooth 5.1
- 5.3. Market Analysis, Insights and Forecast - by Region
- 5.3.1. North America
- 5.3.2. South America
- 5.3.3. Europe
- 5.3.4. Middle East & Africa
- 5.3.5. Asia Pacific
- 5.1. Market Analysis, Insights and Forecast - by Application
- 6. North America Bluetooth RF Automated Test System Analysis, Insights and Forecast, 2020-2032
- 6.1. Market Analysis, Insights and Forecast - by Application
- 6.1.1. Telecommunications
- 6.1.2. Industry
- 6.1.3. Aerospace
- 6.1.4. Military
- 6.1.5. Others
- 6.2. Market Analysis, Insights and Forecast - by Types
- 6.2.1. Bluetooth 4.2
- 6.2.2. Bluetooth 5.0
- 6.2.3. Bluetooth 5.1
- 6.1. Market Analysis, Insights and Forecast - by Application
- 7. South America Bluetooth RF Automated Test System Analysis, Insights and Forecast, 2020-2032
- 7.1. Market Analysis, Insights and Forecast - by Application
- 7.1.1. Telecommunications
- 7.1.2. Industry
- 7.1.3. Aerospace
- 7.1.4. Military
- 7.1.5. Others
- 7.2. Market Analysis, Insights and Forecast - by Types
- 7.2.1. Bluetooth 4.2
- 7.2.2. Bluetooth 5.0
- 7.2.3. Bluetooth 5.1
- 7.1. Market Analysis, Insights and Forecast - by Application
- 8. Europe Bluetooth RF Automated Test System Analysis, Insights and Forecast, 2020-2032
- 8.1. Market Analysis, Insights and Forecast - by Application
- 8.1.1. Telecommunications
- 8.1.2. Industry
- 8.1.3. Aerospace
- 8.1.4. Military
- 8.1.5. Others
- 8.2. Market Analysis, Insights and Forecast - by Types
- 8.2.1. Bluetooth 4.2
- 8.2.2. Bluetooth 5.0
- 8.2.3. Bluetooth 5.1
- 8.1. Market Analysis, Insights and Forecast - by Application
- 9. Middle East & Africa Bluetooth RF Automated Test System Analysis, Insights and Forecast, 2020-2032
- 9.1. Market Analysis, Insights and Forecast - by Application
- 9.1.1. Telecommunications
- 9.1.2. Industry
- 9.1.3. Aerospace
- 9.1.4. Military
- 9.1.5. Others
- 9.2. Market Analysis, Insights and Forecast - by Types
- 9.2.1. Bluetooth 4.2
- 9.2.2. Bluetooth 5.0
- 9.2.3. Bluetooth 5.1
- 9.1. Market Analysis, Insights and Forecast - by Application
- 10. Asia Pacific Bluetooth RF Automated Test System Analysis, Insights and Forecast, 2020-2032
- 10.1. Market Analysis, Insights and Forecast - by Application
- 10.1.1. Telecommunications
- 10.1.2. Industry
- 10.1.3. Aerospace
- 10.1.4. Military
- 10.1.5. Others
- 10.2. Market Analysis, Insights and Forecast - by Types
- 10.2.1. Bluetooth 4.2
- 10.2.2. Bluetooth 5.0
- 10.2.3. Bluetooth 5.1
- 10.1. Market Analysis, Insights and Forecast - by Application
- 11. Competitive Analysis
- 11.1. Global Market Share Analysis 2025
- 11.2. Company Profiles
- 11.2.1 Cobham
- 11.2.1.1. Overview
- 11.2.1.2. Products
- 11.2.1.3. SWOT Analysis
- 11.2.1.4. Recent Developments
- 11.2.1.5. Financials (Based on Availability)
- 11.2.2 Rohde & Schwarz
- 11.2.2.1. Overview
- 11.2.2.2. Products
- 11.2.2.3. SWOT Analysis
- 11.2.2.4. Recent Developments
- 11.2.2.5. Financials (Based on Availability)
- 11.2.3 LitePoint (Teradyne)
- 11.2.3.1. Overview
- 11.2.3.2. Products
- 11.2.3.3. SWOT Analysis
- 11.2.3.4. Recent Developments
- 11.2.3.5. Financials (Based on Availability)
- 11.2.4 Keysight Technologies
- 11.2.4.1. Overview
- 11.2.4.2. Products
- 11.2.4.3. SWOT Analysis
- 11.2.4.4. Recent Developments
- 11.2.4.5. Financials (Based on Availability)
- 11.2.5 National Instruments
- 11.2.5.1. Overview
- 11.2.5.2. Products
- 11.2.5.3. SWOT Analysis
- 11.2.5.4. Recent Developments
- 11.2.5.5. Financials (Based on Availability)
- 11.2.6 Spirent Communications
- 11.2.6.1. Overview
- 11.2.6.2. Products
- 11.2.6.3. SWOT Analysis
- 11.2.6.4. Recent Developments
- 11.2.6.5. Financials (Based on Availability)
- 11.2.7 Anritsu Corporation
- 11.2.7.1. Overview
- 11.2.7.2. Products
- 11.2.7.3. SWOT Analysis
- 11.2.7.4. Recent Developments
- 11.2.7.5. Financials (Based on Availability)
- 11.2.8 NetScout Systems
- 11.2.8.1. Overview
- 11.2.8.2. Products
- 11.2.8.3. SWOT Analysis
- 11.2.8.4. Recent Developments
- 11.2.8.5. Financials (Based on Availability)
- 11.2.9 TESCOM(Emerson Elecrtic)
- 11.2.9.1. Overview
- 11.2.9.2. Products
- 11.2.9.3. SWOT Analysis
- 11.2.9.4. Recent Developments
- 11.2.9.5. Financials (Based on Availability)
- 11.2.10 Beijing StarPoint Technology
- 11.2.10.1. Overview
- 11.2.10.2. Products
- 11.2.10.3. SWOT Analysis
- 11.2.10.4. Recent Developments
- 11.2.10.5. Financials (Based on Availability)
- 11.2.11 Dongguan Aopu New Audio Technology
- 11.2.11.1. Overview
- 11.2.11.2. Products
- 11.2.11.3. SWOT Analysis
- 11.2.11.4. Recent Developments
- 11.2.11.5. Financials (Based on Availability)
- 11.2.12 Beijing Oriental Zhongke Integrated Technology
- 11.2.12.1. Overview
- 11.2.12.2. Products
- 11.2.12.3. SWOT Analysis
- 11.2.12.4. Recent Developments
- 11.2.12.5. Financials (Based on Availability)
- 11.2.13 Dongguan Qihang Electronic Technology
- 11.2.13.1. Overview
- 11.2.13.2. Products
- 11.2.13.3. SWOT Analysis
- 11.2.13.4. Recent Developments
- 11.2.13.5. Financials (Based on Availability)
- 11.2.14 Shenzhen Guangke Feitong Technology
- 11.2.14.1. Overview
- 11.2.14.2. Products
- 11.2.14.3. SWOT Analysis
- 11.2.14.4. Recent Developments
- 11.2.14.5. Financials (Based on Availability)
- 11.2.15 Shenzhen Guide Measurement and Control Technology
- 11.2.15.1. Overview
- 11.2.15.2. Products
- 11.2.15.3. SWOT Analysis
- 11.2.15.4. Recent Developments
- 11.2.15.5. Financials (Based on Availability)
- 11.2.1 Cobham
List of Figures
- Figure 1: Global Bluetooth RF Automated Test System Revenue Breakdown (undefined, %) by Region 2025 & 2033
- Figure 2: Global Bluetooth RF Automated Test System Volume Breakdown (K, %) by Region 2025 & 2033
- Figure 3: North America Bluetooth RF Automated Test System Revenue (undefined), by Application 2025 & 2033
- Figure 4: North America Bluetooth RF Automated Test System Volume (K), by Application 2025 & 2033
- Figure 5: North America Bluetooth RF Automated Test System Revenue Share (%), by Application 2025 & 2033
- Figure 6: North America Bluetooth RF Automated Test System Volume Share (%), by Application 2025 & 2033
- Figure 7: North America Bluetooth RF Automated Test System Revenue (undefined), by Types 2025 & 2033
- Figure 8: North America Bluetooth RF Automated Test System Volume (K), by Types 2025 & 2033
- Figure 9: North America Bluetooth RF Automated Test System Revenue Share (%), by Types 2025 & 2033
- Figure 10: North America Bluetooth RF Automated Test System Volume Share (%), by Types 2025 & 2033
- Figure 11: North America Bluetooth RF Automated Test System Revenue (undefined), by Country 2025 & 2033
- Figure 12: North America Bluetooth RF Automated Test System Volume (K), by Country 2025 & 2033
- Figure 13: North America Bluetooth RF Automated Test System Revenue Share (%), by Country 2025 & 2033
- Figure 14: North America Bluetooth RF Automated Test System Volume Share (%), by Country 2025 & 2033
- Figure 15: South America Bluetooth RF Automated Test System Revenue (undefined), by Application 2025 & 2033
- Figure 16: South America Bluetooth RF Automated Test System Volume (K), by Application 2025 & 2033
- Figure 17: South America Bluetooth RF Automated Test System Revenue Share (%), by Application 2025 & 2033
- Figure 18: South America Bluetooth RF Automated Test System Volume Share (%), by Application 2025 & 2033
- Figure 19: South America Bluetooth RF Automated Test System Revenue (undefined), by Types 2025 & 2033
- Figure 20: South America Bluetooth RF Automated Test System Volume (K), by Types 2025 & 2033
- Figure 21: South America Bluetooth RF Automated Test System Revenue Share (%), by Types 2025 & 2033
- Figure 22: South America Bluetooth RF Automated Test System Volume Share (%), by Types 2025 & 2033
- Figure 23: South America Bluetooth RF Automated Test System Revenue (undefined), by Country 2025 & 2033
- Figure 24: South America Bluetooth RF Automated Test System Volume (K), by Country 2025 & 2033
- Figure 25: South America Bluetooth RF Automated Test System Revenue Share (%), by Country 2025 & 2033
- Figure 26: South America Bluetooth RF Automated Test System Volume Share (%), by Country 2025 & 2033
- Figure 27: Europe Bluetooth RF Automated Test System Revenue (undefined), by Application 2025 & 2033
- Figure 28: Europe Bluetooth RF Automated Test System Volume (K), by Application 2025 & 2033
- Figure 29: Europe Bluetooth RF Automated Test System Revenue Share (%), by Application 2025 & 2033
- Figure 30: Europe Bluetooth RF Automated Test System Volume Share (%), by Application 2025 & 2033
- Figure 31: Europe Bluetooth RF Automated Test System Revenue (undefined), by Types 2025 & 2033
- Figure 32: Europe Bluetooth RF Automated Test System Volume (K), by Types 2025 & 2033
- Figure 33: Europe Bluetooth RF Automated Test System Revenue Share (%), by Types 2025 & 2033
- Figure 34: Europe Bluetooth RF Automated Test System Volume Share (%), by Types 2025 & 2033
- Figure 35: Europe Bluetooth RF Automated Test System Revenue (undefined), by Country 2025 & 2033
- Figure 36: Europe Bluetooth RF Automated Test System Volume (K), by Country 2025 & 2033
- Figure 37: Europe Bluetooth RF Automated Test System Revenue Share (%), by Country 2025 & 2033
- Figure 38: Europe Bluetooth RF Automated Test System Volume Share (%), by Country 2025 & 2033
- Figure 39: Middle East & Africa Bluetooth RF Automated Test System Revenue (undefined), by Application 2025 & 2033
- Figure 40: Middle East & Africa Bluetooth RF Automated Test System Volume (K), by Application 2025 & 2033
- Figure 41: Middle East & Africa Bluetooth RF Automated Test System Revenue Share (%), by Application 2025 & 2033
- Figure 42: Middle East & Africa Bluetooth RF Automated Test System Volume Share (%), by Application 2025 & 2033
- Figure 43: Middle East & Africa Bluetooth RF Automated Test System Revenue (undefined), by Types 2025 & 2033
- Figure 44: Middle East & Africa Bluetooth RF Automated Test System Volume (K), by Types 2025 & 2033
- Figure 45: Middle East & Africa Bluetooth RF Automated Test System Revenue Share (%), by Types 2025 & 2033
- Figure 46: Middle East & Africa Bluetooth RF Automated Test System Volume Share (%), by Types 2025 & 2033
- Figure 47: Middle East & Africa Bluetooth RF Automated Test System Revenue (undefined), by Country 2025 & 2033
- Figure 48: Middle East & Africa Bluetooth RF Automated Test System Volume (K), by Country 2025 & 2033
- Figure 49: Middle East & Africa Bluetooth RF Automated Test System Revenue Share (%), by Country 2025 & 2033
- Figure 50: Middle East & Africa Bluetooth RF Automated Test System Volume Share (%), by Country 2025 & 2033
- Figure 51: Asia Pacific Bluetooth RF Automated Test System Revenue (undefined), by Application 2025 & 2033
- Figure 52: Asia Pacific Bluetooth RF Automated Test System Volume (K), by Application 2025 & 2033
- Figure 53: Asia Pacific Bluetooth RF Automated Test System Revenue Share (%), by Application 2025 & 2033
- Figure 54: Asia Pacific Bluetooth RF Automated Test System Volume Share (%), by Application 2025 & 2033
- Figure 55: Asia Pacific Bluetooth RF Automated Test System Revenue (undefined), by Types 2025 & 2033
- Figure 56: Asia Pacific Bluetooth RF Automated Test System Volume (K), by Types 2025 & 2033
- Figure 57: Asia Pacific Bluetooth RF Automated Test System Revenue Share (%), by Types 2025 & 2033
- Figure 58: Asia Pacific Bluetooth RF Automated Test System Volume Share (%), by Types 2025 & 2033
- Figure 59: Asia Pacific Bluetooth RF Automated Test System Revenue (undefined), by Country 2025 & 2033
- Figure 60: Asia Pacific Bluetooth RF Automated Test System Volume (K), by Country 2025 & 2033
- Figure 61: Asia Pacific Bluetooth RF Automated Test System Revenue Share (%), by Country 2025 & 2033
- Figure 62: Asia Pacific Bluetooth RF Automated Test System Volume Share (%), by Country 2025 & 2033
List of Tables
- Table 1: Global Bluetooth RF Automated Test System Revenue undefined Forecast, by Application 2020 & 2033
- Table 2: Global Bluetooth RF Automated Test System Volume K Forecast, by Application 2020 & 2033
- Table 3: Global Bluetooth RF Automated Test System Revenue undefined Forecast, by Types 2020 & 2033
- Table 4: Global Bluetooth RF Automated Test System Volume K Forecast, by Types 2020 & 2033
- Table 5: Global Bluetooth RF Automated Test System Revenue undefined Forecast, by Region 2020 & 2033
- Table 6: Global Bluetooth RF Automated Test System Volume K Forecast, by Region 2020 & 2033
- Table 7: Global Bluetooth RF Automated Test System Revenue undefined Forecast, by Application 2020 & 2033
- Table 8: Global Bluetooth RF Automated Test System Volume K Forecast, by Application 2020 & 2033
- Table 9: Global Bluetooth RF Automated Test System Revenue undefined Forecast, by Types 2020 & 2033
- Table 10: Global Bluetooth RF Automated Test System Volume K Forecast, by Types 2020 & 2033
- Table 11: Global Bluetooth RF Automated Test System Revenue undefined Forecast, by Country 2020 & 2033
- Table 12: Global Bluetooth RF Automated Test System Volume K Forecast, by Country 2020 & 2033
- Table 13: United States Bluetooth RF Automated Test System Revenue (undefined) Forecast, by Application 2020 & 2033
- Table 14: United States Bluetooth RF Automated Test System Volume (K) Forecast, by Application 2020 & 2033
- Table 15: Canada Bluetooth RF Automated Test System Revenue (undefined) Forecast, by Application 2020 & 2033
- Table 16: Canada Bluetooth RF Automated Test System Volume (K) Forecast, by Application 2020 & 2033
- Table 17: Mexico Bluetooth RF Automated Test System Revenue (undefined) Forecast, by Application 2020 & 2033
- Table 18: Mexico Bluetooth RF Automated Test System Volume (K) Forecast, by Application 2020 & 2033
- Table 19: Global Bluetooth RF Automated Test System Revenue undefined Forecast, by Application 2020 & 2033
- Table 20: Global Bluetooth RF Automated Test System Volume K Forecast, by Application 2020 & 2033
- Table 21: Global Bluetooth RF Automated Test System Revenue undefined Forecast, by Types 2020 & 2033
- Table 22: Global Bluetooth RF Automated Test System Volume K Forecast, by Types 2020 & 2033
- Table 23: Global Bluetooth RF Automated Test System Revenue undefined Forecast, by Country 2020 & 2033
- Table 24: Global Bluetooth RF Automated Test System Volume K Forecast, by Country 2020 & 2033
- Table 25: Brazil Bluetooth RF Automated Test System Revenue (undefined) Forecast, by Application 2020 & 2033
- Table 26: Brazil Bluetooth RF Automated Test System Volume (K) Forecast, by Application 2020 & 2033
- Table 27: Argentina Bluetooth RF Automated Test System Revenue (undefined) Forecast, by Application 2020 & 2033
- Table 28: Argentina Bluetooth RF Automated Test System Volume (K) Forecast, by Application 2020 & 2033
- Table 29: Rest of South America Bluetooth RF Automated Test System Revenue (undefined) Forecast, by Application 2020 & 2033
- Table 30: Rest of South America Bluetooth RF Automated Test System Volume (K) Forecast, by Application 2020 & 2033
- Table 31: Global Bluetooth RF Automated Test System Revenue undefined Forecast, by Application 2020 & 2033
- Table 32: Global Bluetooth RF Automated Test System Volume K Forecast, by Application 2020 & 2033
- Table 33: Global Bluetooth RF Automated Test System Revenue undefined Forecast, by Types 2020 & 2033
- Table 34: Global Bluetooth RF Automated Test System Volume K Forecast, by Types 2020 & 2033
- Table 35: Global Bluetooth RF Automated Test System Revenue undefined Forecast, by Country 2020 & 2033
- Table 36: Global Bluetooth RF Automated Test System Volume K Forecast, by Country 2020 & 2033
- Table 37: United Kingdom Bluetooth RF Automated Test System Revenue (undefined) Forecast, by Application 2020 & 2033
- Table 38: United Kingdom Bluetooth RF Automated Test System Volume (K) Forecast, by Application 2020 & 2033
- Table 39: Germany Bluetooth RF Automated Test System Revenue (undefined) Forecast, by Application 2020 & 2033
- Table 40: Germany Bluetooth RF Automated Test System Volume (K) Forecast, by Application 2020 & 2033
- Table 41: France Bluetooth RF Automated Test System Revenue (undefined) Forecast, by Application 2020 & 2033
- Table 42: France Bluetooth RF Automated Test System Volume (K) Forecast, by Application 2020 & 2033
- Table 43: Italy Bluetooth RF Automated Test System Revenue (undefined) Forecast, by Application 2020 & 2033
- Table 44: Italy Bluetooth RF Automated Test System Volume (K) Forecast, by Application 2020 & 2033
- Table 45: Spain Bluetooth RF Automated Test System Revenue (undefined) Forecast, by Application 2020 & 2033
- Table 46: Spain Bluetooth RF Automated Test System Volume (K) Forecast, by Application 2020 & 2033
- Table 47: Russia Bluetooth RF Automated Test System Revenue (undefined) Forecast, by Application 2020 & 2033
- Table 48: Russia Bluetooth RF Automated Test System Volume (K) Forecast, by Application 2020 & 2033
- Table 49: Benelux Bluetooth RF Automated Test System Revenue (undefined) Forecast, by Application 2020 & 2033
- Table 50: Benelux Bluetooth RF Automated Test System Volume (K) Forecast, by Application 2020 & 2033
- Table 51: Nordics Bluetooth RF Automated Test System Revenue (undefined) Forecast, by Application 2020 & 2033
- Table 52: Nordics Bluetooth RF Automated Test System Volume (K) Forecast, by Application 2020 & 2033
- Table 53: Rest of Europe Bluetooth RF Automated Test System Revenue (undefined) Forecast, by Application 2020 & 2033
- Table 54: Rest of Europe Bluetooth RF Automated Test System Volume (K) Forecast, by Application 2020 & 2033
- Table 55: Global Bluetooth RF Automated Test System Revenue undefined Forecast, by Application 2020 & 2033
- Table 56: Global Bluetooth RF Automated Test System Volume K Forecast, by Application 2020 & 2033
- Table 57: Global Bluetooth RF Automated Test System Revenue undefined Forecast, by Types 2020 & 2033
- Table 58: Global Bluetooth RF Automated Test System Volume K Forecast, by Types 2020 & 2033
- Table 59: Global Bluetooth RF Automated Test System Revenue undefined Forecast, by Country 2020 & 2033
- Table 60: Global Bluetooth RF Automated Test System Volume K Forecast, by Country 2020 & 2033
- Table 61: Turkey Bluetooth RF Automated Test System Revenue (undefined) Forecast, by Application 2020 & 2033
- Table 62: Turkey Bluetooth RF Automated Test System Volume (K) Forecast, by Application 2020 & 2033
- Table 63: Israel Bluetooth RF Automated Test System Revenue (undefined) Forecast, by Application 2020 & 2033
- Table 64: Israel Bluetooth RF Automated Test System Volume (K) Forecast, by Application 2020 & 2033
- Table 65: GCC Bluetooth RF Automated Test System Revenue (undefined) Forecast, by Application 2020 & 2033
- Table 66: GCC Bluetooth RF Automated Test System Volume (K) Forecast, by Application 2020 & 2033
- Table 67: North Africa Bluetooth RF Automated Test System Revenue (undefined) Forecast, by Application 2020 & 2033
- Table 68: North Africa Bluetooth RF Automated Test System Volume (K) Forecast, by Application 2020 & 2033
- Table 69: South Africa Bluetooth RF Automated Test System Revenue (undefined) Forecast, by Application 2020 & 2033
- Table 70: South Africa Bluetooth RF Automated Test System Volume (K) Forecast, by Application 2020 & 2033
- Table 71: Rest of Middle East & Africa Bluetooth RF Automated Test System Revenue (undefined) Forecast, by Application 2020 & 2033
- Table 72: Rest of Middle East & Africa Bluetooth RF Automated Test System Volume (K) Forecast, by Application 2020 & 2033
- Table 73: Global Bluetooth RF Automated Test System Revenue undefined Forecast, by Application 2020 & 2033
- Table 74: Global Bluetooth RF Automated Test System Volume K Forecast, by Application 2020 & 2033
- Table 75: Global Bluetooth RF Automated Test System Revenue undefined Forecast, by Types 2020 & 2033
- Table 76: Global Bluetooth RF Automated Test System Volume K Forecast, by Types 2020 & 2033
- Table 77: Global Bluetooth RF Automated Test System Revenue undefined Forecast, by Country 2020 & 2033
- Table 78: Global Bluetooth RF Automated Test System Volume K Forecast, by Country 2020 & 2033
- Table 79: China Bluetooth RF Automated Test System Revenue (undefined) Forecast, by Application 2020 & 2033
- Table 80: China Bluetooth RF Automated Test System Volume (K) Forecast, by Application 2020 & 2033
- Table 81: India Bluetooth RF Automated Test System Revenue (undefined) Forecast, by Application 2020 & 2033
- Table 82: India Bluetooth RF Automated Test System Volume (K) Forecast, by Application 2020 & 2033
- Table 83: Japan Bluetooth RF Automated Test System Revenue (undefined) Forecast, by Application 2020 & 2033
- Table 84: Japan Bluetooth RF Automated Test System Volume (K) Forecast, by Application 2020 & 2033
- Table 85: South Korea Bluetooth RF Automated Test System Revenue (undefined) Forecast, by Application 2020 & 2033
- Table 86: South Korea Bluetooth RF Automated Test System Volume (K) Forecast, by Application 2020 & 2033
- Table 87: ASEAN Bluetooth RF Automated Test System Revenue (undefined) Forecast, by Application 2020 & 2033
- Table 88: ASEAN Bluetooth RF Automated Test System Volume (K) Forecast, by Application 2020 & 2033
- Table 89: Oceania Bluetooth RF Automated Test System Revenue (undefined) Forecast, by Application 2020 & 2033
- Table 90: Oceania Bluetooth RF Automated Test System Volume (K) Forecast, by Application 2020 & 2033
- Table 91: Rest of Asia Pacific Bluetooth RF Automated Test System Revenue (undefined) Forecast, by Application 2020 & 2033
- Table 92: Rest of Asia Pacific Bluetooth RF Automated Test System Volume (K) Forecast, by Application 2020 & 2033
Frequently Asked Questions
1. What is the projected Compound Annual Growth Rate (CAGR) of the Bluetooth RF Automated Test System?
The projected CAGR is approximately 9.06%.
2. Which companies are prominent players in the Bluetooth RF Automated Test System?
Key companies in the market include Cobham, Rohde & Schwarz, LitePoint (Teradyne), Keysight Technologies, National Instruments, Spirent Communications, Anritsu Corporation, NetScout Systems, TESCOM(Emerson Elecrtic), Beijing StarPoint Technology, Dongguan Aopu New Audio Technology, Beijing Oriental Zhongke Integrated Technology, Dongguan Qihang Electronic Technology, Shenzhen Guangke Feitong Technology, Shenzhen Guide Measurement and Control Technology.
3. What are the main segments of the Bluetooth RF Automated Test System?
The market segments include Application, Types.
4. Can you provide details about the market size?
The market size is estimated to be USD XXX N/A as of 2022.
5. What are some drivers contributing to market growth?
N/A
6. What are the notable trends driving market growth?
N/A
7. Are there any restraints impacting market growth?
N/A
8. Can you provide examples of recent developments in the market?
N/A
9. What pricing options are available for accessing the report?
Pricing options include single-user, multi-user, and enterprise licenses priced at USD 3350.00, USD 5025.00, and USD 6700.00 respectively.
10. Is the market size provided in terms of value or volume?
The market size is provided in terms of value, measured in N/A and volume, measured in K.
11. Are there any specific market keywords associated with the report?
Yes, the market keyword associated with the report is "Bluetooth RF Automated Test System," which aids in identifying and referencing the specific market segment covered.
12. How do I determine which pricing option suits my needs best?
The pricing options vary based on user requirements and access needs. Individual users may opt for single-user licenses, while businesses requiring broader access may choose multi-user or enterprise licenses for cost-effective access to the report.
13. Are there any additional resources or data provided in the Bluetooth RF Automated Test System report?
While the report offers comprehensive insights, it's advisable to review the specific contents or supplementary materials provided to ascertain if additional resources or data are available.
14. How can I stay updated on further developments or reports in the Bluetooth RF Automated Test System?
To stay informed about further developments, trends, and reports in the Bluetooth RF Automated Test System, consider subscribing to industry newsletters, following relevant companies and organizations, or regularly checking reputable industry news sources and publications.
Methodology
Step 1 - Identification of Relevant Samples Size from Population Database


Step 2 - Approaches for Defining Global Market Size (Value, Volume* & Price*)

Note*: In applicable scenarios
Step 3 - Data Sources
Primary Research
- Web Analytics
- Survey Reports
- Research Institute
- Latest Research Reports
- Opinion Leaders
Secondary Research
- Annual Reports
- White Paper
- Latest Press Release
- Industry Association
- Paid Database
- Investor Presentations

Step 4 - Data Triangulation
Involves using different sources of information in order to increase the validity of a study
These sources are likely to be stakeholders in a program - participants, other researchers, program staff, other community members, and so on.
Then we put all data in single framework & apply various statistical tools to find out the dynamic on the market.
During the analysis stage, feedback from the stakeholder groups would be compared to determine areas of agreement as well as areas of divergence