

Key Insights
The global butter market is projected for robust growth, with an estimated market size of $51.8 billion in 2025 and a Compound Annual Growth Rate (CAGR) of 5.5% during the forecast period of 2025-2033. This upward trajectory is primarily driven by increasing consumer demand for premium and artisanal dairy products, a growing awareness of the nutritional benefits of butter, and its versatile applications across retail, food service, and food processing industries. The rising disposable incomes in emerging economies are further fueling this expansion, enabling a greater proportion of the population to indulge in butter-based culinary creations and everyday consumption. The segment for salted butter is expected to lead due to its widespread use in both sweet and savory dishes, while unsalted butter will see steady growth, particularly within the baking and gourmet food sectors.
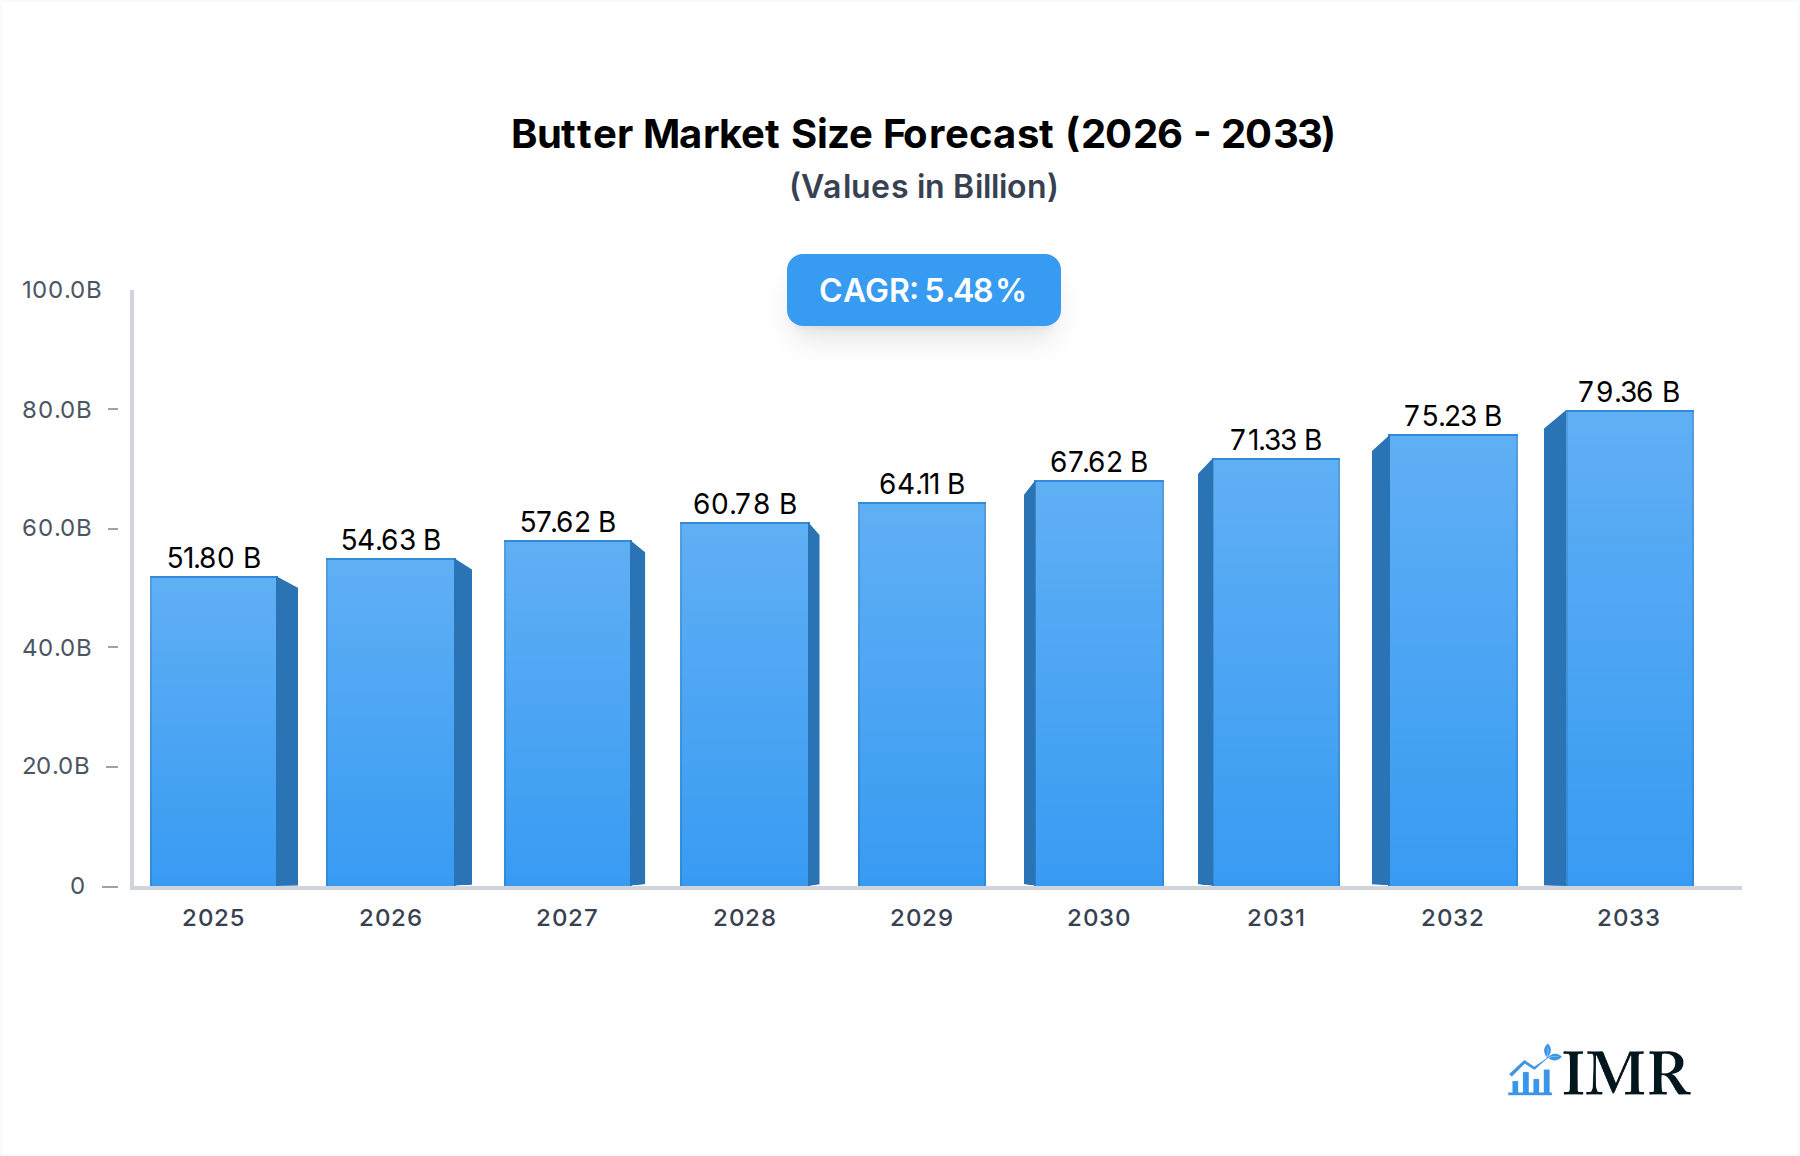
Butter Market Size (In Billion)
The butter market's expansion is strategically supported by various trends, including the surging popularity of organic and natural food products, which are driving demand for butter from pasture-raised cows. Innovation in product formats, such as flavored butters and butter blends, is also capturing consumer interest and opening new market avenues. However, the market faces certain restraints, including the fluctuating prices of raw milk, which can impact production costs and profit margins for manufacturers. Furthermore, the growing popularity of plant-based alternatives, while a niche concern for butter currently, represents a potential long-term challenge that the industry will need to address through continued product differentiation and marketing of butter's unique qualities. Geographically, the Asia Pacific region is anticipated to be a key growth engine, driven by increasing urbanization and a Westernizing diet.

Butter Company Market Share
**Comprehensive Butter Market Report: Trends, Growth, and Future Outlook (2019-2033)**
This in-depth report provides a thorough analysis of the global butter market, offering critical insights into its dynamics, growth trajectory, and future potential. Covering the period from 2019 to 2033, with a base year of 2025, this study is an essential resource for industry professionals, investors, and stakeholders seeking to understand the evolving landscape of the butter industry. We delve into parent and child markets, exploring key segments, dominant regions, and the competitive forces shaping this vital sector. With a focus on high-traffic keywords and SEO optimization, this report aims to maximize visibility and provide unparalleled value.
Butter Market Dynamics & Structure
The global butter market is characterized by a moderate level of concentration, with key players like Fonterra, Ornua, Dairy Farmers of America, and Arla Foods holding significant market shares. Technological innovation, particularly in processing efficiency and the development of specialized butter variants, acts as a significant driver. Regulatory frameworks, especially concerning food safety and labeling standards, also play a crucial role in shaping market entry and product development. Competitive product substitutes, such as margarine and plant-based spreads, pose a continuous challenge, influencing consumer choices and product differentiation strategies. End-user demographics, including rising disposable incomes and a growing preference for natural and premium food products, are increasingly dictating market demand. Mergers and acquisitions (M&A) activity, while not excessively high, continues to consolidate market presence and enhance operational capabilities, with notable deals by major cooperatives and private entities.
- Market Concentration: Moderate, with leading dairy cooperatives and international food companies dominating.
- Technological Innovation: Driven by advancements in pasteurization, churning processes, and product diversification.
- Regulatory Frameworks: Strict adherence to food safety, origin labeling, and organic certifications.
- Competitive Substitutes: Ongoing competition from margarines, vegan spreads, and other fat sources.
- End-User Demographics: Shifting towards health-conscious consumers and those seeking premium, artisanal products.
- M&A Trends: Strategic acquisitions to expand product portfolios and geographical reach.
Butter Growth Trends & Insights
The global butter market is projected to witness robust growth, driven by evolving consumer preferences for natural and less processed foods, coupled with a resurgence in demand for traditional dairy products. The market size is estimated to reach $XX billion by 2033, exhibiting a Compound Annual Growth Rate (CAGR) of XX% during the forecast period of 2025–2033. Adoption rates for premium and specialty butter products are steadily increasing, fueled by culinary trends and a greater appreciation for the taste and versatility of butter in cooking and baking. Technological disruptions, while not revolutionary, are focused on improving production efficiency, enhancing shelf-life, and developing innovative product formats. Consumer behavior shifts are a major catalyst, with a growing segment of the population prioritizing ingredient transparency and seeking out butter made from high-quality, often organic, milk sources. The increasing popularity of home baking and gourmet cooking further bolsters demand. Market penetration is deep in developed economies, while emerging markets present significant untapped potential.
Dominant Regions, Countries, or Segments in Butter
The Retail segment, particularly within Salted Butter, is currently the dominant force driving global butter market growth. This dominance is underpinned by consistent consumer demand for staple food items, elevated by increasing disposable incomes and a growing preference for taste enhancement in everyday meals. Developed regions, including North America and Europe, continue to represent the largest markets due to established dairy industries, high per capita consumption, and a strong consumer appreciation for the quality and flavor profile of butter. Countries like the United States, France, and Germany are key contributors to this market. The economic policies in these regions favor agricultural output and dairy processing, supported by well-developed supply chains and robust distribution networks. Infrastructure development plays a critical role in ensuring efficient product delivery from farms to consumers.
- Leading Segment: Retail, driven by household consumption and baking.
- Dominant Type: Salted Butter, favored for its enhanced flavor in culinary applications.
- Key Regions: North America and Europe, characterized by high per capita consumption and mature dairy markets.
- Dominant Countries: United States, France, Germany, holding significant market share due to strong dairy production and consumer demand.
- Growth Potential: Emerging economies in Asia-Pacific and Latin America offer substantial future growth opportunities.
Butter Product Landscape
The butter product landscape is evolving with a focus on premiumization and niche offerings. Innovations are centered on enhanced flavor profiles through aging, the inclusion of natural ingredients like sea salt or herbs, and the development of cultured butter varieties that offer a richer, tangier taste. Applications are expanding beyond traditional baking and cooking to include gourmet spreads, artisanal cheese pairings, and specialized culinary ingredients. Performance metrics are increasingly measured by taste, texture, and the quality of the raw milk used. Unique selling propositions include organic certifications, grass-fed origins, and artisanal production methods. Technological advancements are improving butter's spreadability at lower temperatures and developing longer shelf-life formulations without compromising on naturalness.
Key Drivers, Barriers & Challenges in Butter
The butter market is propelled by several key drivers, including the growing consumer preference for natural and minimally processed foods, the enduring appeal of butter's taste and texture in cooking and baking, and rising global disposable incomes, particularly in emerging economies. Technological advancements in dairy processing contribute to improved efficiency and product quality.
Conversely, the market faces significant barriers and challenges. Fluctuations in raw milk prices and availability can impact production costs and profitability. Stringent regulatory requirements for dairy products, including hygiene and labeling standards, can increase compliance costs. Intense competition from margarine and plant-based alternatives, driven by health concerns and ethical considerations, continues to exert pressure. Supply chain disruptions, influenced by geopolitical events and climate change, pose a constant threat to consistent availability and pricing.
Emerging Opportunities in Butter
Emerging opportunities in the butter market lie in the burgeoning demand for organic and grass-fed butter, catering to health-conscious and ethically-minded consumers. The expansion of artisanal and specialty butter variants, such as flavored butters and cultured butters, presents untapped potential in gourmet food channels and online retail. Furthermore, the increasing popularity of plant-based diets also presents an indirect opportunity for traditional butter manufacturers to highlight the naturalness and perceived health benefits of dairy butter in comparison to processed alternatives. The development of innovative packaging solutions that enhance convenience and shelf-life also represents a promising avenue for market growth.
Growth Accelerators in the Butter Industry
Growth accelerators in the butter industry are primarily driven by technological breakthroughs in dairy processing that enhance efficiency and product quality, alongside strategic partnerships between dairy cooperatives and food manufacturers to expand market reach. Market expansion strategies targeting emerging economies, where dairy consumption is on the rise, are also crucial catalysts. The increasing focus on sustainability and traceability in the dairy supply chain is not only meeting consumer demand but also fostering greater trust and loyalty, further accelerating growth. Innovations in product diversification, such as the introduction of butter infused with functional ingredients, also contribute to market expansion.
Key Players Shaping the Butter Market
- Fonterra
- Ornua
- Kalona SuperNatural
- Dairy Farmers of America
- MS Iceland Dairies
- Bertolli
- Cabot
- Yeo Valley Farms
- Clover Stornetta Farms
- Arla Foods
- Amul
- Land O Lakes
- Organic Valley
- Horizon Organic
- Tillamook
- Devondale Murray Goulburn
- WCB
- President Cheese
- Rochefort
Notable Milestones in Butter Sector
- 2019: Increased global interest in artisanal and cultured butter, leading to a rise in niche product launches.
- 2020: Heightened demand for butter driven by increased home baking during global lockdowns.
- 2021: Growing awareness and demand for organic and grass-fed butter varieties worldwide.
- 2022: Expansion of plant-based butter alternatives gaining traction, prompting traditional butter makers to emphasize natural qualities.
- 2023: Innovations in butter production focusing on improved spreadability and longer shelf life through natural methods.
- 2024: Strategic partnerships emerge between large dairy producers and gourmet food companies to enhance product distribution.
In-Depth Butter Market Outlook
The butter market outlook remains exceptionally positive, driven by sustained consumer demand for natural dairy products and the enduring appeal of butter's culinary versatility. Growth accelerators such as technological advancements in processing, expansion into emerging markets, and strategic partnerships are poised to further bolster market growth. The increasing emphasis on sustainability, traceability, and premium product offerings will continue to shape consumer preferences and drive innovation. Emerging opportunities in specialty butters and innovative applications will unlock new revenue streams, ensuring a dynamic and evolving marketplace for butter in the coming years.
Butter Segmentation
-
1. Application
- 1.1. Retail
- 1.2. Food Service
- 1.3. Food Processing
-
2. Type
- 2.1. Salted Butter
- 2.2. Unsalted Butter
Butter Segmentation By Geography
-
1. North America
- 1.1. United States
- 1.2. Canada
- 1.3. Mexico
-
2. South America
- 2.1. Brazil
- 2.2. Argentina
- 2.3. Rest of South America
-
3. Europe
- 3.1. United Kingdom
- 3.2. Germany
- 3.3. France
- 3.4. Italy
- 3.5. Spain
- 3.6. Russia
- 3.7. Benelux
- 3.8. Nordics
- 3.9. Rest of Europe
-
4. Middle East & Africa
- 4.1. Turkey
- 4.2. Israel
- 4.3. GCC
- 4.4. North Africa
- 4.5. South Africa
- 4.6. Rest of Middle East & Africa
-
5. Asia Pacific
- 5.1. China
- 5.2. India
- 5.3. Japan
- 5.4. South Korea
- 5.5. ASEAN
- 5.6. Oceania
- 5.7. Rest of Asia Pacific
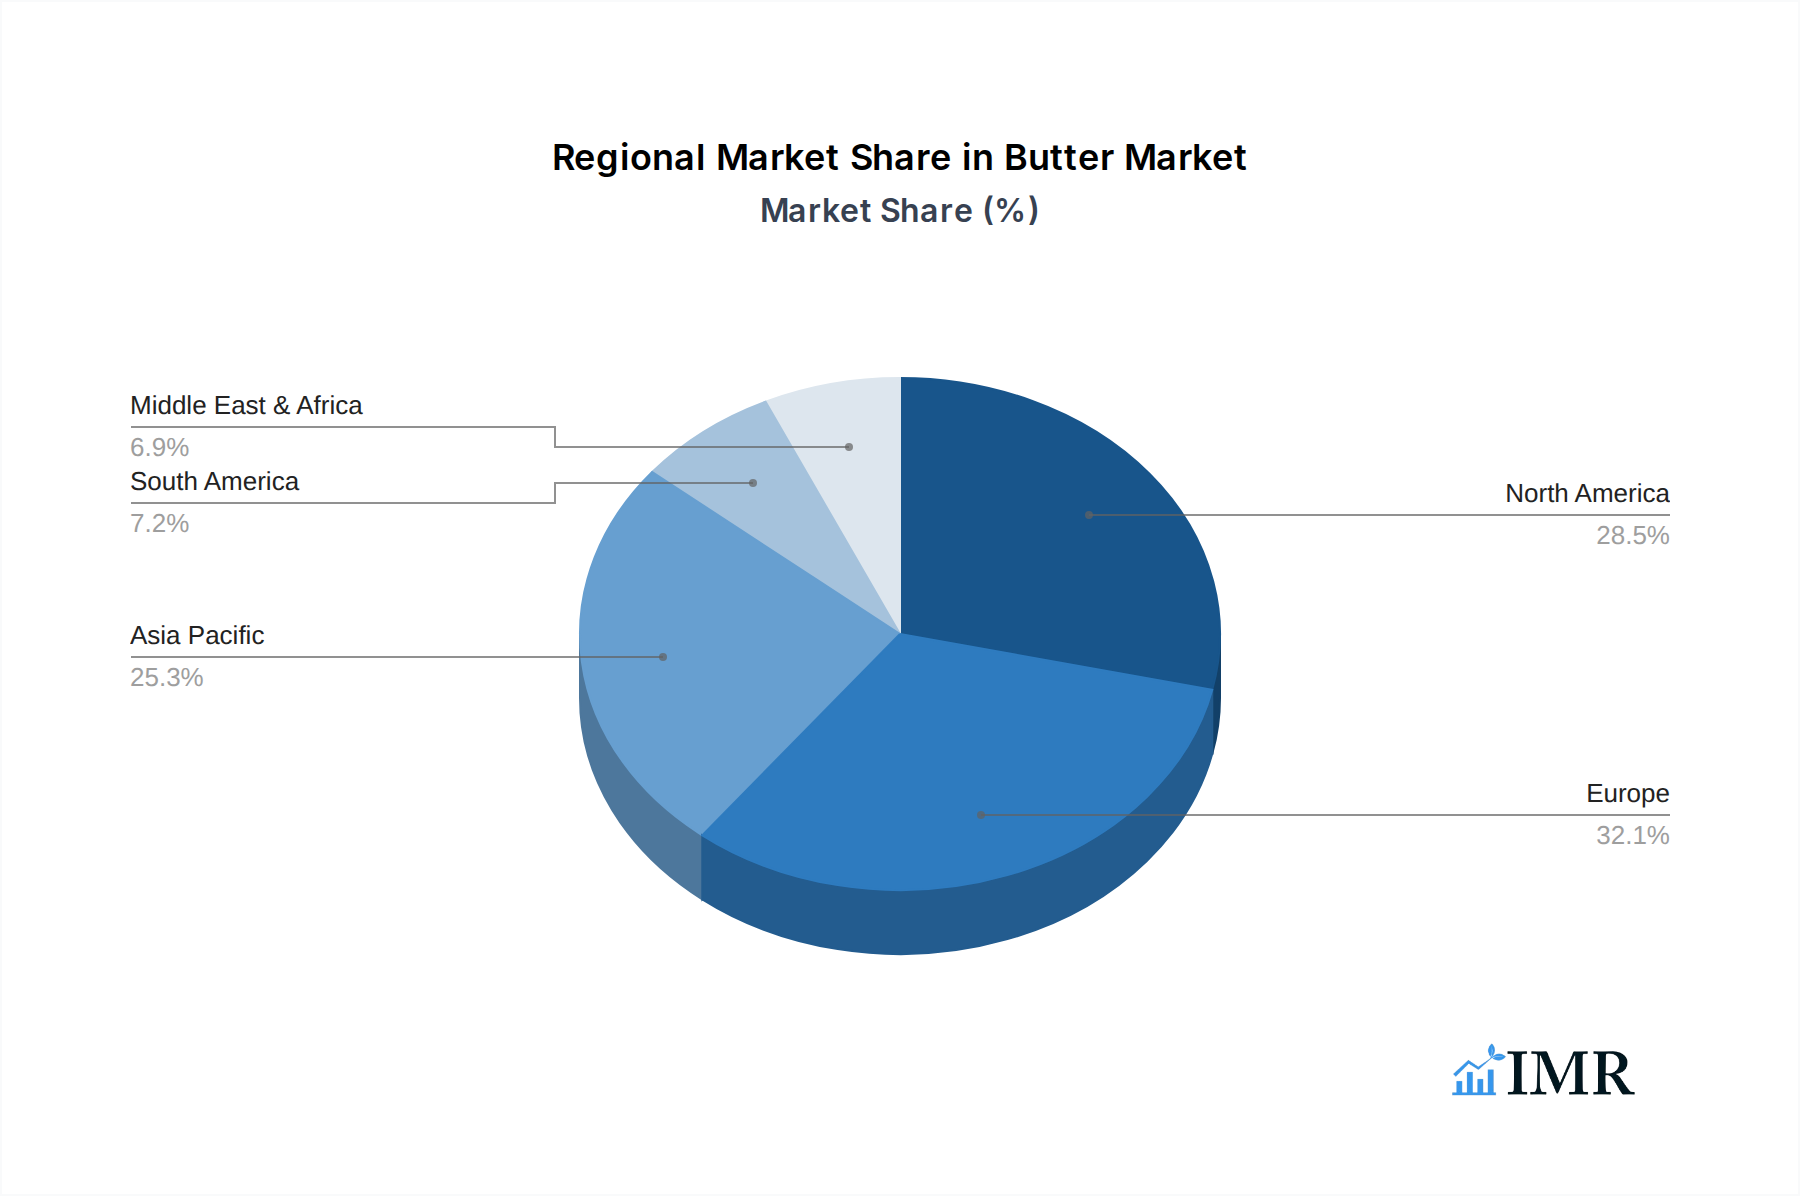
Butter Regional Market Share
Geographic Coverage of Butter
Butter REPORT HIGHLIGHTS
| Aspects | Details |
|---|---|
| Study Period | 2020-2034 |
| Base Year | 2025 |
| Estimated Year | 2026 |
| Forecast Period | 2026-2034 |
| Historical Period | 2020-2025 |
| Growth Rate | CAGR of 5.5% from 2020-2034 |
| Segmentation |
|
Table of Contents
- 1. Introduction
- 1.1. Research Scope
- 1.2. Market Segmentation
- 1.3. Research Objective
- 1.4. Definitions and Assumptions
- 2. Executive Summary
- 2.1. Market Snapshot
- 3. Market Dynamics
- 3.1. Market Drivers
- 3.2. Market Restrains
- 3.3. Market Trends
- 3.4. Market Opportunities
- 4. Market Factor Analysis
- 4.1. Porters Five Forces
- 4.1.1. Bargaining Power of Suppliers
- 4.1.2. Bargaining Power of Buyers
- 4.1.3. Threat of New Entrants
- 4.1.4. Threat of Substitutes
- 4.1.5. Competitive Rivalry
- 4.2. PESTEL analysis
- 4.3. BCG Analysis
- 4.3.1. Stars (High Growth, High Market Share)
- 4.3.2. Cash Cows (Low Growth, High Market Share)
- 4.3.3. Question Mark (High Growth, Low Market Share)
- 4.3.4. Dogs (Low Growth, Low Market Share)
- 4.4. Ansoff Matrix Analysis
- 4.5. Supply Chain Analysis
- 4.6. Regulatory Landscape
- 4.7. Current Market Potential and Opportunity Assessment (TAM–SAM–SOM Framework)
- 4.8. IMR Analyst Note
- 4.1. Porters Five Forces
- 5. Market Analysis, Insights and Forecast 2021-2033
- 5.1. Market Analysis, Insights and Forecast - by Application
- 5.1.1. Retail
- 5.1.2. Food Service
- 5.1.3. Food Processing
- 5.2. Market Analysis, Insights and Forecast - by Type
- 5.2.1. Salted Butter
- 5.2.2. Unsalted Butter
- 5.3. Market Analysis, Insights and Forecast - by Region
- 5.3.1. North America
- 5.3.2. South America
- 5.3.3. Europe
- 5.3.4. Middle East & Africa
- 5.3.5. Asia Pacific
- 5.1. Market Analysis, Insights and Forecast - by Application
- 6. Global Butter Analysis, Insights and Forecast, 2021-2033
- 6.1. Market Analysis, Insights and Forecast - by Application
- 6.1.1. Retail
- 6.1.2. Food Service
- 6.1.3. Food Processing
- 6.2. Market Analysis, Insights and Forecast - by Type
- 6.2.1. Salted Butter
- 6.2.2. Unsalted Butter
- 6.1. Market Analysis, Insights and Forecast - by Application
- 7. North America Butter Analysis, Insights and Forecast, 2020-2032
- 7.1. Market Analysis, Insights and Forecast - by Application
- 7.1.1. Retail
- 7.1.2. Food Service
- 7.1.3. Food Processing
- 7.2. Market Analysis, Insights and Forecast - by Type
- 7.2.1. Salted Butter
- 7.2.2. Unsalted Butter
- 7.1. Market Analysis, Insights and Forecast - by Application
- 8. South America Butter Analysis, Insights and Forecast, 2020-2032
- 8.1. Market Analysis, Insights and Forecast - by Application
- 8.1.1. Retail
- 8.1.2. Food Service
- 8.1.3. Food Processing
- 8.2. Market Analysis, Insights and Forecast - by Type
- 8.2.1. Salted Butter
- 8.2.2. Unsalted Butter
- 8.1. Market Analysis, Insights and Forecast - by Application
- 9. Europe Butter Analysis, Insights and Forecast, 2020-2032
- 9.1. Market Analysis, Insights and Forecast - by Application
- 9.1.1. Retail
- 9.1.2. Food Service
- 9.1.3. Food Processing
- 9.2. Market Analysis, Insights and Forecast - by Type
- 9.2.1. Salted Butter
- 9.2.2. Unsalted Butter
- 9.1. Market Analysis, Insights and Forecast - by Application
- 10. Middle East & Africa Butter Analysis, Insights and Forecast, 2020-2032
- 10.1. Market Analysis, Insights and Forecast - by Application
- 10.1.1. Retail
- 10.1.2. Food Service
- 10.1.3. Food Processing
- 10.2. Market Analysis, Insights and Forecast - by Type
- 10.2.1. Salted Butter
- 10.2.2. Unsalted Butter
- 10.1. Market Analysis, Insights and Forecast - by Application
- 11. Asia Pacific Butter Analysis, Insights and Forecast, 2020-2032
- 11.1. Market Analysis, Insights and Forecast - by Application
- 11.1.1. Retail
- 11.1.2. Food Service
- 11.1.3. Food Processing
- 11.2. Market Analysis, Insights and Forecast - by Type
- 11.2.1. Salted Butter
- 11.2.2. Unsalted Butter
- 11.1. Market Analysis, Insights and Forecast - by Application
- 12. Competitive Analysis
- 12.1. Company Profiles
- 12.1.1 Fonterra
- 12.1.1.1. Company Overview
- 12.1.1.2. Products
- 12.1.1.3. Company Financials
- 12.1.1.4. SWOT Analysis
- 12.1.2 Ornua
- 12.1.2.1. Company Overview
- 12.1.2.2. Products
- 12.1.2.3. Company Financials
- 12.1.2.4. SWOT Analysis
- 12.1.3 Kalona SuperNatural
- 12.1.3.1. Company Overview
- 12.1.3.2. Products
- 12.1.3.3. Company Financials
- 12.1.3.4. SWOT Analysis
- 12.1.4 Dairy Farmers of America
- 12.1.4.1. Company Overview
- 12.1.4.2. Products
- 12.1.4.3. Company Financials
- 12.1.4.4. SWOT Analysis
- 12.1.5 MS Iceland Dairies
- 12.1.5.1. Company Overview
- 12.1.5.2. Products
- 12.1.5.3. Company Financials
- 12.1.5.4. SWOT Analysis
- 12.1.6 Bertolli
- 12.1.6.1. Company Overview
- 12.1.6.2. Products
- 12.1.6.3. Company Financials
- 12.1.6.4. SWOT Analysis
- 12.1.7 Cabot
- 12.1.7.1. Company Overview
- 12.1.7.2. Products
- 12.1.7.3. Company Financials
- 12.1.7.4. SWOT Analysis
- 12.1.8 Yeo Valley Farms
- 12.1.8.1. Company Overview
- 12.1.8.2. Products
- 12.1.8.3. Company Financials
- 12.1.8.4. SWOT Analysis
- 12.1.9 Clover Stornetta Farms
- 12.1.9.1. Company Overview
- 12.1.9.2. Products
- 12.1.9.3. Company Financials
- 12.1.9.4. SWOT Analysis
- 12.1.10 Arla Foods
- 12.1.10.1. Company Overview
- 12.1.10.2. Products
- 12.1.10.3. Company Financials
- 12.1.10.4. SWOT Analysis
- 12.1.11 Amul
- 12.1.11.1. Company Overview
- 12.1.11.2. Products
- 12.1.11.3. Company Financials
- 12.1.11.4. SWOT Analysis
- 12.1.12 Land O Lakes
- 12.1.12.1. Company Overview
- 12.1.12.2. Products
- 12.1.12.3. Company Financials
- 12.1.12.4. SWOT Analysis
- 12.1.13 Organic Valley
- 12.1.13.1. Company Overview
- 12.1.13.2. Products
- 12.1.13.3. Company Financials
- 12.1.13.4. SWOT Analysis
- 12.1.14 Horizon Organic
- 12.1.14.1. Company Overview
- 12.1.14.2. Products
- 12.1.14.3. Company Financials
- 12.1.14.4. SWOT Analysis
- 12.1.15 Tillamook
- 12.1.15.1. Company Overview
- 12.1.15.2. Products
- 12.1.15.3. Company Financials
- 12.1.15.4. SWOT Analysis
- 12.1.16 Devondale Murray Goulburn
- 12.1.16.1. Company Overview
- 12.1.16.2. Products
- 12.1.16.3. Company Financials
- 12.1.16.4. SWOT Analysis
- 12.1.17 WCB
- 12.1.17.1. Company Overview
- 12.1.17.2. Products
- 12.1.17.3. Company Financials
- 12.1.17.4. SWOT Analysis
- 12.1.18 President Cheese
- 12.1.18.1. Company Overview
- 12.1.18.2. Products
- 12.1.18.3. Company Financials
- 12.1.18.4. SWOT Analysis
- 12.1.19 Rochefort
- 12.1.19.1. Company Overview
- 12.1.19.2. Products
- 12.1.19.3. Company Financials
- 12.1.19.4. SWOT Analysis
- 12.1.1 Fonterra
- 12.2. Market Entropy
- 12.2.1 Company's Key Areas Served
- 12.2.2 Recent Developments
- 12.3. Company Market Share Analysis 2025
- 12.3.1 Top 5 Companies Market Share Analysis
- 12.3.2 Top 3 Companies Market Share Analysis
- 12.4. List of Potential Customers
- 13. Research Methodology
List of Figures
- Figure 1: Global Butter Revenue Breakdown (billion, %) by Region 2025 & 2033
- Figure 2: North America Butter Revenue (billion), by Application 2025 & 2033
- Figure 3: North America Butter Revenue Share (%), by Application 2025 & 2033
- Figure 4: North America Butter Revenue (billion), by Type 2025 & 2033
- Figure 5: North America Butter Revenue Share (%), by Type 2025 & 2033
- Figure 6: North America Butter Revenue (billion), by Country 2025 & 2033
- Figure 7: North America Butter Revenue Share (%), by Country 2025 & 2033
- Figure 8: South America Butter Revenue (billion), by Application 2025 & 2033
- Figure 9: South America Butter Revenue Share (%), by Application 2025 & 2033
- Figure 10: South America Butter Revenue (billion), by Type 2025 & 2033
- Figure 11: South America Butter Revenue Share (%), by Type 2025 & 2033
- Figure 12: South America Butter Revenue (billion), by Country 2025 & 2033
- Figure 13: South America Butter Revenue Share (%), by Country 2025 & 2033
- Figure 14: Europe Butter Revenue (billion), by Application 2025 & 2033
- Figure 15: Europe Butter Revenue Share (%), by Application 2025 & 2033
- Figure 16: Europe Butter Revenue (billion), by Type 2025 & 2033
- Figure 17: Europe Butter Revenue Share (%), by Type 2025 & 2033
- Figure 18: Europe Butter Revenue (billion), by Country 2025 & 2033
- Figure 19: Europe Butter Revenue Share (%), by Country 2025 & 2033
- Figure 20: Middle East & Africa Butter Revenue (billion), by Application 2025 & 2033
- Figure 21: Middle East & Africa Butter Revenue Share (%), by Application 2025 & 2033
- Figure 22: Middle East & Africa Butter Revenue (billion), by Type 2025 & 2033
- Figure 23: Middle East & Africa Butter Revenue Share (%), by Type 2025 & 2033
- Figure 24: Middle East & Africa Butter Revenue (billion), by Country 2025 & 2033
- Figure 25: Middle East & Africa Butter Revenue Share (%), by Country 2025 & 2033
- Figure 26: Asia Pacific Butter Revenue (billion), by Application 2025 & 2033
- Figure 27: Asia Pacific Butter Revenue Share (%), by Application 2025 & 2033
- Figure 28: Asia Pacific Butter Revenue (billion), by Type 2025 & 2033
- Figure 29: Asia Pacific Butter Revenue Share (%), by Type 2025 & 2033
- Figure 30: Asia Pacific Butter Revenue (billion), by Country 2025 & 2033
- Figure 31: Asia Pacific Butter Revenue Share (%), by Country 2025 & 2033
List of Tables
- Table 1: Global Butter Revenue billion Forecast, by Application 2020 & 2033
- Table 2: Global Butter Revenue billion Forecast, by Type 2020 & 2033
- Table 3: Global Butter Revenue billion Forecast, by Region 2020 & 2033
- Table 4: Global Butter Revenue billion Forecast, by Application 2020 & 2033
- Table 5: Global Butter Revenue billion Forecast, by Type 2020 & 2033
- Table 6: Global Butter Revenue billion Forecast, by Country 2020 & 2033
- Table 7: United States Butter Revenue (billion) Forecast, by Application 2020 & 2033
- Table 8: Canada Butter Revenue (billion) Forecast, by Application 2020 & 2033
- Table 9: Mexico Butter Revenue (billion) Forecast, by Application 2020 & 2033
- Table 10: Global Butter Revenue billion Forecast, by Application 2020 & 2033
- Table 11: Global Butter Revenue billion Forecast, by Type 2020 & 2033
- Table 12: Global Butter Revenue billion Forecast, by Country 2020 & 2033
- Table 13: Brazil Butter Revenue (billion) Forecast, by Application 2020 & 2033
- Table 14: Argentina Butter Revenue (billion) Forecast, by Application 2020 & 2033
- Table 15: Rest of South America Butter Revenue (billion) Forecast, by Application 2020 & 2033
- Table 16: Global Butter Revenue billion Forecast, by Application 2020 & 2033
- Table 17: Global Butter Revenue billion Forecast, by Type 2020 & 2033
- Table 18: Global Butter Revenue billion Forecast, by Country 2020 & 2033
- Table 19: United Kingdom Butter Revenue (billion) Forecast, by Application 2020 & 2033
- Table 20: Germany Butter Revenue (billion) Forecast, by Application 2020 & 2033
- Table 21: France Butter Revenue (billion) Forecast, by Application 2020 & 2033
- Table 22: Italy Butter Revenue (billion) Forecast, by Application 2020 & 2033
- Table 23: Spain Butter Revenue (billion) Forecast, by Application 2020 & 2033
- Table 24: Russia Butter Revenue (billion) Forecast, by Application 2020 & 2033
- Table 25: Benelux Butter Revenue (billion) Forecast, by Application 2020 & 2033
- Table 26: Nordics Butter Revenue (billion) Forecast, by Application 2020 & 2033
- Table 27: Rest of Europe Butter Revenue (billion) Forecast, by Application 2020 & 2033
- Table 28: Global Butter Revenue billion Forecast, by Application 2020 & 2033
- Table 29: Global Butter Revenue billion Forecast, by Type 2020 & 2033
- Table 30: Global Butter Revenue billion Forecast, by Country 2020 & 2033
- Table 31: Turkey Butter Revenue (billion) Forecast, by Application 2020 & 2033
- Table 32: Israel Butter Revenue (billion) Forecast, by Application 2020 & 2033
- Table 33: GCC Butter Revenue (billion) Forecast, by Application 2020 & 2033
- Table 34: North Africa Butter Revenue (billion) Forecast, by Application 2020 & 2033
- Table 35: South Africa Butter Revenue (billion) Forecast, by Application 2020 & 2033
- Table 36: Rest of Middle East & Africa Butter Revenue (billion) Forecast, by Application 2020 & 2033
- Table 37: Global Butter Revenue billion Forecast, by Application 2020 & 2033
- Table 38: Global Butter Revenue billion Forecast, by Type 2020 & 2033
- Table 39: Global Butter Revenue billion Forecast, by Country 2020 & 2033
- Table 40: China Butter Revenue (billion) Forecast, by Application 2020 & 2033
- Table 41: India Butter Revenue (billion) Forecast, by Application 2020 & 2033
- Table 42: Japan Butter Revenue (billion) Forecast, by Application 2020 & 2033
- Table 43: South Korea Butter Revenue (billion) Forecast, by Application 2020 & 2033
- Table 44: ASEAN Butter Revenue (billion) Forecast, by Application 2020 & 2033
- Table 45: Oceania Butter Revenue (billion) Forecast, by Application 2020 & 2033
- Table 46: Rest of Asia Pacific Butter Revenue (billion) Forecast, by Application 2020 & 2033
Frequently Asked Questions
1. What is the projected Compound Annual Growth Rate (CAGR) of the Butter?
The projected CAGR is approximately 5.5%.
2. Which companies are prominent players in the Butter?
Key companies in the market include Fonterra, Ornua, Kalona SuperNatural, Dairy Farmers of America, MS Iceland Dairies, Bertolli, Cabot, Yeo Valley Farms, Clover Stornetta Farms, Arla Foods, Amul, Land O Lakes, Organic Valley, Horizon Organic, Tillamook, Devondale Murray Goulburn, WCB, President Cheese, Rochefort.
3. What are the main segments of the Butter?
The market segments include Application, Type.
4. Can you provide details about the market size?
The market size is estimated to be USD 51.8 billion as of 2022.
5. What are some drivers contributing to market growth?
N/A
6. What are the notable trends driving market growth?
N/A
7. Are there any restraints impacting market growth?
N/A
8. Can you provide examples of recent developments in the market?
N/A
9. What pricing options are available for accessing the report?
Pricing options include single-user, multi-user, and enterprise licenses priced at USD 5900.00, USD 8850.00, and USD 11800.00 respectively.
10. Is the market size provided in terms of value or volume?
The market size is provided in terms of value, measured in billion.
11. Are there any specific market keywords associated with the report?
Yes, the market keyword associated with the report is "Butter," which aids in identifying and referencing the specific market segment covered.
12. How do I determine which pricing option suits my needs best?
The pricing options vary based on user requirements and access needs. Individual users may opt for single-user licenses, while businesses requiring broader access may choose multi-user or enterprise licenses for cost-effective access to the report.
13. Are there any additional resources or data provided in the Butter report?
While the report offers comprehensive insights, it's advisable to review the specific contents or supplementary materials provided to ascertain if additional resources or data are available.
14. How can I stay updated on further developments or reports in the Butter?
To stay informed about further developments, trends, and reports in the Butter, consider subscribing to industry newsletters, following relevant companies and organizations, or regularly checking reputable industry news sources and publications.
Methodology
Step 1 - Identification of Relevant Samples Size from Population Database


Step 2 - Approaches for Defining Global Market Size (Value, Volume* & Price*)

Note*: In applicable scenarios
Step 3 - Data Sources
Primary Research
- Web Analytics
- Survey Reports
- Research Institute
- Latest Research Reports
- Opinion Leaders
Secondary Research
- Annual Reports
- White Paper
- Latest Press Release
- Industry Association
- Paid Database
- Investor Presentations

Step 4 - Data Triangulation
Involves using different sources of information in order to increase the validity of a study
These sources are likely to be stakeholders in a program - participants, other researchers, program staff, other community members, and so on.
Then we put all data in single framework & apply various statistical tools to find out the dynamic on the market.
During the analysis stage, feedback from the stakeholder groups would be compared to determine areas of agreement as well as areas of divergence