

Key Insights
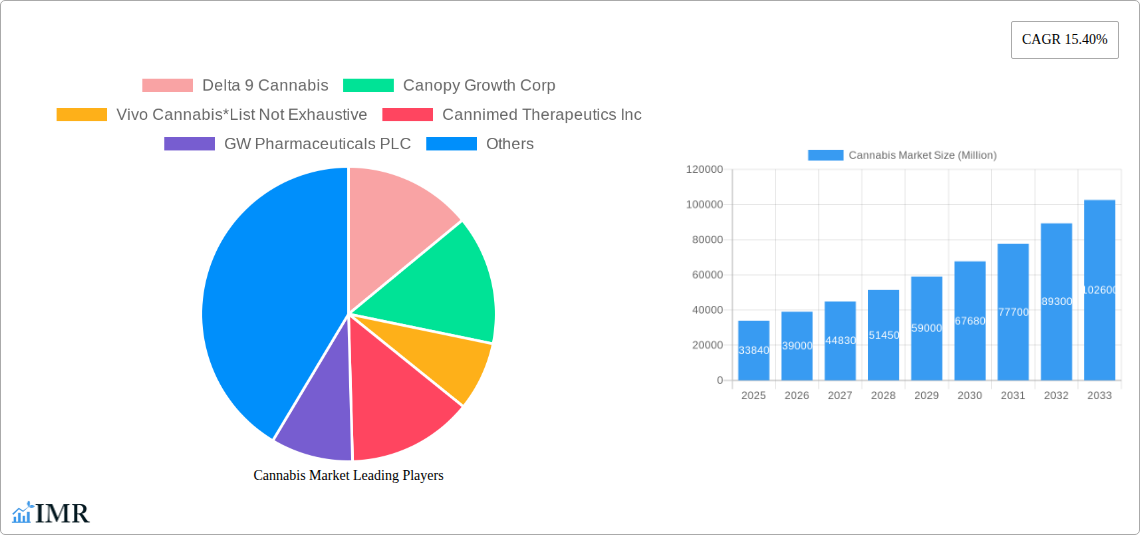
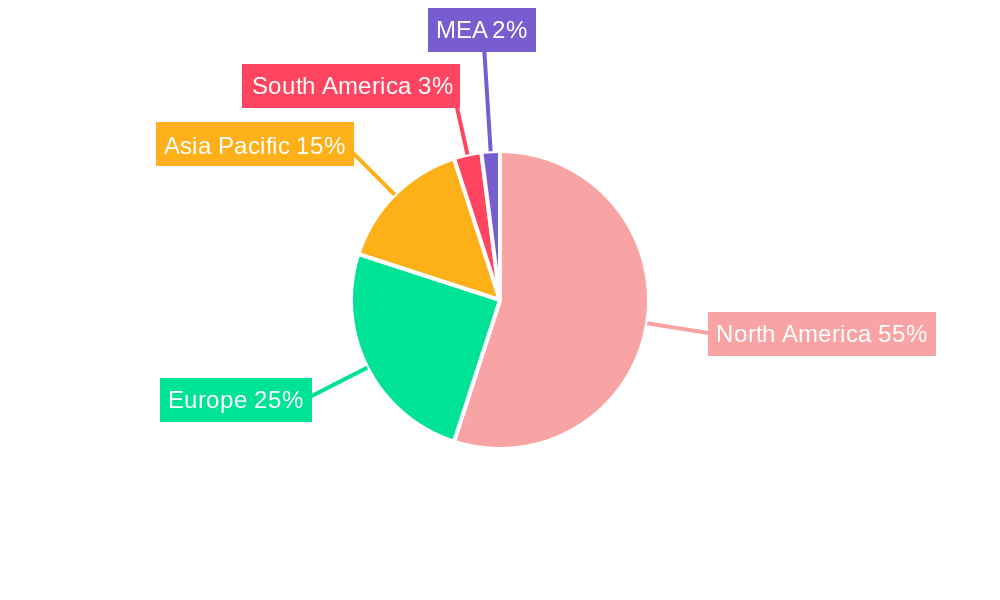
The global cannabis market, valued at $33.84 billion in 2025, is projected to experience robust growth, exhibiting a Compound Annual Growth Rate (CAGR) of 15.40% from 2025 to 2033. This expansion is fueled by several key drivers. Increasing legalization and acceptance of cannabis for both medical and recreational use across various regions are significantly boosting market demand. Furthermore, advancements in cannabis cultivation techniques, product innovation (including diverse forms like capsules, concentrates, and edibles), and the development of sophisticated extraction methods are contributing to market growth. The rising awareness of the therapeutic benefits of cannabinoids like THC and CBD, particularly in managing chronic pain, anxiety, and other health conditions, is further fueling market expansion. However, stringent regulatory frameworks in certain regions, potential public health concerns, and varying levels of social acceptance pose challenges to market growth. The market is segmented by product type (capsules, concentrates, edibles, and others), application (medical and recreational), and compound type (THC, CBD, and balanced THC & CBD), offering various opportunities for market players. The North American market, particularly the United States and Canada, currently dominates the global landscape due to early legalization efforts and a robust consumer base. However, Europe and the Asia-Pacific region are anticipated to witness significant growth in the coming years due to evolving regulatory landscapes and increasing consumer interest.
The competitive landscape is dynamic, featuring a mix of established pharmaceutical companies like GW Pharmaceuticals and emerging cannabis cultivators like Canopy Growth and Aurora Cannabis. These companies are strategically focusing on product diversification, expansion into new markets, and mergers and acquisitions to maintain a competitive edge. The market’s future trajectory hinges on the evolving regulatory environment, consumer acceptance, and technological advancements in cultivation and product development. The continued research into the therapeutic potential of cannabis will likely further propel market growth and reshape the industry’s dynamics. Successful players will need to navigate the complexities of regulatory compliance, consumer education, and product innovation to capitalize on the significant growth opportunities within this rapidly evolving market.
Cannabis Market: A Comprehensive Market Report (2019-2033)
This comprehensive report provides a detailed analysis of the global cannabis market, encompassing its dynamics, growth trends, dominant segments, and key players. The study period covers 2019-2033, with a base year of 2025 and a forecast period of 2025-2033. The report leverages extensive data analysis to provide actionable insights for industry professionals, investors, and stakeholders. This report covers the parent market of Cannabis and delves into the child markets of Medical Cannabis and Recreational Cannabis.
Cannabis Market Dynamics & Structure
The cannabis market is experiencing rapid growth driven by several factors. Market concentration is currently moderate, with several large players vying for dominance, but the landscape is constantly changing due to mergers and acquisitions (M&A). Technological innovation, particularly in cultivation and extraction methods, plays a significant role in driving efficiency and product quality. However, stringent regulatory frameworks vary significantly across regions, posing challenges to market expansion. Competitive pressures exist from both legal and illicit cannabis products, while consumer demographics are shifting toward a more informed and discerning audience.
- Market Concentration: Moderately concentrated, with top 5 players holding xx% market share in 2024 (estimated).
- M&A Activity: A total of xx deals were recorded between 2019-2024, with an average deal value of $xx million.
- Technological Innovation: Advancements in hydroponics, automation, and extraction techniques are key drivers.
- Regulatory Frameworks: Vary significantly globally, impacting market access and product development.
- Competitive Substitutes: Illicit cannabis and other alternative therapies pose competitive challenges.
- End-User Demographics: Growing acceptance and awareness across diverse age groups and demographics.
Cannabis Market Growth Trends & Insights
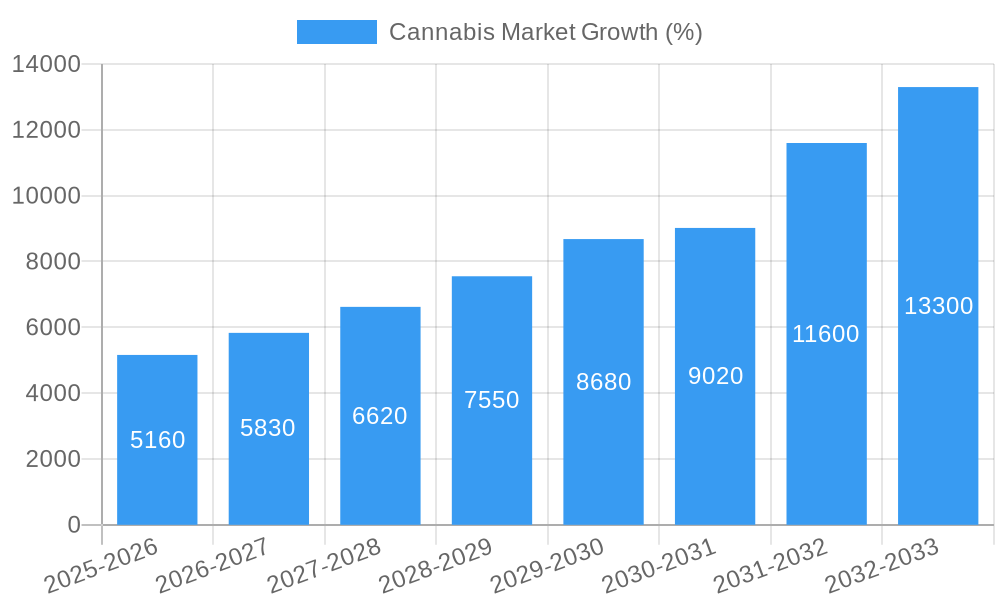
The global cannabis market is exhibiting robust growth, driven by the increasing legalization of both medical and recreational cannabis in several regions. The market size has expanded from $xx million in 2019 to an estimated $xx million in 2024, showcasing a CAGR of xx%. This growth trajectory is expected to continue, with the market projected to reach $xx million by 2033, driven by increased consumer demand, technological advancements in cultivation and product development, and the expansion of legal frameworks globally. Consumer behavior is shifting towards more sophisticated product preferences, emphasizing quality, potency, and diverse product formats. Market penetration is currently at xx% (estimated for 2024) and is expected to increase significantly in the coming years.
Dominant Regions, Countries, or Segments in Cannabis Market
North America, specifically the United States and Canada, are currently the leading regions in the cannabis market, owing to early legalization and established regulatory frameworks. Within product types, the edibles segment holds a significant share, with concentrates experiencing considerable growth due to their high potency. The recreational cannabis segment is outpacing the medical segment in terms of revenue growth due to increased consumer demand. While THC products remain dominant, the CBD segment is also experiencing substantial growth owing to its perceived health benefits and the relaxation of regulations in several regions.
- Leading Region: North America (United States and Canada)
- Key Drivers: Early legalization, established infrastructure, and robust consumer demand.
- Dominant Product Type: Edibles (xx% market share in 2024, estimated)
- Fastest Growing Segment: Concentrates (xx% CAGR, estimated 2025-2033)
- Dominant Application: Recreational (xx% market share in 2024, estimated)
- Dominant Compound Type: Tetrahydrocannabinol (THC)
Cannabis Market Product Landscape
The cannabis product landscape is rapidly evolving, with continuous innovation in product formats, delivery methods, and formulations. New product innovations include infused beverages, topicals, and vape pens, catering to diverse consumer preferences. Technological advancements in extraction and processing techniques are leading to higher quality, more consistent, and safer products. Companies are increasingly focusing on unique selling propositions such as specific terpene profiles, unique flavor combinations, and targeted effects to differentiate their offerings.
Key Drivers, Barriers & Challenges in Cannabis Market
Key Drivers:
- Increased legalization and regulatory acceptance.
- Growing consumer awareness of medicinal and recreational benefits.
- Technological advancements in cultivation and processing.
- Expanding global market opportunities.
Key Challenges:
- Stringent regulatory frameworks and varying legal landscapes globally.
- Supply chain complexities and potential for shortages.
- Intense competition among established and emerging players.
- Potential for illicit market competition.
- Concerns regarding public health and safety.
Emerging Opportunities in Cannabis Market
- Expansion into new international markets.
- Development of innovative product formats and delivery systems.
- Growing interest in cannabis-based pharmaceuticals and therapeutics.
- Increased demand for CBD-infused products for wellness and self-care.
- Opportunities in personalized medicine and targeted therapies.
Growth Accelerators in the Cannabis Market Industry
Long-term growth in the cannabis market is fueled by continued legalization efforts worldwide, technological innovation driving efficiency and product quality, strategic partnerships expanding market reach and distribution, and consistent consumer demand across various demographics and preferences. The industry's commitment to research and development will also play a crucial role in unlocking new therapeutic applications and expanding market potential.
Key Players Shaping the Cannabis Market Market
- Delta 9 Cannabis
- Canopy Growth Corp
- Vivo Cannabis
- Cannimed Therapeutics Inc
- GW Pharmaceuticals PLC
- Aphria Inc
- Tilray
- CV Sciences Inc
- MedReLeaf Corp
- Aurora Cannabis Inc
Notable Milestones in Cannabis Market Sector
- May 2023: Toast and Nirvana Group partnered to introduce innovative products in Oklahoma and New Mexico.
- April 2023: Hello Juice and Smoothie partnered with Beleaf Co. to launch CBD-infused juice shots.
- May 2022: Canopy Growth launched new flavors of cannabis-infused carbonated drinks.
In-Depth Cannabis Market Market Outlook
The cannabis market is poised for continued significant growth over the next decade, driven by sustained legalization efforts, rising consumer acceptance, and ongoing innovation in product development. Strategic partnerships and investments in research and development will further accelerate market expansion and create numerous opportunities for industry players. The market's evolution will be shaped by consumer preferences for higher-quality, specialized products, as well as ongoing regulatory adjustments that ensure consumer safety and responsible market development.
Cannabis Market Segmentation
- 1. Production Analysis
- 2. Consumption Analysis
- 3. Import Market Analysis (Value & Volume)
- 4. Export Market Analysis (Value & Volume)
- 5. Price Trend Analysis
Cannabis Market Segmentation By Geography
-
1. North America
- 1.1. United States
- 1.2. Canada
- 1.3. Mexico
-
2. South America
- 2.1. Brazil
- 2.2. Argentina
- 2.3. Rest of South America
-
3. Europe
- 3.1. United Kingdom
- 3.2. Germany
- 3.3. France
- 3.4. Italy
- 3.5. Spain
- 3.6. Russia
- 3.7. Benelux
- 3.8. Nordics
- 3.9. Rest of Europe
-
4. Middle East & Africa
- 4.1. Turkey
- 4.2. Israel
- 4.3. GCC
- 4.4. North Africa
- 4.5. South Africa
- 4.6. Rest of Middle East & Africa
-
5. Asia Pacific
- 5.1. China
- 5.2. India
- 5.3. Japan
- 5.4. South Korea
- 5.5. ASEAN
- 5.6. Oceania
- 5.7. Rest of Asia Pacific
Cannabis Market REPORT HIGHLIGHTS
| Aspects | Details |
|---|---|
| Study Period | 2019-2033 |
| Base Year | 2024 |
| Estimated Year | 2025 |
| Forecast Period | 2025-2033 |
| Historical Period | 2019-2024 |
| Growth Rate | CAGR of 15.40% from 2019-2033 |
| Segmentation |
|
Table of Contents
- 1. Introduction
- 1.1. Research Scope
- 1.2. Market Segmentation
- 1.3. Research Methodology
- 1.4. Definitions and Assumptions
- 2. Executive Summary
- 2.1. Introduction
- 3. Market Dynamics
- 3.1. Introduction
- 3.2. Market Drivers
- 3.2.1. Increasing Legalization of Cannabis; Growing Focus on Health Benefits of Cannabis
- 3.3. Market Restrains
- 3.3.1. Lack of Data on Dosages and Results; Lack of Access to Financial Assistance
- 3.4. Market Trends
- 3.4.1. Legalization of Cannabis
- 4. Market Factor Analysis
- 4.1. Porters Five Forces
- 4.2. Supply/Value Chain
- 4.3. PESTEL analysis
- 4.4. Market Entropy
- 4.5. Patent/Trademark Analysis
- 5. Global Cannabis Market Analysis, Insights and Forecast, 2019-2031
- 5.1. Market Analysis, Insights and Forecast - by Production Analysis
- 5.2. Market Analysis, Insights and Forecast - by Consumption Analysis
- 5.3. Market Analysis, Insights and Forecast - by Import Market Analysis (Value & Volume)
- 5.4. Market Analysis, Insights and Forecast - by Export Market Analysis (Value & Volume)
- 5.5. Market Analysis, Insights and Forecast - by Price Trend Analysis
- 5.6. Market Analysis, Insights and Forecast - by Region
- 5.6.1. North America
- 5.6.2. South America
- 5.6.3. Europe
- 5.6.4. Middle East & Africa
- 5.6.5. Asia Pacific
- 5.1. Market Analysis, Insights and Forecast - by Production Analysis
- 6. North America Cannabis Market Analysis, Insights and Forecast, 2019-2031
- 6.1. Market Analysis, Insights and Forecast - by Production Analysis
- 6.2. Market Analysis, Insights and Forecast - by Consumption Analysis
- 6.3. Market Analysis, Insights and Forecast - by Import Market Analysis (Value & Volume)
- 6.4. Market Analysis, Insights and Forecast - by Export Market Analysis (Value & Volume)
- 6.5. Market Analysis, Insights and Forecast - by Price Trend Analysis
- 6.1. Market Analysis, Insights and Forecast - by Production Analysis
- 7. South America Cannabis Market Analysis, Insights and Forecast, 2019-2031
- 7.1. Market Analysis, Insights and Forecast - by Production Analysis
- 7.2. Market Analysis, Insights and Forecast - by Consumption Analysis
- 7.3. Market Analysis, Insights and Forecast - by Import Market Analysis (Value & Volume)
- 7.4. Market Analysis, Insights and Forecast - by Export Market Analysis (Value & Volume)
- 7.5. Market Analysis, Insights and Forecast - by Price Trend Analysis
- 7.1. Market Analysis, Insights and Forecast - by Production Analysis
- 8. Europe Cannabis Market Analysis, Insights and Forecast, 2019-2031
- 8.1. Market Analysis, Insights and Forecast - by Production Analysis
- 8.2. Market Analysis, Insights and Forecast - by Consumption Analysis
- 8.3. Market Analysis, Insights and Forecast - by Import Market Analysis (Value & Volume)
- 8.4. Market Analysis, Insights and Forecast - by Export Market Analysis (Value & Volume)
- 8.5. Market Analysis, Insights and Forecast - by Price Trend Analysis
- 8.1. Market Analysis, Insights and Forecast - by Production Analysis
- 9. Middle East & Africa Cannabis Market Analysis, Insights and Forecast, 2019-2031
- 9.1. Market Analysis, Insights and Forecast - by Production Analysis
- 9.2. Market Analysis, Insights and Forecast - by Consumption Analysis
- 9.3. Market Analysis, Insights and Forecast - by Import Market Analysis (Value & Volume)
- 9.4. Market Analysis, Insights and Forecast - by Export Market Analysis (Value & Volume)
- 9.5. Market Analysis, Insights and Forecast - by Price Trend Analysis
- 9.1. Market Analysis, Insights and Forecast - by Production Analysis
- 10. Asia Pacific Cannabis Market Analysis, Insights and Forecast, 2019-2031
- 10.1. Market Analysis, Insights and Forecast - by Production Analysis
- 10.2. Market Analysis, Insights and Forecast - by Consumption Analysis
- 10.3. Market Analysis, Insights and Forecast - by Import Market Analysis (Value & Volume)
- 10.4. Market Analysis, Insights and Forecast - by Export Market Analysis (Value & Volume)
- 10.5. Market Analysis, Insights and Forecast - by Price Trend Analysis
- 10.1. Market Analysis, Insights and Forecast - by Production Analysis
- 11. North America Cannabis Market Analysis, Insights and Forecast, 2019-2031
- 11.1. Market Analysis, Insights and Forecast - By Country/Sub-region
- 11.1.1 United States
- 11.1.2 Canada
- 11.1.3 Mexico
- 12. Europe Cannabis Market Analysis, Insights and Forecast, 2019-2031
- 12.1. Market Analysis, Insights and Forecast - By Country/Sub-region
- 12.1.1 Germany
- 12.1.2 United Kingdom
- 12.1.3 France
- 12.1.4 Spain
- 12.1.5 Italy
- 12.1.6 Spain
- 12.1.7 Belgium
- 12.1.8 Netherland
- 12.1.9 Nordics
- 12.1.10 Rest of Europe
- 13. Asia Pacific Cannabis Market Analysis, Insights and Forecast, 2019-2031
- 13.1. Market Analysis, Insights and Forecast - By Country/Sub-region
- 13.1.1 China
- 13.1.2 Japan
- 13.1.3 India
- 13.1.4 South Korea
- 13.1.5 Southeast Asia
- 13.1.6 Australia
- 13.1.7 Indonesia
- 13.1.8 Phillipes
- 13.1.9 Singapore
- 13.1.10 Thailandc
- 13.1.11 Rest of Asia Pacific
- 14. South America Cannabis Market Analysis, Insights and Forecast, 2019-2031
- 14.1. Market Analysis, Insights and Forecast - By Country/Sub-region
- 14.1.1 Brazil
- 14.1.2 Argentina
- 14.1.3 Peru
- 14.1.4 Chile
- 14.1.5 Colombia
- 14.1.6 Ecuador
- 14.1.7 Venezuela
- 14.1.8 Rest of South America
- 15. MEA Cannabis Market Analysis, Insights and Forecast, 2019-2031
- 15.1. Market Analysis, Insights and Forecast - By Country/Sub-region
- 15.1.1 United Arab Emirates
- 15.1.2 Saudi Arabia
- 15.1.3 South Africa
- 15.1.4 Rest of Middle East and Africa
- 16. Competitive Analysis
- 16.1. Global Market Share Analysis 2024
- 16.2. Company Profiles
- 16.2.1 Delta 9 Cannabis
- 16.2.1.1. Overview
- 16.2.1.2. Products
- 16.2.1.3. SWOT Analysis
- 16.2.1.4. Recent Developments
- 16.2.1.5. Financials (Based on Availability)
- 16.2.2 Canopy Growth Corp
- 16.2.2.1. Overview
- 16.2.2.2. Products
- 16.2.2.3. SWOT Analysis
- 16.2.2.4. Recent Developments
- 16.2.2.5. Financials (Based on Availability)
- 16.2.3 Vivo Cannabis*List Not Exhaustive
- 16.2.3.1. Overview
- 16.2.3.2. Products
- 16.2.3.3. SWOT Analysis
- 16.2.3.4. Recent Developments
- 16.2.3.5. Financials (Based on Availability)
- 16.2.4 Cannimed Therapeutics Inc
- 16.2.4.1. Overview
- 16.2.4.2. Products
- 16.2.4.3. SWOT Analysis
- 16.2.4.4. Recent Developments
- 16.2.4.5. Financials (Based on Availability)
- 16.2.5 GW Pharmaceuticals PLC
- 16.2.5.1. Overview
- 16.2.5.2. Products
- 16.2.5.3. SWOT Analysis
- 16.2.5.4. Recent Developments
- 16.2.5.5. Financials (Based on Availability)
- 16.2.6 Aphria Inc
- 16.2.6.1. Overview
- 16.2.6.2. Products
- 16.2.6.3. SWOT Analysis
- 16.2.6.4. Recent Developments
- 16.2.6.5. Financials (Based on Availability)
- 16.2.7 Tilray
- 16.2.7.1. Overview
- 16.2.7.2. Products
- 16.2.7.3. SWOT Analysis
- 16.2.7.4. Recent Developments
- 16.2.7.5. Financials (Based on Availability)
- 16.2.8 CV Sciences Inc
- 16.2.8.1. Overview
- 16.2.8.2. Products
- 16.2.8.3. SWOT Analysis
- 16.2.8.4. Recent Developments
- 16.2.8.5. Financials (Based on Availability)
- 16.2.9 MedReLeaf Corp
- 16.2.9.1. Overview
- 16.2.9.2. Products
- 16.2.9.3. SWOT Analysis
- 16.2.9.4. Recent Developments
- 16.2.9.5. Financials (Based on Availability)
- 16.2.10 Aurora Cannabis Inc
- 16.2.10.1. Overview
- 16.2.10.2. Products
- 16.2.10.3. SWOT Analysis
- 16.2.10.4. Recent Developments
- 16.2.10.5. Financials (Based on Availability)
- 16.2.1 Delta 9 Cannabis
List of Figures
- Figure 1: Global Cannabis Market Revenue Breakdown (Million, %) by Region 2024 & 2032
- Figure 2: Global Cannabis Market Volume Breakdown (Kiloton, %) by Region 2024 & 2032
- Figure 3: North America Cannabis Market Revenue (Million), by Country 2024 & 2032
- Figure 4: North America Cannabis Market Volume (Kiloton), by Country 2024 & 2032
- Figure 5: North America Cannabis Market Revenue Share (%), by Country 2024 & 2032
- Figure 6: North America Cannabis Market Volume Share (%), by Country 2024 & 2032
- Figure 7: Europe Cannabis Market Revenue (Million), by Country 2024 & 2032
- Figure 8: Europe Cannabis Market Volume (Kiloton), by Country 2024 & 2032
- Figure 9: Europe Cannabis Market Revenue Share (%), by Country 2024 & 2032
- Figure 10: Europe Cannabis Market Volume Share (%), by Country 2024 & 2032
- Figure 11: Asia Pacific Cannabis Market Revenue (Million), by Country 2024 & 2032
- Figure 12: Asia Pacific Cannabis Market Volume (Kiloton), by Country 2024 & 2032
- Figure 13: Asia Pacific Cannabis Market Revenue Share (%), by Country 2024 & 2032
- Figure 14: Asia Pacific Cannabis Market Volume Share (%), by Country 2024 & 2032
- Figure 15: South America Cannabis Market Revenue (Million), by Country 2024 & 2032
- Figure 16: South America Cannabis Market Volume (Kiloton), by Country 2024 & 2032
- Figure 17: South America Cannabis Market Revenue Share (%), by Country 2024 & 2032
- Figure 18: South America Cannabis Market Volume Share (%), by Country 2024 & 2032
- Figure 19: MEA Cannabis Market Revenue (Million), by Country 2024 & 2032
- Figure 20: MEA Cannabis Market Volume (Kiloton), by Country 2024 & 2032
- Figure 21: MEA Cannabis Market Revenue Share (%), by Country 2024 & 2032
- Figure 22: MEA Cannabis Market Volume Share (%), by Country 2024 & 2032
- Figure 23: North America Cannabis Market Revenue (Million), by Production Analysis 2024 & 2032
- Figure 24: North America Cannabis Market Volume (Kiloton), by Production Analysis 2024 & 2032
- Figure 25: North America Cannabis Market Revenue Share (%), by Production Analysis 2024 & 2032
- Figure 26: North America Cannabis Market Volume Share (%), by Production Analysis 2024 & 2032
- Figure 27: North America Cannabis Market Revenue (Million), by Consumption Analysis 2024 & 2032
- Figure 28: North America Cannabis Market Volume (Kiloton), by Consumption Analysis 2024 & 2032
- Figure 29: North America Cannabis Market Revenue Share (%), by Consumption Analysis 2024 & 2032
- Figure 30: North America Cannabis Market Volume Share (%), by Consumption Analysis 2024 & 2032
- Figure 31: North America Cannabis Market Revenue (Million), by Import Market Analysis (Value & Volume) 2024 & 2032
- Figure 32: North America Cannabis Market Volume (Kiloton), by Import Market Analysis (Value & Volume) 2024 & 2032
- Figure 33: North America Cannabis Market Revenue Share (%), by Import Market Analysis (Value & Volume) 2024 & 2032
- Figure 34: North America Cannabis Market Volume Share (%), by Import Market Analysis (Value & Volume) 2024 & 2032
- Figure 35: North America Cannabis Market Revenue (Million), by Export Market Analysis (Value & Volume) 2024 & 2032
- Figure 36: North America Cannabis Market Volume (Kiloton), by Export Market Analysis (Value & Volume) 2024 & 2032
- Figure 37: North America Cannabis Market Revenue Share (%), by Export Market Analysis (Value & Volume) 2024 & 2032
- Figure 38: North America Cannabis Market Volume Share (%), by Export Market Analysis (Value & Volume) 2024 & 2032
- Figure 39: North America Cannabis Market Revenue (Million), by Price Trend Analysis 2024 & 2032
- Figure 40: North America Cannabis Market Volume (Kiloton), by Price Trend Analysis 2024 & 2032
- Figure 41: North America Cannabis Market Revenue Share (%), by Price Trend Analysis 2024 & 2032
- Figure 42: North America Cannabis Market Volume Share (%), by Price Trend Analysis 2024 & 2032
- Figure 43: North America Cannabis Market Revenue (Million), by Country 2024 & 2032
- Figure 44: North America Cannabis Market Volume (Kiloton), by Country 2024 & 2032
- Figure 45: North America Cannabis Market Revenue Share (%), by Country 2024 & 2032
- Figure 46: North America Cannabis Market Volume Share (%), by Country 2024 & 2032
- Figure 47: South America Cannabis Market Revenue (Million), by Production Analysis 2024 & 2032
- Figure 48: South America Cannabis Market Volume (Kiloton), by Production Analysis 2024 & 2032
- Figure 49: South America Cannabis Market Revenue Share (%), by Production Analysis 2024 & 2032
- Figure 50: South America Cannabis Market Volume Share (%), by Production Analysis 2024 & 2032
- Figure 51: South America Cannabis Market Revenue (Million), by Consumption Analysis 2024 & 2032
- Figure 52: South America Cannabis Market Volume (Kiloton), by Consumption Analysis 2024 & 2032
- Figure 53: South America Cannabis Market Revenue Share (%), by Consumption Analysis 2024 & 2032
- Figure 54: South America Cannabis Market Volume Share (%), by Consumption Analysis 2024 & 2032
- Figure 55: South America Cannabis Market Revenue (Million), by Import Market Analysis (Value & Volume) 2024 & 2032
- Figure 56: South America Cannabis Market Volume (Kiloton), by Import Market Analysis (Value & Volume) 2024 & 2032
- Figure 57: South America Cannabis Market Revenue Share (%), by Import Market Analysis (Value & Volume) 2024 & 2032
- Figure 58: South America Cannabis Market Volume Share (%), by Import Market Analysis (Value & Volume) 2024 & 2032
- Figure 59: South America Cannabis Market Revenue (Million), by Export Market Analysis (Value & Volume) 2024 & 2032
- Figure 60: South America Cannabis Market Volume (Kiloton), by Export Market Analysis (Value & Volume) 2024 & 2032
- Figure 61: South America Cannabis Market Revenue Share (%), by Export Market Analysis (Value & Volume) 2024 & 2032
- Figure 62: South America Cannabis Market Volume Share (%), by Export Market Analysis (Value & Volume) 2024 & 2032
- Figure 63: South America Cannabis Market Revenue (Million), by Price Trend Analysis 2024 & 2032
- Figure 64: South America Cannabis Market Volume (Kiloton), by Price Trend Analysis 2024 & 2032
- Figure 65: South America Cannabis Market Revenue Share (%), by Price Trend Analysis 2024 & 2032
- Figure 66: South America Cannabis Market Volume Share (%), by Price Trend Analysis 2024 & 2032
- Figure 67: South America Cannabis Market Revenue (Million), by Country 2024 & 2032
- Figure 68: South America Cannabis Market Volume (Kiloton), by Country 2024 & 2032
- Figure 69: South America Cannabis Market Revenue Share (%), by Country 2024 & 2032
- Figure 70: South America Cannabis Market Volume Share (%), by Country 2024 & 2032
- Figure 71: Europe Cannabis Market Revenue (Million), by Production Analysis 2024 & 2032
- Figure 72: Europe Cannabis Market Volume (Kiloton), by Production Analysis 2024 & 2032
- Figure 73: Europe Cannabis Market Revenue Share (%), by Production Analysis 2024 & 2032
- Figure 74: Europe Cannabis Market Volume Share (%), by Production Analysis 2024 & 2032
- Figure 75: Europe Cannabis Market Revenue (Million), by Consumption Analysis 2024 & 2032
- Figure 76: Europe Cannabis Market Volume (Kiloton), by Consumption Analysis 2024 & 2032
- Figure 77: Europe Cannabis Market Revenue Share (%), by Consumption Analysis 2024 & 2032
- Figure 78: Europe Cannabis Market Volume Share (%), by Consumption Analysis 2024 & 2032
- Figure 79: Europe Cannabis Market Revenue (Million), by Import Market Analysis (Value & Volume) 2024 & 2032
- Figure 80: Europe Cannabis Market Volume (Kiloton), by Import Market Analysis (Value & Volume) 2024 & 2032
- Figure 81: Europe Cannabis Market Revenue Share (%), by Import Market Analysis (Value & Volume) 2024 & 2032
- Figure 82: Europe Cannabis Market Volume Share (%), by Import Market Analysis (Value & Volume) 2024 & 2032
- Figure 83: Europe Cannabis Market Revenue (Million), by Export Market Analysis (Value & Volume) 2024 & 2032
- Figure 84: Europe Cannabis Market Volume (Kiloton), by Export Market Analysis (Value & Volume) 2024 & 2032
- Figure 85: Europe Cannabis Market Revenue Share (%), by Export Market Analysis (Value & Volume) 2024 & 2032
- Figure 86: Europe Cannabis Market Volume Share (%), by Export Market Analysis (Value & Volume) 2024 & 2032
- Figure 87: Europe Cannabis Market Revenue (Million), by Price Trend Analysis 2024 & 2032
- Figure 88: Europe Cannabis Market Volume (Kiloton), by Price Trend Analysis 2024 & 2032
- Figure 89: Europe Cannabis Market Revenue Share (%), by Price Trend Analysis 2024 & 2032
- Figure 90: Europe Cannabis Market Volume Share (%), by Price Trend Analysis 2024 & 2032
- Figure 91: Europe Cannabis Market Revenue (Million), by Country 2024 & 2032
- Figure 92: Europe Cannabis Market Volume (Kiloton), by Country 2024 & 2032
- Figure 93: Europe Cannabis Market Revenue Share (%), by Country 2024 & 2032
- Figure 94: Europe Cannabis Market Volume Share (%), by Country 2024 & 2032
- Figure 95: Middle East & Africa Cannabis Market Revenue (Million), by Production Analysis 2024 & 2032
- Figure 96: Middle East & Africa Cannabis Market Volume (Kiloton), by Production Analysis 2024 & 2032
- Figure 97: Middle East & Africa Cannabis Market Revenue Share (%), by Production Analysis 2024 & 2032
- Figure 98: Middle East & Africa Cannabis Market Volume Share (%), by Production Analysis 2024 & 2032
- Figure 99: Middle East & Africa Cannabis Market Revenue (Million), by Consumption Analysis 2024 & 2032
- Figure 100: Middle East & Africa Cannabis Market Volume (Kiloton), by Consumption Analysis 2024 & 2032
- Figure 101: Middle East & Africa Cannabis Market Revenue Share (%), by Consumption Analysis 2024 & 2032
- Figure 102: Middle East & Africa Cannabis Market Volume Share (%), by Consumption Analysis 2024 & 2032
- Figure 103: Middle East & Africa Cannabis Market Revenue (Million), by Import Market Analysis (Value & Volume) 2024 & 2032
- Figure 104: Middle East & Africa Cannabis Market Volume (Kiloton), by Import Market Analysis (Value & Volume) 2024 & 2032
- Figure 105: Middle East & Africa Cannabis Market Revenue Share (%), by Import Market Analysis (Value & Volume) 2024 & 2032
- Figure 106: Middle East & Africa Cannabis Market Volume Share (%), by Import Market Analysis (Value & Volume) 2024 & 2032
- Figure 107: Middle East & Africa Cannabis Market Revenue (Million), by Export Market Analysis (Value & Volume) 2024 & 2032
- Figure 108: Middle East & Africa Cannabis Market Volume (Kiloton), by Export Market Analysis (Value & Volume) 2024 & 2032
- Figure 109: Middle East & Africa Cannabis Market Revenue Share (%), by Export Market Analysis (Value & Volume) 2024 & 2032
- Figure 110: Middle East & Africa Cannabis Market Volume Share (%), by Export Market Analysis (Value & Volume) 2024 & 2032
- Figure 111: Middle East & Africa Cannabis Market Revenue (Million), by Price Trend Analysis 2024 & 2032
- Figure 112: Middle East & Africa Cannabis Market Volume (Kiloton), by Price Trend Analysis 2024 & 2032
- Figure 113: Middle East & Africa Cannabis Market Revenue Share (%), by Price Trend Analysis 2024 & 2032
- Figure 114: Middle East & Africa Cannabis Market Volume Share (%), by Price Trend Analysis 2024 & 2032
- Figure 115: Middle East & Africa Cannabis Market Revenue (Million), by Country 2024 & 2032
- Figure 116: Middle East & Africa Cannabis Market Volume (Kiloton), by Country 2024 & 2032
- Figure 117: Middle East & Africa Cannabis Market Revenue Share (%), by Country 2024 & 2032
- Figure 118: Middle East & Africa Cannabis Market Volume Share (%), by Country 2024 & 2032
- Figure 119: Asia Pacific Cannabis Market Revenue (Million), by Production Analysis 2024 & 2032
- Figure 120: Asia Pacific Cannabis Market Volume (Kiloton), by Production Analysis 2024 & 2032
- Figure 121: Asia Pacific Cannabis Market Revenue Share (%), by Production Analysis 2024 & 2032
- Figure 122: Asia Pacific Cannabis Market Volume Share (%), by Production Analysis 2024 & 2032
- Figure 123: Asia Pacific Cannabis Market Revenue (Million), by Consumption Analysis 2024 & 2032
- Figure 124: Asia Pacific Cannabis Market Volume (Kiloton), by Consumption Analysis 2024 & 2032
- Figure 125: Asia Pacific Cannabis Market Revenue Share (%), by Consumption Analysis 2024 & 2032
- Figure 126: Asia Pacific Cannabis Market Volume Share (%), by Consumption Analysis 2024 & 2032
- Figure 127: Asia Pacific Cannabis Market Revenue (Million), by Import Market Analysis (Value & Volume) 2024 & 2032
- Figure 128: Asia Pacific Cannabis Market Volume (Kiloton), by Import Market Analysis (Value & Volume) 2024 & 2032
- Figure 129: Asia Pacific Cannabis Market Revenue Share (%), by Import Market Analysis (Value & Volume) 2024 & 2032
- Figure 130: Asia Pacific Cannabis Market Volume Share (%), by Import Market Analysis (Value & Volume) 2024 & 2032
- Figure 131: Asia Pacific Cannabis Market Revenue (Million), by Export Market Analysis (Value & Volume) 2024 & 2032
- Figure 132: Asia Pacific Cannabis Market Volume (Kiloton), by Export Market Analysis (Value & Volume) 2024 & 2032
- Figure 133: Asia Pacific Cannabis Market Revenue Share (%), by Export Market Analysis (Value & Volume) 2024 & 2032
- Figure 134: Asia Pacific Cannabis Market Volume Share (%), by Export Market Analysis (Value & Volume) 2024 & 2032
- Figure 135: Asia Pacific Cannabis Market Revenue (Million), by Price Trend Analysis 2024 & 2032
- Figure 136: Asia Pacific Cannabis Market Volume (Kiloton), by Price Trend Analysis 2024 & 2032
- Figure 137: Asia Pacific Cannabis Market Revenue Share (%), by Price Trend Analysis 2024 & 2032
- Figure 138: Asia Pacific Cannabis Market Volume Share (%), by Price Trend Analysis 2024 & 2032
- Figure 139: Asia Pacific Cannabis Market Revenue (Million), by Country 2024 & 2032
- Figure 140: Asia Pacific Cannabis Market Volume (Kiloton), by Country 2024 & 2032
- Figure 141: Asia Pacific Cannabis Market Revenue Share (%), by Country 2024 & 2032
- Figure 142: Asia Pacific Cannabis Market Volume Share (%), by Country 2024 & 2032
List of Tables
- Table 1: Global Cannabis Market Revenue Million Forecast, by Region 2019 & 2032
- Table 2: Global Cannabis Market Volume Kiloton Forecast, by Region 2019 & 2032
- Table 3: Global Cannabis Market Revenue Million Forecast, by Production Analysis 2019 & 2032
- Table 4: Global Cannabis Market Volume Kiloton Forecast, by Production Analysis 2019 & 2032
- Table 5: Global Cannabis Market Revenue Million Forecast, by Consumption Analysis 2019 & 2032
- Table 6: Global Cannabis Market Volume Kiloton Forecast, by Consumption Analysis 2019 & 2032
- Table 7: Global Cannabis Market Revenue Million Forecast, by Import Market Analysis (Value & Volume) 2019 & 2032
- Table 8: Global Cannabis Market Volume Kiloton Forecast, by Import Market Analysis (Value & Volume) 2019 & 2032
- Table 9: Global Cannabis Market Revenue Million Forecast, by Export Market Analysis (Value & Volume) 2019 & 2032
- Table 10: Global Cannabis Market Volume Kiloton Forecast, by Export Market Analysis (Value & Volume) 2019 & 2032
- Table 11: Global Cannabis Market Revenue Million Forecast, by Price Trend Analysis 2019 & 2032
- Table 12: Global Cannabis Market Volume Kiloton Forecast, by Price Trend Analysis 2019 & 2032
- Table 13: Global Cannabis Market Revenue Million Forecast, by Region 2019 & 2032
- Table 14: Global Cannabis Market Volume Kiloton Forecast, by Region 2019 & 2032
- Table 15: Global Cannabis Market Revenue Million Forecast, by Country 2019 & 2032
- Table 16: Global Cannabis Market Volume Kiloton Forecast, by Country 2019 & 2032
- Table 17: United States Cannabis Market Revenue (Million) Forecast, by Application 2019 & 2032
- Table 18: United States Cannabis Market Volume (Kiloton) Forecast, by Application 2019 & 2032
- Table 19: Canada Cannabis Market Revenue (Million) Forecast, by Application 2019 & 2032
- Table 20: Canada Cannabis Market Volume (Kiloton) Forecast, by Application 2019 & 2032
- Table 21: Mexico Cannabis Market Revenue (Million) Forecast, by Application 2019 & 2032
- Table 22: Mexico Cannabis Market Volume (Kiloton) Forecast, by Application 2019 & 2032
- Table 23: Global Cannabis Market Revenue Million Forecast, by Country 2019 & 2032
- Table 24: Global Cannabis Market Volume Kiloton Forecast, by Country 2019 & 2032
- Table 25: Germany Cannabis Market Revenue (Million) Forecast, by Application 2019 & 2032
- Table 26: Germany Cannabis Market Volume (Kiloton) Forecast, by Application 2019 & 2032
- Table 27: United Kingdom Cannabis Market Revenue (Million) Forecast, by Application 2019 & 2032
- Table 28: United Kingdom Cannabis Market Volume (Kiloton) Forecast, by Application 2019 & 2032
- Table 29: France Cannabis Market Revenue (Million) Forecast, by Application 2019 & 2032
- Table 30: France Cannabis Market Volume (Kiloton) Forecast, by Application 2019 & 2032
- Table 31: Spain Cannabis Market Revenue (Million) Forecast, by Application 2019 & 2032
- Table 32: Spain Cannabis Market Volume (Kiloton) Forecast, by Application 2019 & 2032
- Table 33: Italy Cannabis Market Revenue (Million) Forecast, by Application 2019 & 2032
- Table 34: Italy Cannabis Market Volume (Kiloton) Forecast, by Application 2019 & 2032
- Table 35: Spain Cannabis Market Revenue (Million) Forecast, by Application 2019 & 2032
- Table 36: Spain Cannabis Market Volume (Kiloton) Forecast, by Application 2019 & 2032
- Table 37: Belgium Cannabis Market Revenue (Million) Forecast, by Application 2019 & 2032
- Table 38: Belgium Cannabis Market Volume (Kiloton) Forecast, by Application 2019 & 2032
- Table 39: Netherland Cannabis Market Revenue (Million) Forecast, by Application 2019 & 2032
- Table 40: Netherland Cannabis Market Volume (Kiloton) Forecast, by Application 2019 & 2032
- Table 41: Nordics Cannabis Market Revenue (Million) Forecast, by Application 2019 & 2032
- Table 42: Nordics Cannabis Market Volume (Kiloton) Forecast, by Application 2019 & 2032
- Table 43: Rest of Europe Cannabis Market Revenue (Million) Forecast, by Application 2019 & 2032
- Table 44: Rest of Europe Cannabis Market Volume (Kiloton) Forecast, by Application 2019 & 2032
- Table 45: Global Cannabis Market Revenue Million Forecast, by Country 2019 & 2032
- Table 46: Global Cannabis Market Volume Kiloton Forecast, by Country 2019 & 2032
- Table 47: China Cannabis Market Revenue (Million) Forecast, by Application 2019 & 2032
- Table 48: China Cannabis Market Volume (Kiloton) Forecast, by Application 2019 & 2032
- Table 49: Japan Cannabis Market Revenue (Million) Forecast, by Application 2019 & 2032
- Table 50: Japan Cannabis Market Volume (Kiloton) Forecast, by Application 2019 & 2032
- Table 51: India Cannabis Market Revenue (Million) Forecast, by Application 2019 & 2032
- Table 52: India Cannabis Market Volume (Kiloton) Forecast, by Application 2019 & 2032
- Table 53: South Korea Cannabis Market Revenue (Million) Forecast, by Application 2019 & 2032
- Table 54: South Korea Cannabis Market Volume (Kiloton) Forecast, by Application 2019 & 2032
- Table 55: Southeast Asia Cannabis Market Revenue (Million) Forecast, by Application 2019 & 2032
- Table 56: Southeast Asia Cannabis Market Volume (Kiloton) Forecast, by Application 2019 & 2032
- Table 57: Australia Cannabis Market Revenue (Million) Forecast, by Application 2019 & 2032
- Table 58: Australia Cannabis Market Volume (Kiloton) Forecast, by Application 2019 & 2032
- Table 59: Indonesia Cannabis Market Revenue (Million) Forecast, by Application 2019 & 2032
- Table 60: Indonesia Cannabis Market Volume (Kiloton) Forecast, by Application 2019 & 2032
- Table 61: Phillipes Cannabis Market Revenue (Million) Forecast, by Application 2019 & 2032
- Table 62: Phillipes Cannabis Market Volume (Kiloton) Forecast, by Application 2019 & 2032
- Table 63: Singapore Cannabis Market Revenue (Million) Forecast, by Application 2019 & 2032
- Table 64: Singapore Cannabis Market Volume (Kiloton) Forecast, by Application 2019 & 2032
- Table 65: Thailandc Cannabis Market Revenue (Million) Forecast, by Application 2019 & 2032
- Table 66: Thailandc Cannabis Market Volume (Kiloton) Forecast, by Application 2019 & 2032
- Table 67: Rest of Asia Pacific Cannabis Market Revenue (Million) Forecast, by Application 2019 & 2032
- Table 68: Rest of Asia Pacific Cannabis Market Volume (Kiloton) Forecast, by Application 2019 & 2032
- Table 69: Global Cannabis Market Revenue Million Forecast, by Country 2019 & 2032
- Table 70: Global Cannabis Market Volume Kiloton Forecast, by Country 2019 & 2032
- Table 71: Brazil Cannabis Market Revenue (Million) Forecast, by Application 2019 & 2032
- Table 72: Brazil Cannabis Market Volume (Kiloton) Forecast, by Application 2019 & 2032
- Table 73: Argentina Cannabis Market Revenue (Million) Forecast, by Application 2019 & 2032
- Table 74: Argentina Cannabis Market Volume (Kiloton) Forecast, by Application 2019 & 2032
- Table 75: Peru Cannabis Market Revenue (Million) Forecast, by Application 2019 & 2032
- Table 76: Peru Cannabis Market Volume (Kiloton) Forecast, by Application 2019 & 2032
- Table 77: Chile Cannabis Market Revenue (Million) Forecast, by Application 2019 & 2032
- Table 78: Chile Cannabis Market Volume (Kiloton) Forecast, by Application 2019 & 2032
- Table 79: Colombia Cannabis Market Revenue (Million) Forecast, by Application 2019 & 2032
- Table 80: Colombia Cannabis Market Volume (Kiloton) Forecast, by Application 2019 & 2032
- Table 81: Ecuador Cannabis Market Revenue (Million) Forecast, by Application 2019 & 2032
- Table 82: Ecuador Cannabis Market Volume (Kiloton) Forecast, by Application 2019 & 2032
- Table 83: Venezuela Cannabis Market Revenue (Million) Forecast, by Application 2019 & 2032
- Table 84: Venezuela Cannabis Market Volume (Kiloton) Forecast, by Application 2019 & 2032
- Table 85: Rest of South America Cannabis Market Revenue (Million) Forecast, by Application 2019 & 2032
- Table 86: Rest of South America Cannabis Market Volume (Kiloton) Forecast, by Application 2019 & 2032
- Table 87: Global Cannabis Market Revenue Million Forecast, by Country 2019 & 2032
- Table 88: Global Cannabis Market Volume Kiloton Forecast, by Country 2019 & 2032
- Table 89: United Arab Emirates Cannabis Market Revenue (Million) Forecast, by Application 2019 & 2032
- Table 90: United Arab Emirates Cannabis Market Volume (Kiloton) Forecast, by Application 2019 & 2032
- Table 91: Saudi Arabia Cannabis Market Revenue (Million) Forecast, by Application 2019 & 2032
- Table 92: Saudi Arabia Cannabis Market Volume (Kiloton) Forecast, by Application 2019 & 2032
- Table 93: South Africa Cannabis Market Revenue (Million) Forecast, by Application 2019 & 2032
- Table 94: South Africa Cannabis Market Volume (Kiloton) Forecast, by Application 2019 & 2032
- Table 95: Rest of Middle East and Africa Cannabis Market Revenue (Million) Forecast, by Application 2019 & 2032
- Table 96: Rest of Middle East and Africa Cannabis Market Volume (Kiloton) Forecast, by Application 2019 & 2032
- Table 97: Global Cannabis Market Revenue Million Forecast, by Production Analysis 2019 & 2032
- Table 98: Global Cannabis Market Volume Kiloton Forecast, by Production Analysis 2019 & 2032
- Table 99: Global Cannabis Market Revenue Million Forecast, by Consumption Analysis 2019 & 2032
- Table 100: Global Cannabis Market Volume Kiloton Forecast, by Consumption Analysis 2019 & 2032
- Table 101: Global Cannabis Market Revenue Million Forecast, by Import Market Analysis (Value & Volume) 2019 & 2032
- Table 102: Global Cannabis Market Volume Kiloton Forecast, by Import Market Analysis (Value & Volume) 2019 & 2032
- Table 103: Global Cannabis Market Revenue Million Forecast, by Export Market Analysis (Value & Volume) 2019 & 2032
- Table 104: Global Cannabis Market Volume Kiloton Forecast, by Export Market Analysis (Value & Volume) 2019 & 2032
- Table 105: Global Cannabis Market Revenue Million Forecast, by Price Trend Analysis 2019 & 2032
- Table 106: Global Cannabis Market Volume Kiloton Forecast, by Price Trend Analysis 2019 & 2032
- Table 107: Global Cannabis Market Revenue Million Forecast, by Country 2019 & 2032
- Table 108: Global Cannabis Market Volume Kiloton Forecast, by Country 2019 & 2032
- Table 109: United States Cannabis Market Revenue (Million) Forecast, by Application 2019 & 2032
- Table 110: United States Cannabis Market Volume (Kiloton) Forecast, by Application 2019 & 2032
- Table 111: Canada Cannabis Market Revenue (Million) Forecast, by Application 2019 & 2032
- Table 112: Canada Cannabis Market Volume (Kiloton) Forecast, by Application 2019 & 2032
- Table 113: Mexico Cannabis Market Revenue (Million) Forecast, by Application 2019 & 2032
- Table 114: Mexico Cannabis Market Volume (Kiloton) Forecast, by Application 2019 & 2032
- Table 115: Global Cannabis Market Revenue Million Forecast, by Production Analysis 2019 & 2032
- Table 116: Global Cannabis Market Volume Kiloton Forecast, by Production Analysis 2019 & 2032
- Table 117: Global Cannabis Market Revenue Million Forecast, by Consumption Analysis 2019 & 2032
- Table 118: Global Cannabis Market Volume Kiloton Forecast, by Consumption Analysis 2019 & 2032
- Table 119: Global Cannabis Market Revenue Million Forecast, by Import Market Analysis (Value & Volume) 2019 & 2032
- Table 120: Global Cannabis Market Volume Kiloton Forecast, by Import Market Analysis (Value & Volume) 2019 & 2032
- Table 121: Global Cannabis Market Revenue Million Forecast, by Export Market Analysis (Value & Volume) 2019 & 2032
- Table 122: Global Cannabis Market Volume Kiloton Forecast, by Export Market Analysis (Value & Volume) 2019 & 2032
- Table 123: Global Cannabis Market Revenue Million Forecast, by Price Trend Analysis 2019 & 2032
- Table 124: Global Cannabis Market Volume Kiloton Forecast, by Price Trend Analysis 2019 & 2032
- Table 125: Global Cannabis Market Revenue Million Forecast, by Country 2019 & 2032
- Table 126: Global Cannabis Market Volume Kiloton Forecast, by Country 2019 & 2032
- Table 127: Brazil Cannabis Market Revenue (Million) Forecast, by Application 2019 & 2032
- Table 128: Brazil Cannabis Market Volume (Kiloton) Forecast, by Application 2019 & 2032
- Table 129: Argentina Cannabis Market Revenue (Million) Forecast, by Application 2019 & 2032
- Table 130: Argentina Cannabis Market Volume (Kiloton) Forecast, by Application 2019 & 2032
- Table 131: Rest of South America Cannabis Market Revenue (Million) Forecast, by Application 2019 & 2032
- Table 132: Rest of South America Cannabis Market Volume (Kiloton) Forecast, by Application 2019 & 2032
- Table 133: Global Cannabis Market Revenue Million Forecast, by Production Analysis 2019 & 2032
- Table 134: Global Cannabis Market Volume Kiloton Forecast, by Production Analysis 2019 & 2032
- Table 135: Global Cannabis Market Revenue Million Forecast, by Consumption Analysis 2019 & 2032
- Table 136: Global Cannabis Market Volume Kiloton Forecast, by Consumption Analysis 2019 & 2032
- Table 137: Global Cannabis Market Revenue Million Forecast, by Import Market Analysis (Value & Volume) 2019 & 2032
- Table 138: Global Cannabis Market Volume Kiloton Forecast, by Import Market Analysis (Value & Volume) 2019 & 2032
- Table 139: Global Cannabis Market Revenue Million Forecast, by Export Market Analysis (Value & Volume) 2019 & 2032
- Table 140: Global Cannabis Market Volume Kiloton Forecast, by Export Market Analysis (Value & Volume) 2019 & 2032
- Table 141: Global Cannabis Market Revenue Million Forecast, by Price Trend Analysis 2019 & 2032
- Table 142: Global Cannabis Market Volume Kiloton Forecast, by Price Trend Analysis 2019 & 2032
- Table 143: Global Cannabis Market Revenue Million Forecast, by Country 2019 & 2032
- Table 144: Global Cannabis Market Volume Kiloton Forecast, by Country 2019 & 2032
- Table 145: United Kingdom Cannabis Market Revenue (Million) Forecast, by Application 2019 & 2032
- Table 146: United Kingdom Cannabis Market Volume (Kiloton) Forecast, by Application 2019 & 2032
- Table 147: Germany Cannabis Market Revenue (Million) Forecast, by Application 2019 & 2032
- Table 148: Germany Cannabis Market Volume (Kiloton) Forecast, by Application 2019 & 2032
- Table 149: France Cannabis Market Revenue (Million) Forecast, by Application 2019 & 2032
- Table 150: France Cannabis Market Volume (Kiloton) Forecast, by Application 2019 & 2032
- Table 151: Italy Cannabis Market Revenue (Million) Forecast, by Application 2019 & 2032
- Table 152: Italy Cannabis Market Volume (Kiloton) Forecast, by Application 2019 & 2032
- Table 153: Spain Cannabis Market Revenue (Million) Forecast, by Application 2019 & 2032
- Table 154: Spain Cannabis Market Volume (Kiloton) Forecast, by Application 2019 & 2032
- Table 155: Russia Cannabis Market Revenue (Million) Forecast, by Application 2019 & 2032
- Table 156: Russia Cannabis Market Volume (Kiloton) Forecast, by Application 2019 & 2032
- Table 157: Benelux Cannabis Market Revenue (Million) Forecast, by Application 2019 & 2032
- Table 158: Benelux Cannabis Market Volume (Kiloton) Forecast, by Application 2019 & 2032
- Table 159: Nordics Cannabis Market Revenue (Million) Forecast, by Application 2019 & 2032
- Table 160: Nordics Cannabis Market Volume (Kiloton) Forecast, by Application 2019 & 2032
- Table 161: Rest of Europe Cannabis Market Revenue (Million) Forecast, by Application 2019 & 2032
- Table 162: Rest of Europe Cannabis Market Volume (Kiloton) Forecast, by Application 2019 & 2032
- Table 163: Global Cannabis Market Revenue Million Forecast, by Production Analysis 2019 & 2032
- Table 164: Global Cannabis Market Volume Kiloton Forecast, by Production Analysis 2019 & 2032
- Table 165: Global Cannabis Market Revenue Million Forecast, by Consumption Analysis 2019 & 2032
- Table 166: Global Cannabis Market Volume Kiloton Forecast, by Consumption Analysis 2019 & 2032
- Table 167: Global Cannabis Market Revenue Million Forecast, by Import Market Analysis (Value & Volume) 2019 & 2032
- Table 168: Global Cannabis Market Volume Kiloton Forecast, by Import Market Analysis (Value & Volume) 2019 & 2032
- Table 169: Global Cannabis Market Revenue Million Forecast, by Export Market Analysis (Value & Volume) 2019 & 2032
- Table 170: Global Cannabis Market Volume Kiloton Forecast, by Export Market Analysis (Value & Volume) 2019 & 2032
- Table 171: Global Cannabis Market Revenue Million Forecast, by Price Trend Analysis 2019 & 2032
- Table 172: Global Cannabis Market Volume Kiloton Forecast, by Price Trend Analysis 2019 & 2032
- Table 173: Global Cannabis Market Revenue Million Forecast, by Country 2019 & 2032
- Table 174: Global Cannabis Market Volume Kiloton Forecast, by Country 2019 & 2032
- Table 175: Turkey Cannabis Market Revenue (Million) Forecast, by Application 2019 & 2032
- Table 176: Turkey Cannabis Market Volume (Kiloton) Forecast, by Application 2019 & 2032
- Table 177: Israel Cannabis Market Revenue (Million) Forecast, by Application 2019 & 2032
- Table 178: Israel Cannabis Market Volume (Kiloton) Forecast, by Application 2019 & 2032
- Table 179: GCC Cannabis Market Revenue (Million) Forecast, by Application 2019 & 2032
- Table 180: GCC Cannabis Market Volume (Kiloton) Forecast, by Application 2019 & 2032
- Table 181: North Africa Cannabis Market Revenue (Million) Forecast, by Application 2019 & 2032
- Table 182: North Africa Cannabis Market Volume (Kiloton) Forecast, by Application 2019 & 2032
- Table 183: South Africa Cannabis Market Revenue (Million) Forecast, by Application 2019 & 2032
- Table 184: South Africa Cannabis Market Volume (Kiloton) Forecast, by Application 2019 & 2032
- Table 185: Rest of Middle East & Africa Cannabis Market Revenue (Million) Forecast, by Application 2019 & 2032
- Table 186: Rest of Middle East & Africa Cannabis Market Volume (Kiloton) Forecast, by Application 2019 & 2032
- Table 187: Global Cannabis Market Revenue Million Forecast, by Production Analysis 2019 & 2032
- Table 188: Global Cannabis Market Volume Kiloton Forecast, by Production Analysis 2019 & 2032
- Table 189: Global Cannabis Market Revenue Million Forecast, by Consumption Analysis 2019 & 2032
- Table 190: Global Cannabis Market Volume Kiloton Forecast, by Consumption Analysis 2019 & 2032
- Table 191: Global Cannabis Market Revenue Million Forecast, by Import Market Analysis (Value & Volume) 2019 & 2032
- Table 192: Global Cannabis Market Volume Kiloton Forecast, by Import Market Analysis (Value & Volume) 2019 & 2032
- Table 193: Global Cannabis Market Revenue Million Forecast, by Export Market Analysis (Value & Volume) 2019 & 2032
- Table 194: Global Cannabis Market Volume Kiloton Forecast, by Export Market Analysis (Value & Volume) 2019 & 2032
- Table 195: Global Cannabis Market Revenue Million Forecast, by Price Trend Analysis 2019 & 2032
- Table 196: Global Cannabis Market Volume Kiloton Forecast, by Price Trend Analysis 2019 & 2032
- Table 197: Global Cannabis Market Revenue Million Forecast, by Country 2019 & 2032
- Table 198: Global Cannabis Market Volume Kiloton Forecast, by Country 2019 & 2032
- Table 199: China Cannabis Market Revenue (Million) Forecast, by Application 2019 & 2032
- Table 200: China Cannabis Market Volume (Kiloton) Forecast, by Application 2019 & 2032
- Table 201: India Cannabis Market Revenue (Million) Forecast, by Application 2019 & 2032
- Table 202: India Cannabis Market Volume (Kiloton) Forecast, by Application 2019 & 2032
- Table 203: Japan Cannabis Market Revenue (Million) Forecast, by Application 2019 & 2032
- Table 204: Japan Cannabis Market Volume (Kiloton) Forecast, by Application 2019 & 2032
- Table 205: South Korea Cannabis Market Revenue (Million) Forecast, by Application 2019 & 2032
- Table 206: South Korea Cannabis Market Volume (Kiloton) Forecast, by Application 2019 & 2032
- Table 207: ASEAN Cannabis Market Revenue (Million) Forecast, by Application 2019 & 2032
- Table 208: ASEAN Cannabis Market Volume (Kiloton) Forecast, by Application 2019 & 2032
- Table 209: Oceania Cannabis Market Revenue (Million) Forecast, by Application 2019 & 2032
- Table 210: Oceania Cannabis Market Volume (Kiloton) Forecast, by Application 2019 & 2032
- Table 211: Rest of Asia Pacific Cannabis Market Revenue (Million) Forecast, by Application 2019 & 2032
- Table 212: Rest of Asia Pacific Cannabis Market Volume (Kiloton) Forecast, by Application 2019 & 2032
Frequently Asked Questions
1. What is the projected Compound Annual Growth Rate (CAGR) of the Cannabis Market?
The projected CAGR is approximately 15.40%.
2. Which companies are prominent players in the Cannabis Market?
Key companies in the market include Delta 9 Cannabis, Canopy Growth Corp, Vivo Cannabis*List Not Exhaustive, Cannimed Therapeutics Inc, GW Pharmaceuticals PLC, Aphria Inc, Tilray, CV Sciences Inc, MedReLeaf Corp, Aurora Cannabis Inc.
3. What are the main segments of the Cannabis Market?
The market segments include Production Analysis, Consumption Analysis, Import Market Analysis (Value & Volume), Export Market Analysis (Value & Volume), Price Trend Analysis.
4. Can you provide details about the market size?
The market size is estimated to be USD 33.84 Million as of 2022.
5. What are some drivers contributing to market growth?
Increasing Legalization of Cannabis; Growing Focus on Health Benefits of Cannabis.
6. What are the notable trends driving market growth?
Legalization of Cannabis.
7. Are there any restraints impacting market growth?
Lack of Data on Dosages and Results; Lack of Access to Financial Assistance.
8. Can you provide examples of recent developments in the market?
May 2023: Toast and Nirvana Group formed a partnership to introduce innovative products for patients and consumers in Oklahoma and New Mexico.
9. What pricing options are available for accessing the report?
Pricing options include single-user, multi-user, and enterprise licenses priced at USD 4750, USD 5250, and USD 8750 respectively.
10. Is the market size provided in terms of value or volume?
The market size is provided in terms of value, measured in Million and volume, measured in Kiloton.
11. Are there any specific market keywords associated with the report?
Yes, the market keyword associated with the report is "Cannabis Market," which aids in identifying and referencing the specific market segment covered.
12. How do I determine which pricing option suits my needs best?
The pricing options vary based on user requirements and access needs. Individual users may opt for single-user licenses, while businesses requiring broader access may choose multi-user or enterprise licenses for cost-effective access to the report.
13. Are there any additional resources or data provided in the Cannabis Market report?
While the report offers comprehensive insights, it's advisable to review the specific contents or supplementary materials provided to ascertain if additional resources or data are available.
14. How can I stay updated on further developments or reports in the Cannabis Market?
To stay informed about further developments, trends, and reports in the Cannabis Market, consider subscribing to industry newsletters, following relevant companies and organizations, or regularly checking reputable industry news sources and publications.
Methodology
Step 1 - Identification of Relevant Samples Size from Population Database


Step 2 - Approaches for Defining Global Market Size (Value, Volume* & Price*)

Note*: In applicable scenarios
Step 3 - Data Sources
Primary Research
- Web Analytics
- Survey Reports
- Research Institute
- Latest Research Reports
- Opinion Leaders
Secondary Research
- Annual Reports
- White Paper
- Latest Press Release
- Industry Association
- Paid Database
- Investor Presentations

Step 4 - Data Triangulation
Involves using different sources of information in order to increase the validity of a study
These sources are likely to be stakeholders in a program - participants, other researchers, program staff, other community members, and so on.
Then we put all data in single framework & apply various statistical tools to find out the dynamic on the market.
During the analysis stage, feedback from the stakeholder groups would be compared to determine areas of agreement as well as areas of divergence
