

Key Insights
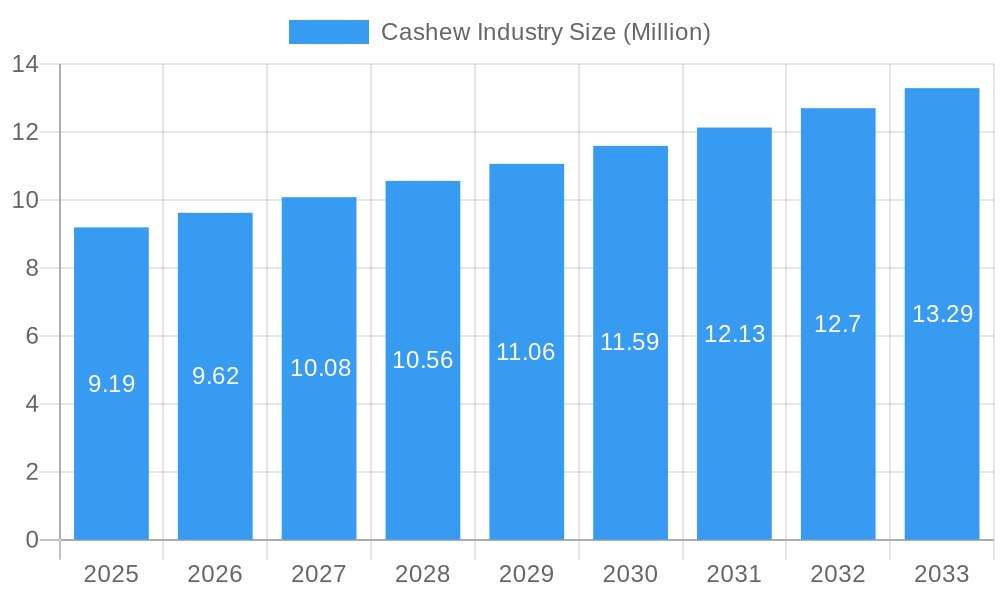
The global cashew industry, valued at $7.82 billion in 2025, is projected to experience steady growth, driven by increasing consumer demand for healthy snacks and the versatility of cashews in various food applications. A compound annual growth rate (CAGR) of 3.31% from 2025 to 2033 indicates a significant market expansion, reaching an estimated value exceeding $11 billion by 2033. Key growth drivers include the rising popularity of plant-based diets and dairy alternatives, which significantly increase cashew consumption. The processed food industry's incorporation of cashews as a key ingredient also fuels market growth. Furthermore, innovative product development, including flavored and roasted cashews, caters to evolving consumer preferences, stimulating market demand. While potential supply chain disruptions and price volatility due to climatic conditions could pose challenges, the overall industry outlook remains positive, particularly in regions like Asia-Pacific and North America, where cashew consumption is relatively high. Segmentation analysis reveals strong demand across various forms, including raw, roasted, salted, and flavored cashews, alongside different grades (white wholes, scorched wholes, dessert wholes, etc.) and sizes (pieces and wholes). Major players, such as Sunmark Food Ingredients, Royal Nuts, Dole Food Company, Olam International, and Cashew Nut Processing Factory, are strategically positioned to capitalize on this growth, through vertical integration, brand building, and innovative product offerings.
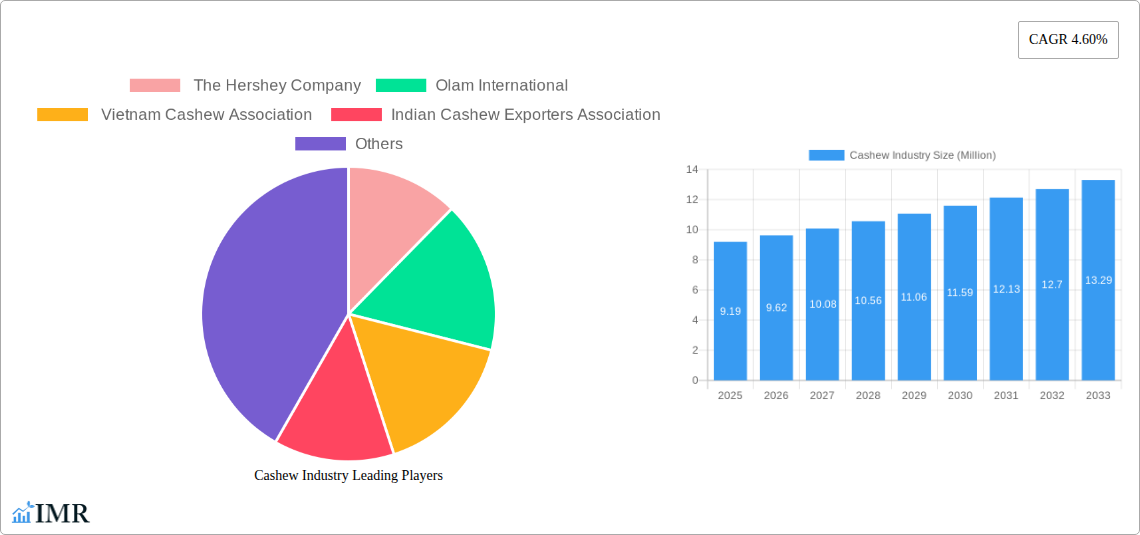
Cashew Industry Market Size (In Billion)
The competitive landscape is characterized by a mix of large multinational corporations and smaller regional players. Larger companies often leverage their global supply chains and distribution networks to maintain a competitive edge, while smaller companies focus on niche markets and specialized products. Future growth will likely be fueled by continued expansion into emerging markets, increased product diversification, and sustainability initiatives within the supply chain. Market segmentation presents opportunities for specialized players to cater to specific needs within the food and beverage industries. For instance, the increasing demand for plant-based alternatives necessitates specialized cashew products tailored to meet the specific needs of this growing sector. Further research focusing on the impact of consumer trends, sustainable sourcing practices, and technological advancements is crucial for a comprehensive understanding of this dynamic market.
Cashew Industry Company Market Share
Cashew Industry Market Report: 2019-2033
This comprehensive report provides a detailed analysis of the global cashew industry, covering market dynamics, growth trends, regional segmentation, product landscape, key players, and future outlook. With a study period spanning 2019-2033 (base year 2025, forecast period 2025-2033), this report is an essential resource for industry professionals, investors, and anyone seeking to understand this lucrative market. The report includes detailed analysis of parent markets (nuts and snacks) and child markets (specific cashew grades, types, and applications). The global cashew market size exceeded USD 300,000 million in 2022.
Cashew Industry Market Dynamics & Structure
The global cashew market exhibits moderate concentration, with several key players dominating specific segments. Technological innovation, driven primarily by automation in processing and improved traceability, plays a significant role. Regulatory frameworks vary across regions, influencing production and trade. Competitive substitutes include other nuts and snack products. End-user demographics are broad, encompassing various age groups and income levels with a growing preference for healthier snacks. M&A activity has been moderate, with a few notable transactions reported in recent years.
- Market Concentration: Moderately concentrated, with a few large players holding significant market share (xx%).
- Technological Innovation: Automation in processing, improved traceability, and sustainable farming practices are key drivers.
- Regulatory Frameworks: Vary considerably by region, impacting trade and production costs.
- Competitive Substitutes: Almonds, walnuts, peanuts, and other snack foods.
- End-User Demographics: Diverse, with strong growth in health-conscious consumers.
- M&A Activity: Moderate activity, with xx major deals recorded in the past 5 years. (e.g., acquisitions to expand processing capacity and geographic reach).
Cashew Industry Growth Trends & Insights
The cashew market experienced robust growth from 2019 to 2024, with a CAGR of xx%. This growth is attributed to factors such as rising disposable incomes, increasing demand for convenient and healthy snacks, and expanding applications in food processing and dairy alternatives. Consumer preference shifts towards healthier alternatives drive significant adoption rates for roasted, salted, and flavored cashews. Technological disruptions, including automation in processing and improved quality control, are further boosting market expansion. Future growth will be driven by factors like increasing health awareness, evolving consumer preferences, and product diversification. Market penetration in developing economies remains high, with significant growth potential.
- Market Size Evolution: Experienced substantial growth from xx million in 2019 to over xx million in 2024.
- Adoption Rates: High adoption rates for ready-to-eat and processed cashew products.
- Technological Disruptions: Automation in processing and packaging improving efficiency and quality.
- Consumer Behavior Shifts: Growing demand for convenient, healthy, and flavorful snacks.
Dominant Regions, Countries, or Segments in Cashew Industry
The global cashew industry is a dynamic sector with India and Vietnam consistently at the forefront as major producers and exporters. The market is characterized by a strong preference for White Whole Cashews, commanding the largest share due to their superior quality, versatility, and appeal in diverse culinary applications. Among the various processed types, roasted cashews are the most popular, closely followed by salted and an increasing array of flavored varieties. The primary driver of demand remains the snack segment, where cashews are a preferred choice for their nutritional value and taste. Supporting government policies aimed at boosting production and processing, significant investments in expanding processing capacity, and a robust global export market are key factors propelling the industry forward.
- Leading Region: Asia, particularly India and Vietnam, dominates the global market.
- Dominant Segment (Grade): White Wholes represent the largest market share, followed by Scorched Wholes, highlighting the demand for visually appealing and high-grade kernels.
- Dominant Segment (Type): Roasted cashews hold the leading market share, prized for their enhanced flavor and crunch.
- Dominant Segment (Application): The Snack category drives the highest demand, reflecting cashew's popularity as a convenient and nutritious treat.
- Key Growth Drivers: Favorable government incentives and policies, substantial expansion of processing infrastructure, and increasing global export opportunities are crucial for industry growth.
Cashew Industry Product Landscape
The cashew industry is witnessing significant product innovation, with a strong focus on elevating flavor profiles, introducing consumer-friendly and convenient packaging solutions, and broadening applications beyond traditional snacking. The market offers a wide array of ready-to-eat cashews in diverse flavors and portion sizes. Furthermore, processed cashew products such as nutrient-rich cashew butter and popular cashew milk are experiencing a surge in consumer adoption. Advancements in processing technologies, including precision techniques for optimal texture and sophisticated quality control measures, are instrumental in the development of premium-quality cashew products. Unique selling propositions are increasingly being built around natural ingredients, organic certifications, and the creation of distinctive and exotic flavor combinations to capture consumer interest.
Key Drivers, Barriers & Challenges in Cashew Industry
Key Drivers: Rising consumer demand for healthy snacks, growing applications in food processing and dairy alternatives, increasing disposable incomes in emerging markets, and technological advancements in processing and packaging.
Challenges: Fluctuations in raw cashew prices, stringent quality standards, seasonal availability, and competition from other nut products. Supply chain disruptions (e.g., pandemic effects) impacted availability and increased costs by xx%. Regulatory hurdles, particularly concerning labeling and import/export regulations, pose significant challenges for businesses.
Emerging Opportunities in Cashew Industry
Untapped markets in developing countries offer significant growth potential. Innovative applications, such as cashew-based protein bars and functional food ingredients, are emerging. Evolving consumer preferences towards sustainable and ethically sourced products present opportunities for businesses that prioritize sustainability. The increasing demand for vegan and plant-based alternatives is creating strong demand for cashew milk and related products.
Growth Accelerators in the Cashew Industry
Technological advancements are a pivotal growth accelerator for the cashew industry. Innovations in processing techniques, the integration of automation to enhance efficiency, and the implementation of robust traceability systems are crucial for streamlining operations and ensuring product integrity. Strategic collaborations between raw material producers, processors, and retail partners are essential for optimizing supply chains and fostering market reach. Expanding into new geographic markets and diversifying the product portfolio are significant opportunities for unlocking substantial growth potential. The escalating consumer awareness regarding health and wellness is a powerful driver, fueling the demand for cashew-based products that are both nutritious and conveniently packaged.
Key Players Shaping the Cashew Industry Market
- Sunmark Food Ingredients
- Royal Nuts
- Dole Food Company
- Olam International
- Olam Food Ingredients
- ITC Limited
- Kalpana Industries
- V.V. Exports
- Bhagwan Das & Sons
- Aarav Cashews
Notable Milestones in Cashew Industry Sector
- July 2022: Royal Nuts significantly boosted global processing capacity with the inauguration of a new USD 23 million cashew processing plant in Ivory Coast.
- September 2022: Julius Berger Nigeria PLC's entry into the cashew processing sector marked a substantial expansion of Nigeria's processing capabilities.
- January 2023: CRISIL reported that the Indian cashew processing industry's revenue surpassed USD 300,000 million, indicating robust and sustained growth within the sector.
- March 2023: Vietnam's cashew sector achieved record export revenues, underscoring its continued dominance in the global market.
- June 2023: An increased focus on sustainable farming practices and ethical sourcing gained traction, influencing consumer purchasing decisions and industry investments.
In-Depth Cashew Industry Market Outlook
The cashew industry is poised for continued growth, driven by several factors including rising demand for healthy snacks, increasing adoption of plant-based foods, and technological innovations enhancing production efficiency. Strategic partnerships and expansion into new markets will play a key role in shaping the future of this dynamic industry. The market is expected to reach xx million USD by 2033, presenting significant opportunities for investors and industry players alike.
Cashew Industry Segmentation
-
1. Grade
- 1.1. White Wholes
- 1.2. Scorched Wholes
- 1.3. Dessert Wholes
- 1.4. White Pieces
- 1.5. Scorched Pieces
- 1.6. Dessert Pieces
-
2. Grade
- 2.1. White Wholes
- 2.2. Scorched Wholes
- 2.3. Dessert Wholes
- 2.4. White Pieces
- 2.5. Scorched Pieces
- 2.6. Dessert Pieces
Cashew Industry Segmentation By Geography
-
1. North America
- 1.1. United States
- 1.2. Canada
- 1.3. Mexico
-
2. Europe
- 2.1. Germany
- 2.2. United Kingdom
- 2.3. France
-
3. Asia Pacific
- 3.1. India
- 3.2. China
- 3.3. Australia
- 3.4. Vietnam
- 3.5. Philippines
- 3.6. Indonesia
-
4. South America
- 4.1. Brazil
- 4.2. Argentina
-
5. Africa
- 5.1. C
- 6. Tanzania
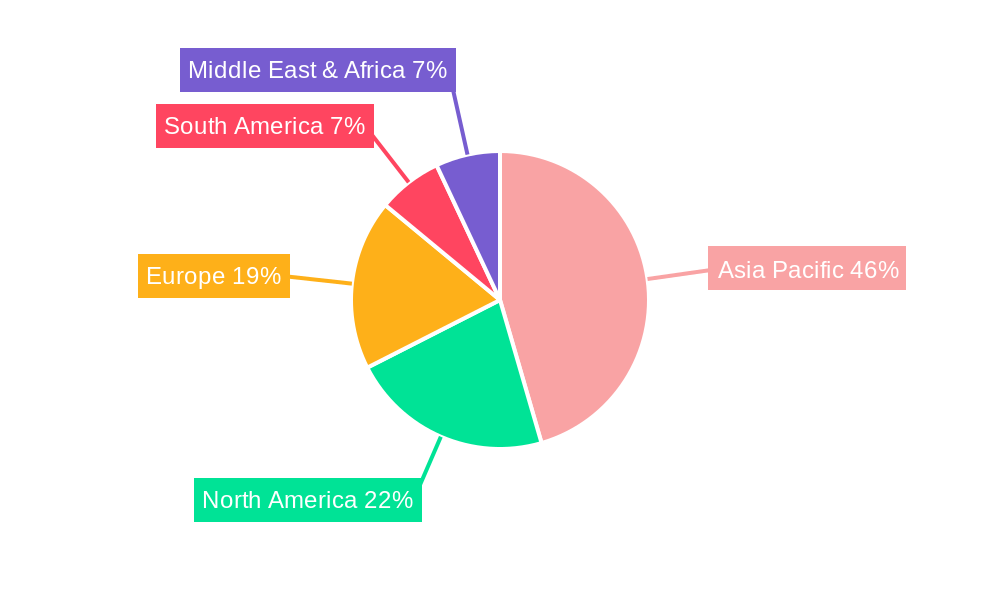
Cashew Industry Regional Market Share
Geographic Coverage of Cashew Industry
Cashew Industry REPORT HIGHLIGHTS
| Aspects | Details |
|---|---|
| Study Period | 2020-2034 |
| Base Year | 2025 |
| Estimated Year | 2026 |
| Forecast Period | 2026-2034 |
| Historical Period | 2020-2025 |
| Growth Rate | CAGR of 3.31% from 2020-2034 |
| Segmentation |
|
Table of Contents
- 1. Introduction
- 1.1. Research Scope
- 1.2. Market Segmentation
- 1.3. Research Objective
- 1.4. Definitions and Assumptions
- 2. Executive Summary
- 2.1. Market Snapshot
- 3. Market Dynamics
- 3.1. Market Drivers
- 3.2. Market Restrains
- 3.3. Market Trends
- 3.4. Market Opportunities
- 4. Market Factor Analysis
- 4.1. Porters Five Forces
- 4.1.1. Bargaining Power of Suppliers
- 4.1.2. Bargaining Power of Buyers
- 4.1.3. Threat of New Entrants
- 4.1.4. Threat of Substitutes
- 4.1.5. Competitive Rivalry
- 4.2. PESTEL analysis
- 4.3. BCG Analysis
- 4.3.1. Stars (High Growth, High Market Share)
- 4.3.2. Cash Cows (Low Growth, High Market Share)
- 4.3.3. Question Mark (High Growth, Low Market Share)
- 4.3.4. Dogs (Low Growth, Low Market Share)
- 4.4. Ansoff Matrix Analysis
- 4.5. Supply Chain Analysis
- 4.6. Regulatory Landscape
- 4.7. Current Market Potential and Opportunity Assessment (TAM–SAM–SOM Framework)
- 4.8. IMR Analyst Note
- 4.1. Porters Five Forces
- 5. Market Analysis, Insights and Forecast 2021-2033
- 5.1. Market Analysis, Insights and Forecast - by Grade
- 5.1.1. White Wholes
- 5.1.2. Scorched Wholes
- 5.1.3. Dessert Wholes
- 5.1.4. White Pieces
- 5.1.5. Scorched Pieces
- 5.1.6. Dessert Pieces
- 5.2. Market Analysis, Insights and Forecast - by Grade
- 5.2.1. White Wholes
- 5.2.2. Scorched Wholes
- 5.2.3. Dessert Wholes
- 5.2.4. White Pieces
- 5.2.5. Scorched Pieces
- 5.2.6. Dessert Pieces
- 5.3. Market Analysis, Insights and Forecast - by Region
- 5.3.1. North America
- 5.3.2. Europe
- 5.3.3. Asia Pacific
- 5.3.4. South America
- 5.3.5. Africa
- 5.3.6. Tanzania
- 5.1. Market Analysis, Insights and Forecast - by Grade
- 6. Global Cashew Industry Analysis, Insights and Forecast, 2021-2033
- 6.1. Market Analysis, Insights and Forecast - by Grade
- 6.1.1. White Wholes
- 6.1.2. Scorched Wholes
- 6.1.3. Dessert Wholes
- 6.1.4. White Pieces
- 6.1.5. Scorched Pieces
- 6.1.6. Dessert Pieces
- 6.2. Market Analysis, Insights and Forecast - by Grade
- 6.2.1. White Wholes
- 6.2.2. Scorched Wholes
- 6.2.3. Dessert Wholes
- 6.2.4. White Pieces
- 6.2.5. Scorched Pieces
- 6.2.6. Dessert Pieces
- 6.1. Market Analysis, Insights and Forecast - by Grade
- 7. North America Cashew Industry Analysis, Insights and Forecast, 2020-2032
- 7.1. Market Analysis, Insights and Forecast - by Grade
- 7.1.1. White Wholes
- 7.1.2. Scorched Wholes
- 7.1.3. Dessert Wholes
- 7.1.4. White Pieces
- 7.1.5. Scorched Pieces
- 7.1.6. Dessert Pieces
- 7.2. Market Analysis, Insights and Forecast - by Grade
- 7.2.1. White Wholes
- 7.2.2. Scorched Wholes
- 7.2.3. Dessert Wholes
- 7.2.4. White Pieces
- 7.2.5. Scorched Pieces
- 7.2.6. Dessert Pieces
- 7.1. Market Analysis, Insights and Forecast - by Grade
- 8. Europe Cashew Industry Analysis, Insights and Forecast, 2020-2032
- 8.1. Market Analysis, Insights and Forecast - by Grade
- 8.1.1. White Wholes
- 8.1.2. Scorched Wholes
- 8.1.3. Dessert Wholes
- 8.1.4. White Pieces
- 8.1.5. Scorched Pieces
- 8.1.6. Dessert Pieces
- 8.2. Market Analysis, Insights and Forecast - by Grade
- 8.2.1. White Wholes
- 8.2.2. Scorched Wholes
- 8.2.3. Dessert Wholes
- 8.2.4. White Pieces
- 8.2.5. Scorched Pieces
- 8.2.6. Dessert Pieces
- 8.1. Market Analysis, Insights and Forecast - by Grade
- 9. Asia Pacific Cashew Industry Analysis, Insights and Forecast, 2020-2032
- 9.1. Market Analysis, Insights and Forecast - by Grade
- 9.1.1. White Wholes
- 9.1.2. Scorched Wholes
- 9.1.3. Dessert Wholes
- 9.1.4. White Pieces
- 9.1.5. Scorched Pieces
- 9.1.6. Dessert Pieces
- 9.2. Market Analysis, Insights and Forecast - by Grade
- 9.2.1. White Wholes
- 9.2.2. Scorched Wholes
- 9.2.3. Dessert Wholes
- 9.2.4. White Pieces
- 9.2.5. Scorched Pieces
- 9.2.6. Dessert Pieces
- 9.1. Market Analysis, Insights and Forecast - by Grade
- 10. South America Cashew Industry Analysis, Insights and Forecast, 2020-2032
- 10.1. Market Analysis, Insights and Forecast - by Grade
- 10.1.1. White Wholes
- 10.1.2. Scorched Wholes
- 10.1.3. Dessert Wholes
- 10.1.4. White Pieces
- 10.1.5. Scorched Pieces
- 10.1.6. Dessert Pieces
- 10.2. Market Analysis, Insights and Forecast - by Grade
- 10.2.1. White Wholes
- 10.2.2. Scorched Wholes
- 10.2.3. Dessert Wholes
- 10.2.4. White Pieces
- 10.2.5. Scorched Pieces
- 10.2.6. Dessert Pieces
- 10.1. Market Analysis, Insights and Forecast - by Grade
- 11. Africa Cashew Industry Analysis, Insights and Forecast, 2020-2032
- 11.1. Market Analysis, Insights and Forecast - by Grade
- 11.1.1. White Wholes
- 11.1.2. Scorched Wholes
- 11.1.3. Dessert Wholes
- 11.1.4. White Pieces
- 11.1.5. Scorched Pieces
- 11.1.6. Dessert Pieces
- 11.2. Market Analysis, Insights and Forecast - by Grade
- 11.2.1. White Wholes
- 11.2.2. Scorched Wholes
- 11.2.3. Dessert Wholes
- 11.2.4. White Pieces
- 11.2.5. Scorched Pieces
- 11.2.6. Dessert Pieces
- 11.1. Market Analysis, Insights and Forecast - by Grade
- 12. Tanzania Cashew Industry Analysis, Insights and Forecast, 2020-2032
- 12.1. Market Analysis, Insights and Forecast - by Grade
- 12.1.1. White Wholes
- 12.1.2. Scorched Wholes
- 12.1.3. Dessert Wholes
- 12.1.4. White Pieces
- 12.1.5. Scorched Pieces
- 12.1.6. Dessert Pieces
- 12.2. Market Analysis, Insights and Forecast - by Grade
- 12.2.1. White Wholes
- 12.2.2. Scorched Wholes
- 12.2.3. Dessert Wholes
- 12.2.4. White Pieces
- 12.2.5. Scorched Pieces
- 12.2.6. Dessert Pieces
- 12.1. Market Analysis, Insights and Forecast - by Grade
- 13. Competitive Analysis
- 13.1. Company Profiles
- 13.1.1 Sunmark Food Ingredients
- 13.1.1.1. Company Overview
- 13.1.1.2. Products
- 13.1.1.3. Company Financials
- 13.1.1.4. SWOT Analysis
- 13.1.2 Royal Nuts
- 13.1.2.1. Company Overview
- 13.1.2.2. Products
- 13.1.2.3. Company Financials
- 13.1.2.4. SWOT Analysis
- 13.1.3 Dole Food Company
- 13.1.3.1. Company Overview
- 13.1.3.2. Products
- 13.1.3.3. Company Financials
- 13.1.3.4. SWOT Analysis
- 13.1.4 Olam International
- 13.1.4.1. Company Overview
- 13.1.4.2. Products
- 13.1.4.3. Company Financials
- 13.1.4.4. SWOT Analysis
- 13.1.5 Cashew Nut Processing Factory
- 13.1.5.1. Company Overview
- 13.1.5.2. Products
- 13.1.5.3. Company Financials
- 13.1.5.4. SWOT Analysis
- 13.1.1 Sunmark Food Ingredients
- 13.2. Market Entropy
- 13.2.1 Company's Key Areas Served
- 13.2.2 Recent Developments
- 13.3. Company Market Share Analysis 2025
- 13.3.1 Top 5 Companies Market Share Analysis
- 13.3.2 Top 3 Companies Market Share Analysis
- 13.4. List of Potential Customers
- 14. Research Methodology
List of Figures
- Figure 1: Global Cashew Industry Revenue Breakdown (Million, %) by Region 2025 & 2033
- Figure 2: Global Cashew Industry Volume Breakdown (Kiloton, %) by Region 2025 & 2033
- Figure 3: North America Cashew Industry Revenue (Million), by Grade 2025 & 2033
- Figure 4: North America Cashew Industry Volume (Kiloton), by Grade 2025 & 2033
- Figure 5: North America Cashew Industry Revenue Share (%), by Grade 2025 & 2033
- Figure 6: North America Cashew Industry Volume Share (%), by Grade 2025 & 2033
- Figure 7: North America Cashew Industry Revenue (Million), by Grade 2025 & 2033
- Figure 8: North America Cashew Industry Volume (Kiloton), by Grade 2025 & 2033
- Figure 9: North America Cashew Industry Revenue Share (%), by Grade 2025 & 2033
- Figure 10: North America Cashew Industry Volume Share (%), by Grade 2025 & 2033
- Figure 11: North America Cashew Industry Revenue (Million), by Country 2025 & 2033
- Figure 12: North America Cashew Industry Volume (Kiloton), by Country 2025 & 2033
- Figure 13: North America Cashew Industry Revenue Share (%), by Country 2025 & 2033
- Figure 14: North America Cashew Industry Volume Share (%), by Country 2025 & 2033
- Figure 15: Europe Cashew Industry Revenue (Million), by Grade 2025 & 2033
- Figure 16: Europe Cashew Industry Volume (Kiloton), by Grade 2025 & 2033
- Figure 17: Europe Cashew Industry Revenue Share (%), by Grade 2025 & 2033
- Figure 18: Europe Cashew Industry Volume Share (%), by Grade 2025 & 2033
- Figure 19: Europe Cashew Industry Revenue (Million), by Grade 2025 & 2033
- Figure 20: Europe Cashew Industry Volume (Kiloton), by Grade 2025 & 2033
- Figure 21: Europe Cashew Industry Revenue Share (%), by Grade 2025 & 2033
- Figure 22: Europe Cashew Industry Volume Share (%), by Grade 2025 & 2033
- Figure 23: Europe Cashew Industry Revenue (Million), by Country 2025 & 2033
- Figure 24: Europe Cashew Industry Volume (Kiloton), by Country 2025 & 2033
- Figure 25: Europe Cashew Industry Revenue Share (%), by Country 2025 & 2033
- Figure 26: Europe Cashew Industry Volume Share (%), by Country 2025 & 2033
- Figure 27: Asia Pacific Cashew Industry Revenue (Million), by Grade 2025 & 2033
- Figure 28: Asia Pacific Cashew Industry Volume (Kiloton), by Grade 2025 & 2033
- Figure 29: Asia Pacific Cashew Industry Revenue Share (%), by Grade 2025 & 2033
- Figure 30: Asia Pacific Cashew Industry Volume Share (%), by Grade 2025 & 2033
- Figure 31: Asia Pacific Cashew Industry Revenue (Million), by Grade 2025 & 2033
- Figure 32: Asia Pacific Cashew Industry Volume (Kiloton), by Grade 2025 & 2033
- Figure 33: Asia Pacific Cashew Industry Revenue Share (%), by Grade 2025 & 2033
- Figure 34: Asia Pacific Cashew Industry Volume Share (%), by Grade 2025 & 2033
- Figure 35: Asia Pacific Cashew Industry Revenue (Million), by Country 2025 & 2033
- Figure 36: Asia Pacific Cashew Industry Volume (Kiloton), by Country 2025 & 2033
- Figure 37: Asia Pacific Cashew Industry Revenue Share (%), by Country 2025 & 2033
- Figure 38: Asia Pacific Cashew Industry Volume Share (%), by Country 2025 & 2033
- Figure 39: South America Cashew Industry Revenue (Million), by Grade 2025 & 2033
- Figure 40: South America Cashew Industry Volume (Kiloton), by Grade 2025 & 2033
- Figure 41: South America Cashew Industry Revenue Share (%), by Grade 2025 & 2033
- Figure 42: South America Cashew Industry Volume Share (%), by Grade 2025 & 2033
- Figure 43: South America Cashew Industry Revenue (Million), by Grade 2025 & 2033
- Figure 44: South America Cashew Industry Volume (Kiloton), by Grade 2025 & 2033
- Figure 45: South America Cashew Industry Revenue Share (%), by Grade 2025 & 2033
- Figure 46: South America Cashew Industry Volume Share (%), by Grade 2025 & 2033
- Figure 47: South America Cashew Industry Revenue (Million), by Country 2025 & 2033
- Figure 48: South America Cashew Industry Volume (Kiloton), by Country 2025 & 2033
- Figure 49: South America Cashew Industry Revenue Share (%), by Country 2025 & 2033
- Figure 50: South America Cashew Industry Volume Share (%), by Country 2025 & 2033
- Figure 51: Africa Cashew Industry Revenue (Million), by Grade 2025 & 2033
- Figure 52: Africa Cashew Industry Volume (Kiloton), by Grade 2025 & 2033
- Figure 53: Africa Cashew Industry Revenue Share (%), by Grade 2025 & 2033
- Figure 54: Africa Cashew Industry Volume Share (%), by Grade 2025 & 2033
- Figure 55: Africa Cashew Industry Revenue (Million), by Grade 2025 & 2033
- Figure 56: Africa Cashew Industry Volume (Kiloton), by Grade 2025 & 2033
- Figure 57: Africa Cashew Industry Revenue Share (%), by Grade 2025 & 2033
- Figure 58: Africa Cashew Industry Volume Share (%), by Grade 2025 & 2033
- Figure 59: Africa Cashew Industry Revenue (Million), by Country 2025 & 2033
- Figure 60: Africa Cashew Industry Volume (Kiloton), by Country 2025 & 2033
- Figure 61: Africa Cashew Industry Revenue Share (%), by Country 2025 & 2033
- Figure 62: Africa Cashew Industry Volume Share (%), by Country 2025 & 2033
- Figure 63: Tanzania Cashew Industry Revenue (Million), by Grade 2025 & 2033
- Figure 64: Tanzania Cashew Industry Volume (Kiloton), by Grade 2025 & 2033
- Figure 65: Tanzania Cashew Industry Revenue Share (%), by Grade 2025 & 2033
- Figure 66: Tanzania Cashew Industry Volume Share (%), by Grade 2025 & 2033
- Figure 67: Tanzania Cashew Industry Revenue (Million), by Grade 2025 & 2033
- Figure 68: Tanzania Cashew Industry Volume (Kiloton), by Grade 2025 & 2033
- Figure 69: Tanzania Cashew Industry Revenue Share (%), by Grade 2025 & 2033
- Figure 70: Tanzania Cashew Industry Volume Share (%), by Grade 2025 & 2033
- Figure 71: Tanzania Cashew Industry Revenue (Million), by Country 2025 & 2033
- Figure 72: Tanzania Cashew Industry Volume (Kiloton), by Country 2025 & 2033
- Figure 73: Tanzania Cashew Industry Revenue Share (%), by Country 2025 & 2033
- Figure 74: Tanzania Cashew Industry Volume Share (%), by Country 2025 & 2033
List of Tables
- Table 1: Global Cashew Industry Revenue Million Forecast, by Grade 2020 & 2033
- Table 2: Global Cashew Industry Volume Kiloton Forecast, by Grade 2020 & 2033
- Table 3: Global Cashew Industry Revenue Million Forecast, by Grade 2020 & 2033
- Table 4: Global Cashew Industry Volume Kiloton Forecast, by Grade 2020 & 2033
- Table 5: Global Cashew Industry Revenue Million Forecast, by Region 2020 & 2033
- Table 6: Global Cashew Industry Volume Kiloton Forecast, by Region 2020 & 2033
- Table 7: Global Cashew Industry Revenue Million Forecast, by Grade 2020 & 2033
- Table 8: Global Cashew Industry Volume Kiloton Forecast, by Grade 2020 & 2033
- Table 9: Global Cashew Industry Revenue Million Forecast, by Grade 2020 & 2033
- Table 10: Global Cashew Industry Volume Kiloton Forecast, by Grade 2020 & 2033
- Table 11: Global Cashew Industry Revenue Million Forecast, by Country 2020 & 2033
- Table 12: Global Cashew Industry Volume Kiloton Forecast, by Country 2020 & 2033
- Table 13: United States Cashew Industry Revenue (Million) Forecast, by Application 2020 & 2033
- Table 14: United States Cashew Industry Volume (Kiloton) Forecast, by Application 2020 & 2033
- Table 15: Canada Cashew Industry Revenue (Million) Forecast, by Application 2020 & 2033
- Table 16: Canada Cashew Industry Volume (Kiloton) Forecast, by Application 2020 & 2033
- Table 17: Mexico Cashew Industry Revenue (Million) Forecast, by Application 2020 & 2033
- Table 18: Mexico Cashew Industry Volume (Kiloton) Forecast, by Application 2020 & 2033
- Table 19: Global Cashew Industry Revenue Million Forecast, by Grade 2020 & 2033
- Table 20: Global Cashew Industry Volume Kiloton Forecast, by Grade 2020 & 2033
- Table 21: Global Cashew Industry Revenue Million Forecast, by Grade 2020 & 2033
- Table 22: Global Cashew Industry Volume Kiloton Forecast, by Grade 2020 & 2033
- Table 23: Global Cashew Industry Revenue Million Forecast, by Country 2020 & 2033
- Table 24: Global Cashew Industry Volume Kiloton Forecast, by Country 2020 & 2033
- Table 25: Germany Cashew Industry Revenue (Million) Forecast, by Application 2020 & 2033
- Table 26: Germany Cashew Industry Volume (Kiloton) Forecast, by Application 2020 & 2033
- Table 27: United Kingdom Cashew Industry Revenue (Million) Forecast, by Application 2020 & 2033
- Table 28: United Kingdom Cashew Industry Volume (Kiloton) Forecast, by Application 2020 & 2033
- Table 29: France Cashew Industry Revenue (Million) Forecast, by Application 2020 & 2033
- Table 30: France Cashew Industry Volume (Kiloton) Forecast, by Application 2020 & 2033
- Table 31: Global Cashew Industry Revenue Million Forecast, by Grade 2020 & 2033
- Table 32: Global Cashew Industry Volume Kiloton Forecast, by Grade 2020 & 2033
- Table 33: Global Cashew Industry Revenue Million Forecast, by Grade 2020 & 2033
- Table 34: Global Cashew Industry Volume Kiloton Forecast, by Grade 2020 & 2033
- Table 35: Global Cashew Industry Revenue Million Forecast, by Country 2020 & 2033
- Table 36: Global Cashew Industry Volume Kiloton Forecast, by Country 2020 & 2033
- Table 37: India Cashew Industry Revenue (Million) Forecast, by Application 2020 & 2033
- Table 38: India Cashew Industry Volume (Kiloton) Forecast, by Application 2020 & 2033
- Table 39: China Cashew Industry Revenue (Million) Forecast, by Application 2020 & 2033
- Table 40: China Cashew Industry Volume (Kiloton) Forecast, by Application 2020 & 2033
- Table 41: Australia Cashew Industry Revenue (Million) Forecast, by Application 2020 & 2033
- Table 42: Australia Cashew Industry Volume (Kiloton) Forecast, by Application 2020 & 2033
- Table 43: Vietnam Cashew Industry Revenue (Million) Forecast, by Application 2020 & 2033
- Table 44: Vietnam Cashew Industry Volume (Kiloton) Forecast, by Application 2020 & 2033
- Table 45: Philippines Cashew Industry Revenue (Million) Forecast, by Application 2020 & 2033
- Table 46: Philippines Cashew Industry Volume (Kiloton) Forecast, by Application 2020 & 2033
- Table 47: Indonesia Cashew Industry Revenue (Million) Forecast, by Application 2020 & 2033
- Table 48: Indonesia Cashew Industry Volume (Kiloton) Forecast, by Application 2020 & 2033
- Table 49: Global Cashew Industry Revenue Million Forecast, by Grade 2020 & 2033
- Table 50: Global Cashew Industry Volume Kiloton Forecast, by Grade 2020 & 2033
- Table 51: Global Cashew Industry Revenue Million Forecast, by Grade 2020 & 2033
- Table 52: Global Cashew Industry Volume Kiloton Forecast, by Grade 2020 & 2033
- Table 53: Global Cashew Industry Revenue Million Forecast, by Country 2020 & 2033
- Table 54: Global Cashew Industry Volume Kiloton Forecast, by Country 2020 & 2033
- Table 55: Brazil Cashew Industry Revenue (Million) Forecast, by Application 2020 & 2033
- Table 56: Brazil Cashew Industry Volume (Kiloton) Forecast, by Application 2020 & 2033
- Table 57: Argentina Cashew Industry Revenue (Million) Forecast, by Application 2020 & 2033
- Table 58: Argentina Cashew Industry Volume (Kiloton) Forecast, by Application 2020 & 2033
- Table 59: Global Cashew Industry Revenue Million Forecast, by Grade 2020 & 2033
- Table 60: Global Cashew Industry Volume Kiloton Forecast, by Grade 2020 & 2033
- Table 61: Global Cashew Industry Revenue Million Forecast, by Grade 2020 & 2033
- Table 62: Global Cashew Industry Volume Kiloton Forecast, by Grade 2020 & 2033
- Table 63: Global Cashew Industry Revenue Million Forecast, by Country 2020 & 2033
- Table 64: Global Cashew Industry Volume Kiloton Forecast, by Country 2020 & 2033
- Table 65: C Cashew Industry Revenue (Million) Forecast, by Application 2020 & 2033
- Table 66: C Cashew Industry Volume (Kiloton) Forecast, by Application 2020 & 2033
- Table 67: Global Cashew Industry Revenue Million Forecast, by Grade 2020 & 2033
- Table 68: Global Cashew Industry Volume Kiloton Forecast, by Grade 2020 & 2033
- Table 69: Global Cashew Industry Revenue Million Forecast, by Grade 2020 & 2033
- Table 70: Global Cashew Industry Volume Kiloton Forecast, by Grade 2020 & 2033
- Table 71: Global Cashew Industry Revenue Million Forecast, by Country 2020 & 2033
- Table 72: Global Cashew Industry Volume Kiloton Forecast, by Country 2020 & 2033
Frequently Asked Questions
1. What is the projected Compound Annual Growth Rate (CAGR) of the Cashew Industry?
The projected CAGR is approximately 3.31%.
2. Which companies are prominent players in the Cashew Industry?
Key companies in the market include Sunmark Food Ingredients, Royal Nuts , Dole Food Company , Olam International , Cashew Nut Processing Factory.
3. What are the main segments of the Cashew Industry?
The market segments include Grade, Grade.
4. Can you provide details about the market size?
The market size is estimated to be USD 7.82 Million as of 2022.
5. What are some drivers contributing to market growth?
Rising Consumption of Cashew Nuts as a Healthy Snack; Increasing Government initiatives; Growing Cashew Nut Imports in The United States.
6. What are the notable trends driving market growth?
Rising Consumption of Cashew Nuts as a Healthy Snack.
7. Are there any restraints impacting market growth?
Hazardous Climatic Condition Hinders Cashew Production; Stringent Regulations Related To Food Quality Standards.
8. Can you provide examples of recent developments in the market?
January 2023: According to CRISIL (an Indian consulting firm offering ratings, analysis, risk, and policy advice) and a branch of S&P Global, the Indian cashew processing industry is driving demand for cashews, which extended beyond USD 300,000 million in 2022, an increase of 15% year-on-year growth in revenue.
9. What pricing options are available for accessing the report?
Pricing options include single-user, multi-user, and enterprise licenses priced at USD 4750, USD 5250, and USD 8750 respectively.
10. Is the market size provided in terms of value or volume?
The market size is provided in terms of value, measured in Million and volume, measured in Kiloton.
11. Are there any specific market keywords associated with the report?
Yes, the market keyword associated with the report is "Cashew Industry," which aids in identifying and referencing the specific market segment covered.
12. How do I determine which pricing option suits my needs best?
The pricing options vary based on user requirements and access needs. Individual users may opt for single-user licenses, while businesses requiring broader access may choose multi-user or enterprise licenses for cost-effective access to the report.
13. Are there any additional resources or data provided in the Cashew Industry report?
While the report offers comprehensive insights, it's advisable to review the specific contents or supplementary materials provided to ascertain if additional resources or data are available.
14. How can I stay updated on further developments or reports in the Cashew Industry?
To stay informed about further developments, trends, and reports in the Cashew Industry, consider subscribing to industry newsletters, following relevant companies and organizations, or regularly checking reputable industry news sources and publications.
Methodology
Step 1 - Identification of Relevant Samples Size from Population Database


Step 2 - Approaches for Defining Global Market Size (Value, Volume* & Price*)

Note*: In applicable scenarios
Step 3 - Data Sources
Primary Research
- Web Analytics
- Survey Reports
- Research Institute
- Latest Research Reports
- Opinion Leaders
Secondary Research
- Annual Reports
- White Paper
- Latest Press Release
- Industry Association
- Paid Database
- Investor Presentations

Step 4 - Data Triangulation
Involves using different sources of information in order to increase the validity of a study
These sources are likely to be stakeholders in a program - participants, other researchers, program staff, other community members, and so on.
Then we put all data in single framework & apply various statistical tools to find out the dynamic on the market.
During the analysis stage, feedback from the stakeholder groups would be compared to determine areas of agreement as well as areas of divergence