

Key Insights
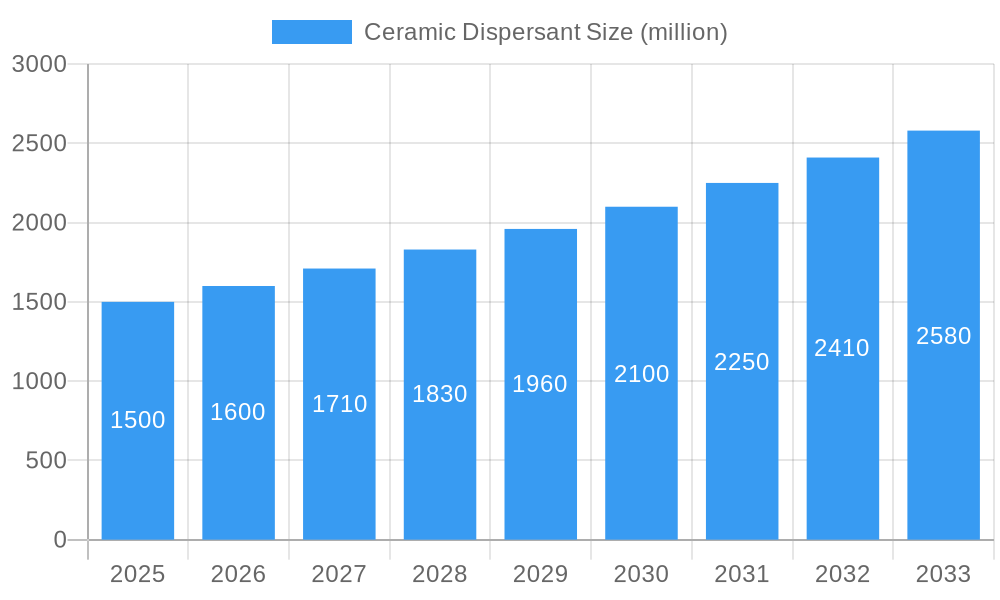
The global ceramic dispersant market is poised for significant expansion, propelled by robust demand from the burgeoning construction and ceramics sectors. The increasing utilization of high-performance ceramics across diverse applications, including advanced electronics, automotive components, and industrial machinery, is a primary driver of this growth. Innovations in dispersant formulations, offering enhanced rheological properties and superior cost-efficiency, are further accelerating market development. The market is segmented by dispersant type (polymeric, inorganic), application (tiles, sanitaryware, refractories, advanced ceramics), and geography. Intense competition among leading players such as Croda International plc, Lubrizol, and Solvay is characterized by a strategic focus on product innovation and key partnerships. Despite challenges like raw material price fluctuations and stringent environmental regulations, the market is projected to achieve a Compound Annual Growth Rate (CAGR) of 5.4% from a market size of $2.5 billion in the base year 2025. This growth is notably pronounced in developing economies undergoing rapid industrialization and infrastructure development. The escalating adoption of sustainable and eco-friendly dispersants will significantly influence future market dynamics.
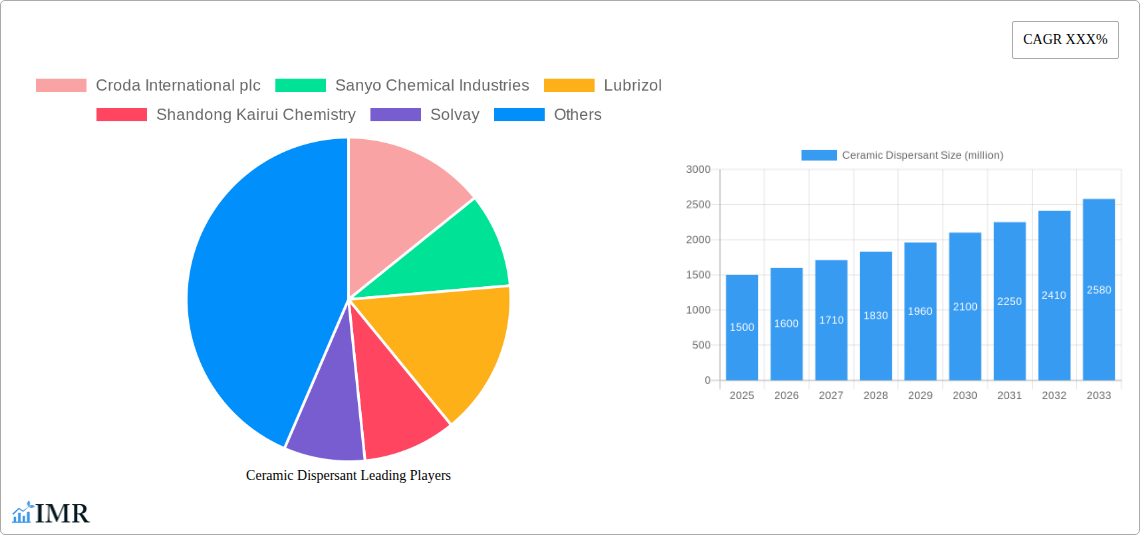
Ceramic Dispersant Market Size (In Billion)
The forecast period (2025-2033) projects sustained market expansion, fueled by ongoing global construction initiatives, particularly in emerging markets. The integration of advanced ceramic materials in high-technology applications is also expected to boost demand. Market participants will likely prioritize research and development to engineer more efficient and sustainable dispersants, addressing environmental concerns and cost pressures. Strategic mergers, acquisitions, and collaborations are anticipated as companies aim to strengthen their product offerings and broaden their international presence. Regional growth disparities are expected, with economies exhibiting strong economic development and industrial activity anticipated to lead market expansion.
Ceramic Dispersant Company Market Share
Ceramic Dispersant Market Report: 2019-2033
This comprehensive report provides an in-depth analysis of the global Ceramic Dispersant market, encompassing historical data (2019-2024), current estimates (2025), and future projections (2025-2033). It meticulously examines market dynamics, growth trends, regional dominance, product landscapes, and key players, offering invaluable insights for industry professionals, investors, and strategic decision-makers. The report utilizes a robust methodology combining primary and secondary research to deliver accurate and actionable intelligence. The parent market is the chemical dispersants market, while the child market is specifically ceramic dispersants used in various applications.
Ceramic Dispersant Market Dynamics & Structure
This section analyzes the competitive landscape, technological advancements, regulatory influences, and market trends within the Ceramic Dispersant industry. The market is moderately concentrated, with key players holding significant market share. However, the emergence of innovative solutions and new entrants is gradually shaping the competitive dynamics. M&A activity within the sector is expected to reach xx million USD by 2033, driven by the consolidation efforts of major companies seeking to strengthen their portfolios and expand their global presence.
- Market Concentration: The top 5 players control approximately 45% of the global market share in 2025.
- Technological Innovation: Nanotechnology and advancements in polymer chemistry are driving the development of high-performance dispersants.
- Regulatory Framework: Stringent environmental regulations are influencing the formulation of eco-friendly dispersants, impacting market growth.
- Competitive Substitutes: The presence of alternative technologies poses moderate competitive pressure.
- End-User Demographics: The construction, ceramics, and coatings industries are major end-users, driving demand.
- M&A Trends: Strategic acquisitions and partnerships are expected to increase consolidation and drive innovation within the market.
Ceramic Dispersant Growth Trends & Insights
The global Ceramic Dispersant market is projected to experience substantial growth, driven by increasing demand from various industries. The market size is estimated at xx million units in 2025 and is forecast to reach xx million units by 2033, exhibiting a CAGR of xx% during the forecast period. This growth is fueled by several factors including increasing infrastructure development, rising disposable incomes in developing economies, and the growing adoption of advanced ceramic materials in various applications. Technological advancements in dispersant formulations are also contributing to improved product performance, efficiency, and market penetration. Consumer behavior shifts towards sustainability are creating new opportunities for eco-friendly dispersants.
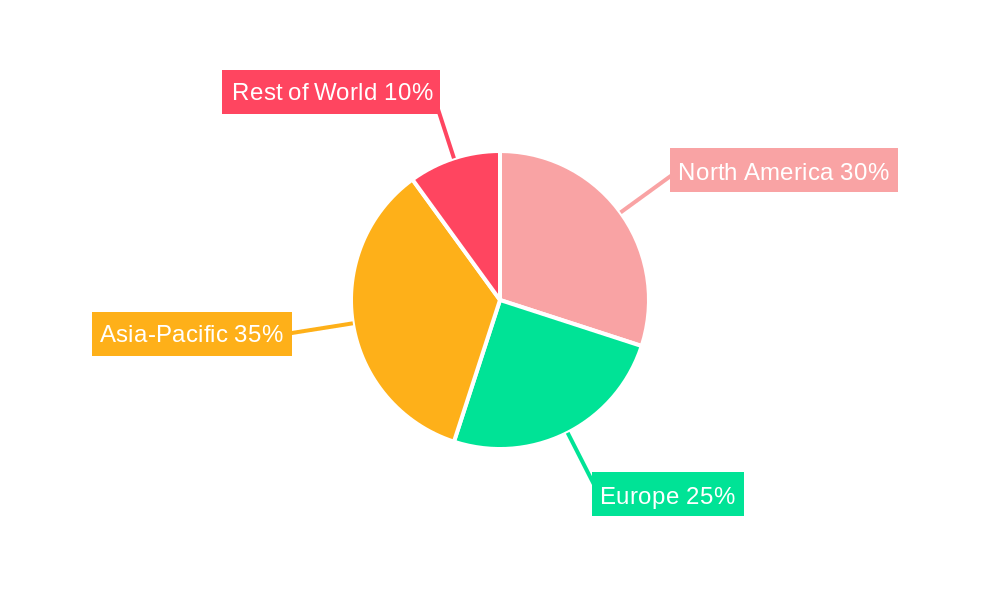
Dominant Regions, Countries, or Segments in Ceramic Dispersant
The Asia-Pacific region is currently the dominant market for Ceramic Dispersants, holding a market share of approximately xx% in 2025, driven by rapid industrialization and significant investments in infrastructure projects. China, specifically, is a key contributor to this regional dominance. Europe and North America follow closely, exhibiting steady growth driven by technological advancements and stringent environmental regulations.
- Key Drivers in Asia-Pacific:
- Rapid industrialization and urbanization
- Growing construction and infrastructure development
- Increasing demand for advanced ceramics
- Dominance Factors:
- Large manufacturing base
- Cost-effective production
- Favorable government policies
- Growth Potential: Significant opportunities exist in emerging markets within Asia-Pacific and other developing regions.
Ceramic Dispersant Product Landscape
Ceramic dispersants are available in various forms, including liquid, powder, and paste, each tailored for specific applications. Recent innovations focus on enhancing their performance characteristics such as improved dispersion stability, reduced viscosity, and enhanced rheological properties. Unique selling propositions frequently center on superior dispersion efficiency, compatibility with diverse ceramic materials, and reduced environmental impact. Technological advancements have led to the development of high-performance dispersants with improved cost-effectiveness and longer shelf life.
Key Drivers, Barriers & Challenges in Ceramic Dispersant
Key Drivers:
- Increasing demand from the construction and automotive industries
- Technological advancements leading to improved product performance
- Favorable government policies promoting sustainable materials
Challenges & Restraints:
- Fluctuations in raw material prices
- Stringent environmental regulations
- Intense competition from established players
Emerging Opportunities in Ceramic Dispersant
Emerging opportunities include expanding into untapped markets in developing economies and developing new applications in advanced ceramic technologies such as high-temperature ceramics and functional ceramics. Evolving consumer preferences for sustainable and environmentally friendly products create opportunities for eco-friendly dispersants.
Growth Accelerators in the Ceramic Dispersant Industry
Technological breakthroughs in nanotechnology and polymer chemistry are key growth drivers, enhancing dispersant efficiency and performance. Strategic partnerships and collaborations among manufacturers and end-users are also accelerating market growth. Market expansion strategies focusing on emerging economies and new applications are further fueling expansion.
Key Players Shaping the Ceramic Dispersant Market
- Croda International plc
- Sanyo Chemical Industries
- Lubrizol
- Shandong Kairui Chemistry
- Solvay
- Dow
- Kao Corporation
- NOF Corporation
- San Nopco
- JAS Global Industries
- Vanderbilt Minerals LLC
- Pflaumer
- Shandong Taihe Technologies
- Chukyo Yushi
Notable Milestones in Ceramic Dispersant Sector
- 2022-Q3: Launch of a new generation of high-performance dispersants by Croda International plc.
- 2023-Q1: Strategic partnership between Solvay and a major ceramics manufacturer.
- 2024-Q4: Acquisition of a smaller dispersant producer by Lubrizol. (Further milestones to be added based on actual data)
In-Depth Ceramic Dispersant Market Outlook
The Ceramic Dispersant market is poised for sustained growth, driven by technological innovation, increasing demand from key industries, and favorable market conditions. Strategic partnerships, market expansion into emerging economies, and the development of innovative applications will continue to shape the market landscape, presenting significant opportunities for both established players and new entrants. The focus on sustainable and eco-friendly solutions will remain a critical growth driver.
Ceramic Dispersant Segmentation
-
1. Application
- 1.1. Communication
- 1.2. Consumer Electronics
- 1.3. Automotive Eletronics
- 1.4. Others
-
2. Type
- 2.1. Ionic Dispersant
- 2.2. Nonionic Dispersant
Ceramic Dispersant Segmentation By Geography
-
1. North America
- 1.1. United States
- 1.2. Canada
- 1.3. Mexico
-
2. South America
- 2.1. Brazil
- 2.2. Argentina
- 2.3. Rest of South America
-
3. Europe
- 3.1. United Kingdom
- 3.2. Germany
- 3.3. France
- 3.4. Italy
- 3.5. Spain
- 3.6. Russia
- 3.7. Benelux
- 3.8. Nordics
- 3.9. Rest of Europe
-
4. Middle East & Africa
- 4.1. Turkey
- 4.2. Israel
- 4.3. GCC
- 4.4. North Africa
- 4.5. South Africa
- 4.6. Rest of Middle East & Africa
-
5. Asia Pacific
- 5.1. China
- 5.2. India
- 5.3. Japan
- 5.4. South Korea
- 5.5. ASEAN
- 5.6. Oceania
- 5.7. Rest of Asia Pacific
Ceramic Dispersant Regional Market Share
Geographic Coverage of Ceramic Dispersant
Ceramic Dispersant REPORT HIGHLIGHTS
| Aspects | Details |
|---|---|
| Study Period | 2020-2034 |
| Base Year | 2025 |
| Estimated Year | 2026 |
| Forecast Period | 2026-2034 |
| Historical Period | 2020-2025 |
| Growth Rate | CAGR of 5.4% from 2020-2034 |
| Segmentation |
|
Table of Contents
- 1. Introduction
- 1.1. Research Scope
- 1.2. Market Segmentation
- 1.3. Research Objective
- 1.4. Definitions and Assumptions
- 2. Executive Summary
- 2.1. Market Snapshot
- 3. Market Dynamics
- 3.1. Market Drivers
- 3.2. Market Restrains
- 3.3. Market Trends
- 3.4. Market Opportunities
- 4. Market Factor Analysis
- 4.1. Porters Five Forces
- 4.1.1. Bargaining Power of Suppliers
- 4.1.2. Bargaining Power of Buyers
- 4.1.3. Threat of New Entrants
- 4.1.4. Threat of Substitutes
- 4.1.5. Competitive Rivalry
- 4.2. PESTEL analysis
- 4.3. BCG Analysis
- 4.3.1. Stars (High Growth, High Market Share)
- 4.3.2. Cash Cows (Low Growth, High Market Share)
- 4.3.3. Question Mark (High Growth, Low Market Share)
- 4.3.4. Dogs (Low Growth, Low Market Share)
- 4.4. Ansoff Matrix Analysis
- 4.5. Supply Chain Analysis
- 4.6. Regulatory Landscape
- 4.7. Current Market Potential and Opportunity Assessment (TAM–SAM–SOM Framework)
- 4.8. IMR Analyst Note
- 4.1. Porters Five Forces
- 5. Market Analysis, Insights and Forecast 2021-2033
- 5.1. Market Analysis, Insights and Forecast - by Application
- 5.1.1. Communication
- 5.1.2. Consumer Electronics
- 5.1.3. Automotive Eletronics
- 5.1.4. Others
- 5.2. Market Analysis, Insights and Forecast - by Type
- 5.2.1. Ionic Dispersant
- 5.2.2. Nonionic Dispersant
- 5.3. Market Analysis, Insights and Forecast - by Region
- 5.3.1. North America
- 5.3.2. South America
- 5.3.3. Europe
- 5.3.4. Middle East & Africa
- 5.3.5. Asia Pacific
- 5.1. Market Analysis, Insights and Forecast - by Application
- 6. Global Ceramic Dispersant Analysis, Insights and Forecast, 2021-2033
- 6.1. Market Analysis, Insights and Forecast - by Application
- 6.1.1. Communication
- 6.1.2. Consumer Electronics
- 6.1.3. Automotive Eletronics
- 6.1.4. Others
- 6.2. Market Analysis, Insights and Forecast - by Type
- 6.2.1. Ionic Dispersant
- 6.2.2. Nonionic Dispersant
- 6.1. Market Analysis, Insights and Forecast - by Application
- 7. North America Ceramic Dispersant Analysis, Insights and Forecast, 2020-2032
- 7.1. Market Analysis, Insights and Forecast - by Application
- 7.1.1. Communication
- 7.1.2. Consumer Electronics
- 7.1.3. Automotive Eletronics
- 7.1.4. Others
- 7.2. Market Analysis, Insights and Forecast - by Type
- 7.2.1. Ionic Dispersant
- 7.2.2. Nonionic Dispersant
- 7.1. Market Analysis, Insights and Forecast - by Application
- 8. South America Ceramic Dispersant Analysis, Insights and Forecast, 2020-2032
- 8.1. Market Analysis, Insights and Forecast - by Application
- 8.1.1. Communication
- 8.1.2. Consumer Electronics
- 8.1.3. Automotive Eletronics
- 8.1.4. Others
- 8.2. Market Analysis, Insights and Forecast - by Type
- 8.2.1. Ionic Dispersant
- 8.2.2. Nonionic Dispersant
- 8.1. Market Analysis, Insights and Forecast - by Application
- 9. Europe Ceramic Dispersant Analysis, Insights and Forecast, 2020-2032
- 9.1. Market Analysis, Insights and Forecast - by Application
- 9.1.1. Communication
- 9.1.2. Consumer Electronics
- 9.1.3. Automotive Eletronics
- 9.1.4. Others
- 9.2. Market Analysis, Insights and Forecast - by Type
- 9.2.1. Ionic Dispersant
- 9.2.2. Nonionic Dispersant
- 9.1. Market Analysis, Insights and Forecast - by Application
- 10. Middle East & Africa Ceramic Dispersant Analysis, Insights and Forecast, 2020-2032
- 10.1. Market Analysis, Insights and Forecast - by Application
- 10.1.1. Communication
- 10.1.2. Consumer Electronics
- 10.1.3. Automotive Eletronics
- 10.1.4. Others
- 10.2. Market Analysis, Insights and Forecast - by Type
- 10.2.1. Ionic Dispersant
- 10.2.2. Nonionic Dispersant
- 10.1. Market Analysis, Insights and Forecast - by Application
- 11. Asia Pacific Ceramic Dispersant Analysis, Insights and Forecast, 2020-2032
- 11.1. Market Analysis, Insights and Forecast - by Application
- 11.1.1. Communication
- 11.1.2. Consumer Electronics
- 11.1.3. Automotive Eletronics
- 11.1.4. Others
- 11.2. Market Analysis, Insights and Forecast - by Type
- 11.2.1. Ionic Dispersant
- 11.2.2. Nonionic Dispersant
- 11.1. Market Analysis, Insights and Forecast - by Application
- 12. Competitive Analysis
- 12.1. Company Profiles
- 12.1.1 Croda International plc
- 12.1.1.1. Company Overview
- 12.1.1.2. Products
- 12.1.1.3. Company Financials
- 12.1.1.4. SWOT Analysis
- 12.1.2 Sanyo Chemical Industries
- 12.1.2.1. Company Overview
- 12.1.2.2. Products
- 12.1.2.3. Company Financials
- 12.1.2.4. SWOT Analysis
- 12.1.3 Lubrizol
- 12.1.3.1. Company Overview
- 12.1.3.2. Products
- 12.1.3.3. Company Financials
- 12.1.3.4. SWOT Analysis
- 12.1.4 Shandong Kairui Chemistry
- 12.1.4.1. Company Overview
- 12.1.4.2. Products
- 12.1.4.3. Company Financials
- 12.1.4.4. SWOT Analysis
- 12.1.5 Solvay
- 12.1.5.1. Company Overview
- 12.1.5.2. Products
- 12.1.5.3. Company Financials
- 12.1.5.4. SWOT Analysis
- 12.1.6 Dow
- 12.1.6.1. Company Overview
- 12.1.6.2. Products
- 12.1.6.3. Company Financials
- 12.1.6.4. SWOT Analysis
- 12.1.7 Kao Corporation
- 12.1.7.1. Company Overview
- 12.1.7.2. Products
- 12.1.7.3. Company Financials
- 12.1.7.4. SWOT Analysis
- 12.1.8 NOF Corporation
- 12.1.8.1. Company Overview
- 12.1.8.2. Products
- 12.1.8.3. Company Financials
- 12.1.8.4. SWOT Analysis
- 12.1.9 San Nopco
- 12.1.9.1. Company Overview
- 12.1.9.2. Products
- 12.1.9.3. Company Financials
- 12.1.9.4. SWOT Analysis
- 12.1.10 JAS Global Industries
- 12.1.10.1. Company Overview
- 12.1.10.2. Products
- 12.1.10.3. Company Financials
- 12.1.10.4. SWOT Analysis
- 12.1.11 Vanderbilt Minerals LLC
- 12.1.11.1. Company Overview
- 12.1.11.2. Products
- 12.1.11.3. Company Financials
- 12.1.11.4. SWOT Analysis
- 12.1.12 Pflaumer
- 12.1.12.1. Company Overview
- 12.1.12.2. Products
- 12.1.12.3. Company Financials
- 12.1.12.4. SWOT Analysis
- 12.1.13 Shandong Taihe Technologies
- 12.1.13.1. Company Overview
- 12.1.13.2. Products
- 12.1.13.3. Company Financials
- 12.1.13.4. SWOT Analysis
- 12.1.14 Chukyo Yushi
- 12.1.14.1. Company Overview
- 12.1.14.2. Products
- 12.1.14.3. Company Financials
- 12.1.14.4. SWOT Analysis
- 12.1.1 Croda International plc
- 12.2. Market Entropy
- 12.2.1 Company's Key Areas Served
- 12.2.2 Recent Developments
- 12.3. Company Market Share Analysis 2025
- 12.3.1 Top 5 Companies Market Share Analysis
- 12.3.2 Top 3 Companies Market Share Analysis
- 12.4. List of Potential Customers
- 13. Research Methodology
List of Figures
- Figure 1: Global Ceramic Dispersant Revenue Breakdown (billion, %) by Region 2025 & 2033
- Figure 2: Global Ceramic Dispersant Volume Breakdown (K, %) by Region 2025 & 2033
- Figure 3: North America Ceramic Dispersant Revenue (billion), by Application 2025 & 2033
- Figure 4: North America Ceramic Dispersant Volume (K), by Application 2025 & 2033
- Figure 5: North America Ceramic Dispersant Revenue Share (%), by Application 2025 & 2033
- Figure 6: North America Ceramic Dispersant Volume Share (%), by Application 2025 & 2033
- Figure 7: North America Ceramic Dispersant Revenue (billion), by Type 2025 & 2033
- Figure 8: North America Ceramic Dispersant Volume (K), by Type 2025 & 2033
- Figure 9: North America Ceramic Dispersant Revenue Share (%), by Type 2025 & 2033
- Figure 10: North America Ceramic Dispersant Volume Share (%), by Type 2025 & 2033
- Figure 11: North America Ceramic Dispersant Revenue (billion), by Country 2025 & 2033
- Figure 12: North America Ceramic Dispersant Volume (K), by Country 2025 & 2033
- Figure 13: North America Ceramic Dispersant Revenue Share (%), by Country 2025 & 2033
- Figure 14: North America Ceramic Dispersant Volume Share (%), by Country 2025 & 2033
- Figure 15: South America Ceramic Dispersant Revenue (billion), by Application 2025 & 2033
- Figure 16: South America Ceramic Dispersant Volume (K), by Application 2025 & 2033
- Figure 17: South America Ceramic Dispersant Revenue Share (%), by Application 2025 & 2033
- Figure 18: South America Ceramic Dispersant Volume Share (%), by Application 2025 & 2033
- Figure 19: South America Ceramic Dispersant Revenue (billion), by Type 2025 & 2033
- Figure 20: South America Ceramic Dispersant Volume (K), by Type 2025 & 2033
- Figure 21: South America Ceramic Dispersant Revenue Share (%), by Type 2025 & 2033
- Figure 22: South America Ceramic Dispersant Volume Share (%), by Type 2025 & 2033
- Figure 23: South America Ceramic Dispersant Revenue (billion), by Country 2025 & 2033
- Figure 24: South America Ceramic Dispersant Volume (K), by Country 2025 & 2033
- Figure 25: South America Ceramic Dispersant Revenue Share (%), by Country 2025 & 2033
- Figure 26: South America Ceramic Dispersant Volume Share (%), by Country 2025 & 2033
- Figure 27: Europe Ceramic Dispersant Revenue (billion), by Application 2025 & 2033
- Figure 28: Europe Ceramic Dispersant Volume (K), by Application 2025 & 2033
- Figure 29: Europe Ceramic Dispersant Revenue Share (%), by Application 2025 & 2033
- Figure 30: Europe Ceramic Dispersant Volume Share (%), by Application 2025 & 2033
- Figure 31: Europe Ceramic Dispersant Revenue (billion), by Type 2025 & 2033
- Figure 32: Europe Ceramic Dispersant Volume (K), by Type 2025 & 2033
- Figure 33: Europe Ceramic Dispersant Revenue Share (%), by Type 2025 & 2033
- Figure 34: Europe Ceramic Dispersant Volume Share (%), by Type 2025 & 2033
- Figure 35: Europe Ceramic Dispersant Revenue (billion), by Country 2025 & 2033
- Figure 36: Europe Ceramic Dispersant Volume (K), by Country 2025 & 2033
- Figure 37: Europe Ceramic Dispersant Revenue Share (%), by Country 2025 & 2033
- Figure 38: Europe Ceramic Dispersant Volume Share (%), by Country 2025 & 2033
- Figure 39: Middle East & Africa Ceramic Dispersant Revenue (billion), by Application 2025 & 2033
- Figure 40: Middle East & Africa Ceramic Dispersant Volume (K), by Application 2025 & 2033
- Figure 41: Middle East & Africa Ceramic Dispersant Revenue Share (%), by Application 2025 & 2033
- Figure 42: Middle East & Africa Ceramic Dispersant Volume Share (%), by Application 2025 & 2033
- Figure 43: Middle East & Africa Ceramic Dispersant Revenue (billion), by Type 2025 & 2033
- Figure 44: Middle East & Africa Ceramic Dispersant Volume (K), by Type 2025 & 2033
- Figure 45: Middle East & Africa Ceramic Dispersant Revenue Share (%), by Type 2025 & 2033
- Figure 46: Middle East & Africa Ceramic Dispersant Volume Share (%), by Type 2025 & 2033
- Figure 47: Middle East & Africa Ceramic Dispersant Revenue (billion), by Country 2025 & 2033
- Figure 48: Middle East & Africa Ceramic Dispersant Volume (K), by Country 2025 & 2033
- Figure 49: Middle East & Africa Ceramic Dispersant Revenue Share (%), by Country 2025 & 2033
- Figure 50: Middle East & Africa Ceramic Dispersant Volume Share (%), by Country 2025 & 2033
- Figure 51: Asia Pacific Ceramic Dispersant Revenue (billion), by Application 2025 & 2033
- Figure 52: Asia Pacific Ceramic Dispersant Volume (K), by Application 2025 & 2033
- Figure 53: Asia Pacific Ceramic Dispersant Revenue Share (%), by Application 2025 & 2033
- Figure 54: Asia Pacific Ceramic Dispersant Volume Share (%), by Application 2025 & 2033
- Figure 55: Asia Pacific Ceramic Dispersant Revenue (billion), by Type 2025 & 2033
- Figure 56: Asia Pacific Ceramic Dispersant Volume (K), by Type 2025 & 2033
- Figure 57: Asia Pacific Ceramic Dispersant Revenue Share (%), by Type 2025 & 2033
- Figure 58: Asia Pacific Ceramic Dispersant Volume Share (%), by Type 2025 & 2033
- Figure 59: Asia Pacific Ceramic Dispersant Revenue (billion), by Country 2025 & 2033
- Figure 60: Asia Pacific Ceramic Dispersant Volume (K), by Country 2025 & 2033
- Figure 61: Asia Pacific Ceramic Dispersant Revenue Share (%), by Country 2025 & 2033
- Figure 62: Asia Pacific Ceramic Dispersant Volume Share (%), by Country 2025 & 2033
List of Tables
- Table 1: Global Ceramic Dispersant Revenue billion Forecast, by Application 2020 & 2033
- Table 2: Global Ceramic Dispersant Volume K Forecast, by Application 2020 & 2033
- Table 3: Global Ceramic Dispersant Revenue billion Forecast, by Type 2020 & 2033
- Table 4: Global Ceramic Dispersant Volume K Forecast, by Type 2020 & 2033
- Table 5: Global Ceramic Dispersant Revenue billion Forecast, by Region 2020 & 2033
- Table 6: Global Ceramic Dispersant Volume K Forecast, by Region 2020 & 2033
- Table 7: Global Ceramic Dispersant Revenue billion Forecast, by Application 2020 & 2033
- Table 8: Global Ceramic Dispersant Volume K Forecast, by Application 2020 & 2033
- Table 9: Global Ceramic Dispersant Revenue billion Forecast, by Type 2020 & 2033
- Table 10: Global Ceramic Dispersant Volume K Forecast, by Type 2020 & 2033
- Table 11: Global Ceramic Dispersant Revenue billion Forecast, by Country 2020 & 2033
- Table 12: Global Ceramic Dispersant Volume K Forecast, by Country 2020 & 2033
- Table 13: United States Ceramic Dispersant Revenue (billion) Forecast, by Application 2020 & 2033
- Table 14: United States Ceramic Dispersant Volume (K) Forecast, by Application 2020 & 2033
- Table 15: Canada Ceramic Dispersant Revenue (billion) Forecast, by Application 2020 & 2033
- Table 16: Canada Ceramic Dispersant Volume (K) Forecast, by Application 2020 & 2033
- Table 17: Mexico Ceramic Dispersant Revenue (billion) Forecast, by Application 2020 & 2033
- Table 18: Mexico Ceramic Dispersant Volume (K) Forecast, by Application 2020 & 2033
- Table 19: Global Ceramic Dispersant Revenue billion Forecast, by Application 2020 & 2033
- Table 20: Global Ceramic Dispersant Volume K Forecast, by Application 2020 & 2033
- Table 21: Global Ceramic Dispersant Revenue billion Forecast, by Type 2020 & 2033
- Table 22: Global Ceramic Dispersant Volume K Forecast, by Type 2020 & 2033
- Table 23: Global Ceramic Dispersant Revenue billion Forecast, by Country 2020 & 2033
- Table 24: Global Ceramic Dispersant Volume K Forecast, by Country 2020 & 2033
- Table 25: Brazil Ceramic Dispersant Revenue (billion) Forecast, by Application 2020 & 2033
- Table 26: Brazil Ceramic Dispersant Volume (K) Forecast, by Application 2020 & 2033
- Table 27: Argentina Ceramic Dispersant Revenue (billion) Forecast, by Application 2020 & 2033
- Table 28: Argentina Ceramic Dispersant Volume (K) Forecast, by Application 2020 & 2033
- Table 29: Rest of South America Ceramic Dispersant Revenue (billion) Forecast, by Application 2020 & 2033
- Table 30: Rest of South America Ceramic Dispersant Volume (K) Forecast, by Application 2020 & 2033
- Table 31: Global Ceramic Dispersant Revenue billion Forecast, by Application 2020 & 2033
- Table 32: Global Ceramic Dispersant Volume K Forecast, by Application 2020 & 2033
- Table 33: Global Ceramic Dispersant Revenue billion Forecast, by Type 2020 & 2033
- Table 34: Global Ceramic Dispersant Volume K Forecast, by Type 2020 & 2033
- Table 35: Global Ceramic Dispersant Revenue billion Forecast, by Country 2020 & 2033
- Table 36: Global Ceramic Dispersant Volume K Forecast, by Country 2020 & 2033
- Table 37: United Kingdom Ceramic Dispersant Revenue (billion) Forecast, by Application 2020 & 2033
- Table 38: United Kingdom Ceramic Dispersant Volume (K) Forecast, by Application 2020 & 2033
- Table 39: Germany Ceramic Dispersant Revenue (billion) Forecast, by Application 2020 & 2033
- Table 40: Germany Ceramic Dispersant Volume (K) Forecast, by Application 2020 & 2033
- Table 41: France Ceramic Dispersant Revenue (billion) Forecast, by Application 2020 & 2033
- Table 42: France Ceramic Dispersant Volume (K) Forecast, by Application 2020 & 2033
- Table 43: Italy Ceramic Dispersant Revenue (billion) Forecast, by Application 2020 & 2033
- Table 44: Italy Ceramic Dispersant Volume (K) Forecast, by Application 2020 & 2033
- Table 45: Spain Ceramic Dispersant Revenue (billion) Forecast, by Application 2020 & 2033
- Table 46: Spain Ceramic Dispersant Volume (K) Forecast, by Application 2020 & 2033
- Table 47: Russia Ceramic Dispersant Revenue (billion) Forecast, by Application 2020 & 2033
- Table 48: Russia Ceramic Dispersant Volume (K) Forecast, by Application 2020 & 2033
- Table 49: Benelux Ceramic Dispersant Revenue (billion) Forecast, by Application 2020 & 2033
- Table 50: Benelux Ceramic Dispersant Volume (K) Forecast, by Application 2020 & 2033
- Table 51: Nordics Ceramic Dispersant Revenue (billion) Forecast, by Application 2020 & 2033
- Table 52: Nordics Ceramic Dispersant Volume (K) Forecast, by Application 2020 & 2033
- Table 53: Rest of Europe Ceramic Dispersant Revenue (billion) Forecast, by Application 2020 & 2033
- Table 54: Rest of Europe Ceramic Dispersant Volume (K) Forecast, by Application 2020 & 2033
- Table 55: Global Ceramic Dispersant Revenue billion Forecast, by Application 2020 & 2033
- Table 56: Global Ceramic Dispersant Volume K Forecast, by Application 2020 & 2033
- Table 57: Global Ceramic Dispersant Revenue billion Forecast, by Type 2020 & 2033
- Table 58: Global Ceramic Dispersant Volume K Forecast, by Type 2020 & 2033
- Table 59: Global Ceramic Dispersant Revenue billion Forecast, by Country 2020 & 2033
- Table 60: Global Ceramic Dispersant Volume K Forecast, by Country 2020 & 2033
- Table 61: Turkey Ceramic Dispersant Revenue (billion) Forecast, by Application 2020 & 2033
- Table 62: Turkey Ceramic Dispersant Volume (K) Forecast, by Application 2020 & 2033
- Table 63: Israel Ceramic Dispersant Revenue (billion) Forecast, by Application 2020 & 2033
- Table 64: Israel Ceramic Dispersant Volume (K) Forecast, by Application 2020 & 2033
- Table 65: GCC Ceramic Dispersant Revenue (billion) Forecast, by Application 2020 & 2033
- Table 66: GCC Ceramic Dispersant Volume (K) Forecast, by Application 2020 & 2033
- Table 67: North Africa Ceramic Dispersant Revenue (billion) Forecast, by Application 2020 & 2033
- Table 68: North Africa Ceramic Dispersant Volume (K) Forecast, by Application 2020 & 2033
- Table 69: South Africa Ceramic Dispersant Revenue (billion) Forecast, by Application 2020 & 2033
- Table 70: South Africa Ceramic Dispersant Volume (K) Forecast, by Application 2020 & 2033
- Table 71: Rest of Middle East & Africa Ceramic Dispersant Revenue (billion) Forecast, by Application 2020 & 2033
- Table 72: Rest of Middle East & Africa Ceramic Dispersant Volume (K) Forecast, by Application 2020 & 2033
- Table 73: Global Ceramic Dispersant Revenue billion Forecast, by Application 2020 & 2033
- Table 74: Global Ceramic Dispersant Volume K Forecast, by Application 2020 & 2033
- Table 75: Global Ceramic Dispersant Revenue billion Forecast, by Type 2020 & 2033
- Table 76: Global Ceramic Dispersant Volume K Forecast, by Type 2020 & 2033
- Table 77: Global Ceramic Dispersant Revenue billion Forecast, by Country 2020 & 2033
- Table 78: Global Ceramic Dispersant Volume K Forecast, by Country 2020 & 2033
- Table 79: China Ceramic Dispersant Revenue (billion) Forecast, by Application 2020 & 2033
- Table 80: China Ceramic Dispersant Volume (K) Forecast, by Application 2020 & 2033
- Table 81: India Ceramic Dispersant Revenue (billion) Forecast, by Application 2020 & 2033
- Table 82: India Ceramic Dispersant Volume (K) Forecast, by Application 2020 & 2033
- Table 83: Japan Ceramic Dispersant Revenue (billion) Forecast, by Application 2020 & 2033
- Table 84: Japan Ceramic Dispersant Volume (K) Forecast, by Application 2020 & 2033
- Table 85: South Korea Ceramic Dispersant Revenue (billion) Forecast, by Application 2020 & 2033
- Table 86: South Korea Ceramic Dispersant Volume (K) Forecast, by Application 2020 & 2033
- Table 87: ASEAN Ceramic Dispersant Revenue (billion) Forecast, by Application 2020 & 2033
- Table 88: ASEAN Ceramic Dispersant Volume (K) Forecast, by Application 2020 & 2033
- Table 89: Oceania Ceramic Dispersant Revenue (billion) Forecast, by Application 2020 & 2033
- Table 90: Oceania Ceramic Dispersant Volume (K) Forecast, by Application 2020 & 2033
- Table 91: Rest of Asia Pacific Ceramic Dispersant Revenue (billion) Forecast, by Application 2020 & 2033
- Table 92: Rest of Asia Pacific Ceramic Dispersant Volume (K) Forecast, by Application 2020 & 2033
Frequently Asked Questions
1. What is the projected Compound Annual Growth Rate (CAGR) of the Ceramic Dispersant?
The projected CAGR is approximately 5.4%.
2. Which companies are prominent players in the Ceramic Dispersant?
Key companies in the market include Croda International plc, Sanyo Chemical Industries, Lubrizol, Shandong Kairui Chemistry, Solvay, Dow, Kao Corporation, NOF Corporation, San Nopco, JAS Global Industries, Vanderbilt Minerals LLC, Pflaumer, Shandong Taihe Technologies, Chukyo Yushi.
3. What are the main segments of the Ceramic Dispersant?
The market segments include Application, Type.
4. Can you provide details about the market size?
The market size is estimated to be USD 2.5 billion as of 2022.
5. What are some drivers contributing to market growth?
N/A
6. What are the notable trends driving market growth?
N/A
7. Are there any restraints impacting market growth?
N/A
8. Can you provide examples of recent developments in the market?
N/A
9. What pricing options are available for accessing the report?
Pricing options include single-user, multi-user, and enterprise licenses priced at USD 3950.00, USD 5925.00, and USD 7900.00 respectively.
10. Is the market size provided in terms of value or volume?
The market size is provided in terms of value, measured in billion and volume, measured in K.
11. Are there any specific market keywords associated with the report?
Yes, the market keyword associated with the report is "Ceramic Dispersant," which aids in identifying and referencing the specific market segment covered.
12. How do I determine which pricing option suits my needs best?
The pricing options vary based on user requirements and access needs. Individual users may opt for single-user licenses, while businesses requiring broader access may choose multi-user or enterprise licenses for cost-effective access to the report.
13. Are there any additional resources or data provided in the Ceramic Dispersant report?
While the report offers comprehensive insights, it's advisable to review the specific contents or supplementary materials provided to ascertain if additional resources or data are available.
14. How can I stay updated on further developments or reports in the Ceramic Dispersant?
To stay informed about further developments, trends, and reports in the Ceramic Dispersant, consider subscribing to industry newsletters, following relevant companies and organizations, or regularly checking reputable industry news sources and publications.
Methodology
Step 1 - Identification of Relevant Samples Size from Population Database


Step 2 - Approaches for Defining Global Market Size (Value, Volume* & Price*)

Note*: In applicable scenarios
Step 3 - Data Sources
Primary Research
- Web Analytics
- Survey Reports
- Research Institute
- Latest Research Reports
- Opinion Leaders
Secondary Research
- Annual Reports
- White Paper
- Latest Press Release
- Industry Association
- Paid Database
- Investor Presentations

Step 4 - Data Triangulation
Involves using different sources of information in order to increase the validity of a study
These sources are likely to be stakeholders in a program - participants, other researchers, program staff, other community members, and so on.
Then we put all data in single framework & apply various statistical tools to find out the dynamic on the market.
During the analysis stage, feedback from the stakeholder groups would be compared to determine areas of agreement as well as areas of divergence