

Key Insights into the Ceramic Solutions Market
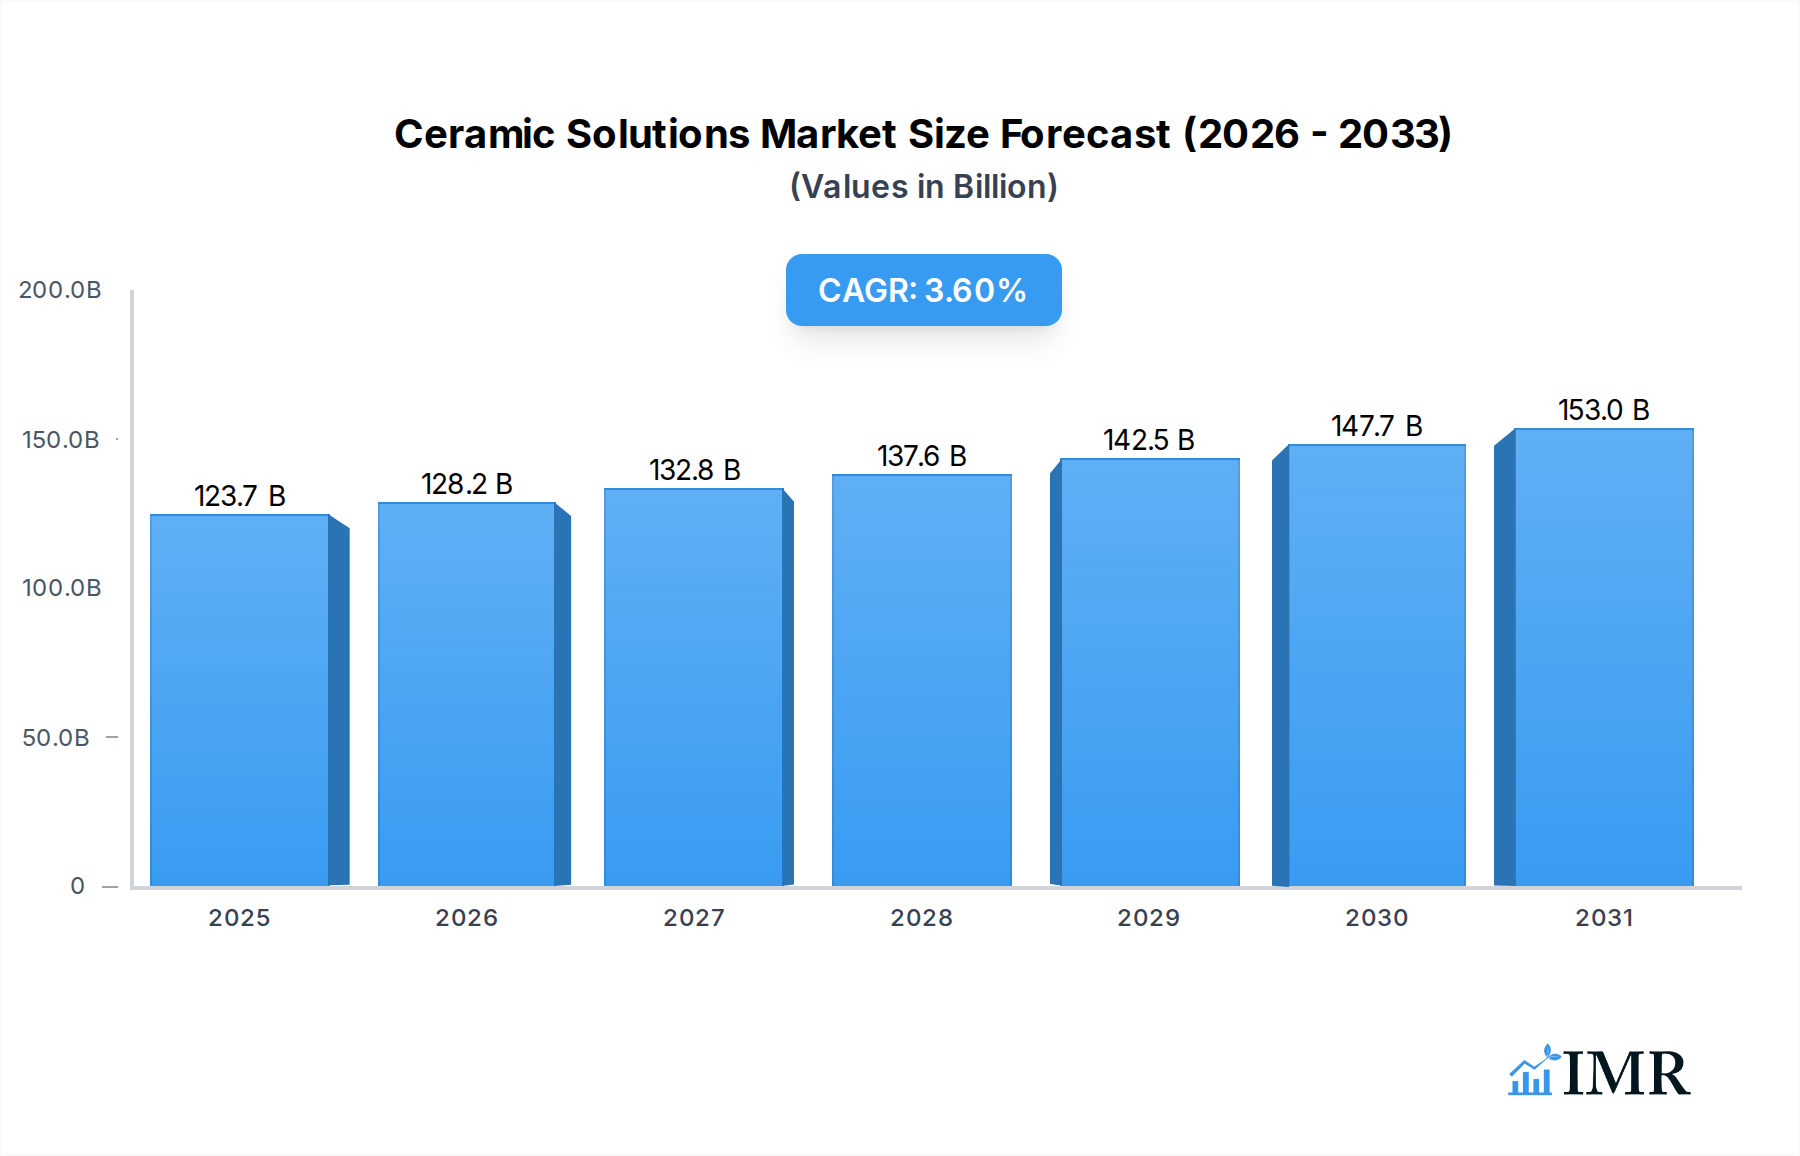
The global Ceramic Solutions Market is poised for substantial expansion, valued at an impressive $119.44 billion in 2025. Projections indicate a steady compound annual growth rate (CAGR) of 3.6% through 2032, expected to elevate the market size to approximately $153.25 billion. This growth trajectory is underpinned by the increasing demand for high-performance materials across diverse industrial verticals. Ceramic solutions, encompassing a wide array of products from advanced structural components to specialized coatings, are integral to enhancing durability, efficiency, and operational capabilities in demanding environments.
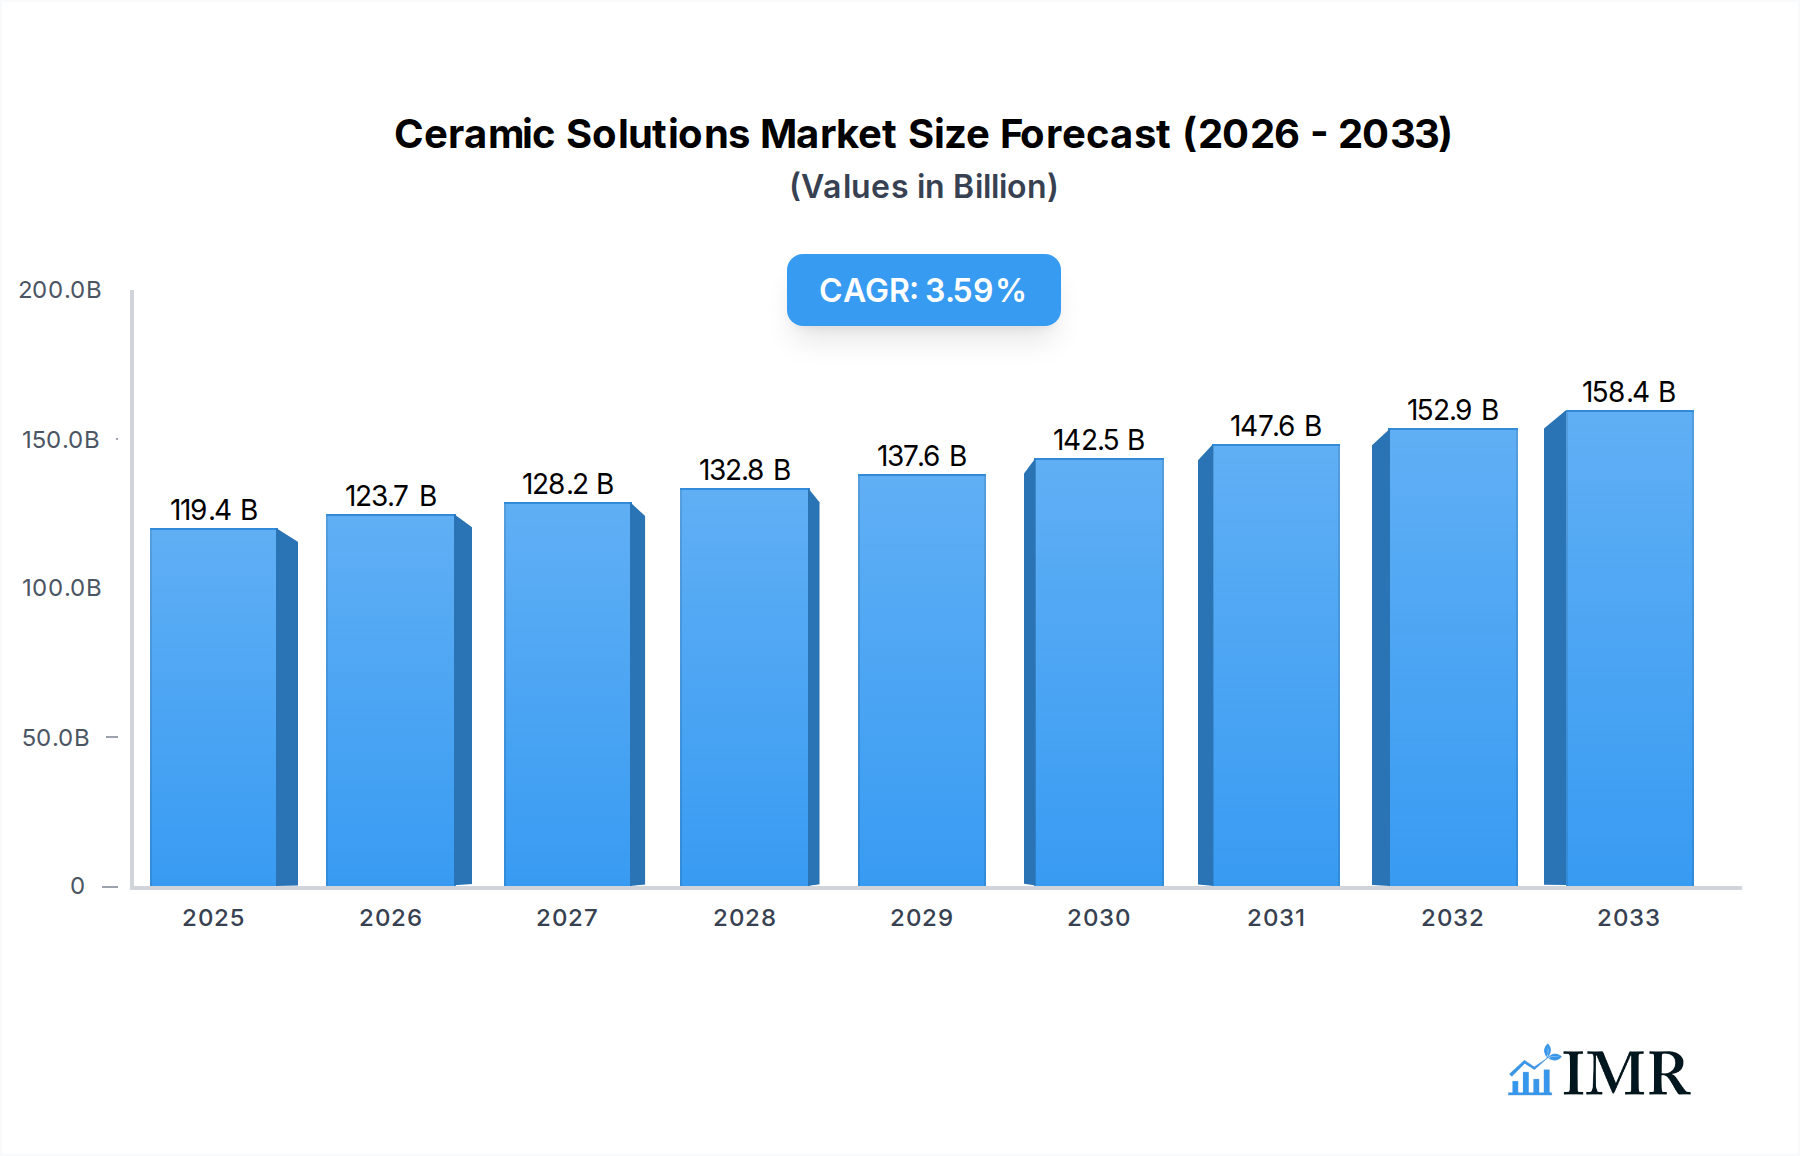
Ceramic Solutions Market Size (In Billion)
Key demand drivers include the relentless pursuit of miniaturization and superior performance in the Electronics & Semiconductors Market, where ceramic substrates and packaging are critical for thermal management and electrical insulation. The Automotive sector's shift towards electric vehicles (EVs) and autonomous driving systems necessitates lightweight, wear-resistant, and high-temperature-tolerant ceramic components. Similarly, the Aerospace & Defense Market continues to adopt ceramic matrix composites for engine parts and structural components due to their exceptional strength-to-weight ratio and ability to withstand extreme conditions. Furthermore, advancements in medical technology, including prosthetics and dental implants, are fueling the demand for biocompatible ceramic solutions.
Ceramic Solutions Company Market Share
Macroeconomic tailwinds such as escalating investments in infrastructure development, increasing research and development (R&D) in material science, and stringent regulatory requirements for environmental protection (e.g., emission reduction, energy efficiency) are further accelerating market expansion. The growing prominence of the Asia Pacific region as a manufacturing hub and a significant consumer of advanced materials is expected to contribute disproportionately to market growth. The strategic adoption of ceramic solutions for critical applications, coupled with continuous innovation in material synthesis and processing technologies, ensures a robust forward-looking outlook for this essential market.
Dominant Product Type Segment in Ceramic Solutions Market
Within the multifaceted Ceramic Solutions Market, the Monolithic Ceramics Market segment stands out as the predominant category, commanding the largest revenue share. This dominance stems from the foundational role monolithic ceramics play across an extensive range of industrial and consumer applications, leveraging their inherent properties such as high hardness, chemical inertness, excellent thermal stability, and electrical insulation capabilities. These traditional ceramics, often produced through powder compaction and sintering processes, are widely utilized in applications where structural integrity and resistance to wear, corrosion, and high temperatures are paramount. Examples include kiln furniture, grinding media, industrial pump seals, and high-voltage insulators, all of which represent long-established and consistently high-volume applications.
The enduring market leadership of Monolithic Ceramics Market is attributable to several factors. Firstly, the maturity of manufacturing processes for these materials, particularly those based on Alumina Market and Silicon Carbide, allows for cost-effective mass production and consistent quality. This makes them economically viable for a broad spectrum of uses where more complex or newer ceramic forms might be over-engineered or prohibitively expensive. Secondly, ongoing incremental innovations in processing techniques, such as improved densification methods and surface finishing, continue to enhance their performance characteristics, ensuring their relevance even as advanced alternatives emerge. Major players like Kyocera Corporation, Morgan Advanced Materials PLC, and CeramTec GmbH have built extensive portfolios and manufacturing capacities around monolithic ceramic products, solidifying their market position through global supply networks and application-specific expertise.
While newer segments like the Ceramic Matrix Composites Market are experiencing rapid growth due to their specialized high-performance niche, the sheer volume and widespread adoption of Monolithic Ceramics Market ensures its continued dominance. Its share, while perhaps facing slight erosion from faster-growing, specialized segments, remains significant and resilient, driven by core industrial demand and applications that prioritize cost-efficiency and proven reliability. The consistent demand from sectors such as industrial machinery, electrical power transmission, and general engineering provides a stable revenue base, making it a critical foundation for the broader Ceramic Solutions Market. Continued investment in optimizing the performance-to-cost ratio for these materials will ensure the Monolithic Ceramics Market maintains its central role in the industry's landscape.
Key Market Drivers & Strategic Imperatives in Ceramic Solutions Market
The Ceramic Solutions Market is fundamentally driven by a confluence of technological advancements and industrial necessities, mandating specific material properties unattainable by conventional alternatives. A primary driver is the accelerating demand for materials capable of operating under extreme conditions, exemplified by the growth in high-temperature applications. For instance, in gas turbines and rocket engines, ceramic solutions provide crucial thermal barrier coatings, allowing for higher operating temperatures and thus improved fuel efficiency and power output. The integration of advanced ceramics in these environments directly contributes to the global push for energy efficiency and reduced carbon emissions.
Another significant impetus is the miniaturization trend across the Electronics & Semiconductors Market. As electronic devices become smaller and more powerful, the need for thermally conductive, electrically insulating, and dimensionally stable substrates and packaging materials becomes critical. Ceramic materials, particularly Alumina Market and Zirconia, offer superior dielectric properties and heat dissipation capabilities compared to polymer-based alternatives, enabling the development of high-density integrated circuits and advanced sensor technologies. This imperative for enhanced thermal management solutions Market in microelectronics is a constant driver for innovation in ceramic solutions.
Furthermore, the increasing emphasis on lightweighting in the Automotive and Aerospace & Defense Market sectors serves as a potent growth catalyst. Ceramic Matrix Composites Market offer a superior strength-to-weight ratio compared to metals, leading to significant mass reduction in components like brake discs, engine valves, and aircraft structural parts. This reduction directly translates to fuel savings and improved performance, aligning with stringent regulatory standards for vehicle emissions and operational efficiency. The persistent threat of corrosion and wear in aggressive industrial environments also fuels demand, with ceramic coatings extending the lifespan of critical components in chemical processing plants and industrial pumps, thereby reducing maintenance costs and operational downtime across a multitude of industries.
Competitive Ecosystem of Ceramic Solutions Market
The Ceramic Solutions Market is characterized by a dynamic competitive landscape, featuring a mix of large multinational corporations and specialized niche players. Strategic advancements in material science and application engineering are key differentiators among the leading entities.
- CoorsTek, LLC: A global leader in engineered ceramic components, providing highly technical solutions for a wide range of industries including aerospace, defense, medical, automotive, and semiconductor, with a strong focus on advanced ceramic materials and manufacturing expertise.
- Ortech, Inc.: Specializes in the custom manufacturing of industrial ceramic products, offering solutions tailored for high-temperature, wear, and corrosion applications across various sectors, emphasizing precision and durability.
- Kyocera Corporation: A diversified technology giant, deeply entrenched in the Ceramic Solutions Market with a vast portfolio spanning fine ceramics for industrial components, electronic devices, and automotive parts, known for its extensive R&D capabilities.
- Morgan Advanced Materials PLC: A world leader in advanced materials technology, focusing on carbon, ceramic, and composite materials for thermal, electrical, and mechanical applications across demanding industries, including aerospace, defense, and healthcare.
- CeramTec GmbH: A major international manufacturer of advanced ceramics, renowned for its high-performance ceramic components for medical technology, automotive, electronics, and mechanical engineering, emphasizing innovation and precision engineering.
- Saint-Gobain S.A.: A global leader in lightweight and sustainable construction, Saint-Gobain also has a significant presence in high-performance materials, including advanced ceramics for industrial and technical applications, leveraging its broad material science expertise.
- 3M Company: A diversified technology company, 3M contributes to the Ceramic Solutions Market with innovative materials and solutions, including ceramic abrasives, filters, and functional coatings used across industrial, healthcare, and safety markets.
- NGK Insulators, Ltd.: A Japanese company known for its ceramic technologies, particularly in electrical insulators, automotive components (like ceramic filters), and environmental ceramics, with a strong focus on energy and environmental solutions.
- SCHOTT AG: A multinational technology company specializing in glass and glass-ceramics, SCHOTT provides advanced material solutions for industries such as household appliances, optics, electronics, and pharmaceuticals, including specialized ceramic-glass composites.
- Rauschert GmbH & Co. KG: A family-owned company specializing in technical ceramics and plastic parts, offering a wide range of products for electrical, mechanical, and thermal applications, with a focus on custom solutions and quality.
- Elan Technology: An expert in manufacturing precision technical ceramic components, serving diverse markets including medical, aerospace, and defense, known for its capability in custom ceramic fabrication and material development.
- Blasch Precision Ceramics: A leader in manufacturing intricate, refractory ceramic shapes, specializing in custom-designed components for demanding high-temperature applications in metallurgy, chemical processing, and power generation.
- AdTech Ceramics Company: A key player in advanced ceramic packaging and interconnect solutions, primarily serving the aerospace, defense, and medical markets with high-reliability ceramic substrates and hermetic packages.
Recent Developments & Milestones in Ceramic Solutions Market
Recent advancements and strategic movements within the Ceramic Solutions Market underscore a dynamic environment of innovation, collaboration, and expansion, driven by the increasing integration of advanced materials across high-growth sectors.
- May 2024: A leading European ceramics manufacturer announced a significant investment of $75 million in a new production facility dedicated to Alumina Market and Zirconia-based components, primarily targeting the burgeoning electric vehicle battery and medical device sectors. This expansion aims to enhance capacity for high-precision ceramic solutions.
- March 2024: Researchers unveiled a breakthrough in the development of self-healing Ceramic Coatings Market, utilizing embedded microcapsules that release reparative agents upon crack formation. This innovation holds immense promise for extending the lifespan of components in demanding environments such as aerospace and industrial machinery.
- January 2024: A prominent player in the Aerospace & Defense Market partnered with a specialized materials science company to co-develop next-generation Ceramic Matrix Composites Market for high-thrust engine components. This collaboration focuses on reducing weight and improving thermal resistance for future aircraft designs, with initial prototypes expected by late 2025.
- November 2023: A major Asian electronics conglomerate introduced new ceramic substrates with enhanced thermal conductivity for high-power semiconductor devices, directly addressing the growing thermal management needs in the advanced Electronics & Semiconductors Market.
- August 2023: Several industry leaders formed a consortium to establish standardized testing protocols for advanced technical ceramics, aiming to accelerate the adoption of new materials by ensuring consistent quality and performance metrics across the Ceramic Solutions Market.
- June 2023: A start-up specializing in additive manufacturing for ceramics successfully raised $20 million in Series B funding to scale its production of complex Monolithic Ceramics Market components for medical and industrial applications, demonstrating growing investor confidence in ceramic 3D printing technologies.
Regional Market Breakdown for Ceramic Solutions Market
The global Ceramic Solutions Market exhibits distinct regional dynamics, influenced by industrialization, technological adoption, and investment in R&D. Asia Pacific currently leads the market, holding the largest revenue share and also registering as the fastest-growing region. This dominance is primarily driven by extensive manufacturing capabilities in countries like China, Japan, South Korea, and India, which are major producers and consumers in the Electronics & Semiconductors Market, automotive, and industrial sectors. The region's focus on infrastructure development, coupled with increasing investments in advanced materials research, positions it for continued expansion, with an estimated regional CAGR potentially exceeding 4.5% over the forecast period. The demand for ceramic solutions for consumer electronics and a rapidly expanding middle class further contribute to this robust growth.
North America represents a significant and mature segment of the Ceramic Solutions Market. Driven by a strong Aerospace & Defense Market, sophisticated medical device manufacturing, and high-tech industrial applications, the region focuses on high-value, high-performance ceramic solutions. The United States, in particular, leads in innovation for Ceramic Matrix Composites Market and specialized Alumina Market applications. While its growth rate is more moderate compared to Asia Pacific, estimated at around 3.0%, its substantial existing industrial base ensures a consistent demand for advanced ceramic materials for critical components requiring extreme durability and performance.
Europe, another mature market, accounts for a substantial share, fueled by its strong automotive, industrial machinery, and healthcare sectors. Countries like Germany, France, and the UK are at the forefront of ceramic research and development, particularly in areas like advanced Ceramic Coatings Market for wear and corrosion resistance. The region's emphasis on sustainable manufacturing and energy efficiency also propels demand for ceramic solutions. Europe's Ceramic Solutions Market is projected to grow at a CAGR of approximately 2.8%, with a focus on specialized applications and technological upgrades.
Conversely, the Middle East & Africa region currently holds a smaller share but is poised for emerging growth. Investments in oil & gas, infrastructure, and diversification into manufacturing sectors are creating new opportunities for ceramic solutions, particularly for applications requiring wear and corrosion resistance in harsh environments. While specific CAGR data varies, the region is expected to demonstrate promising growth, albeit from a lower base, as industrialization efforts intensify.
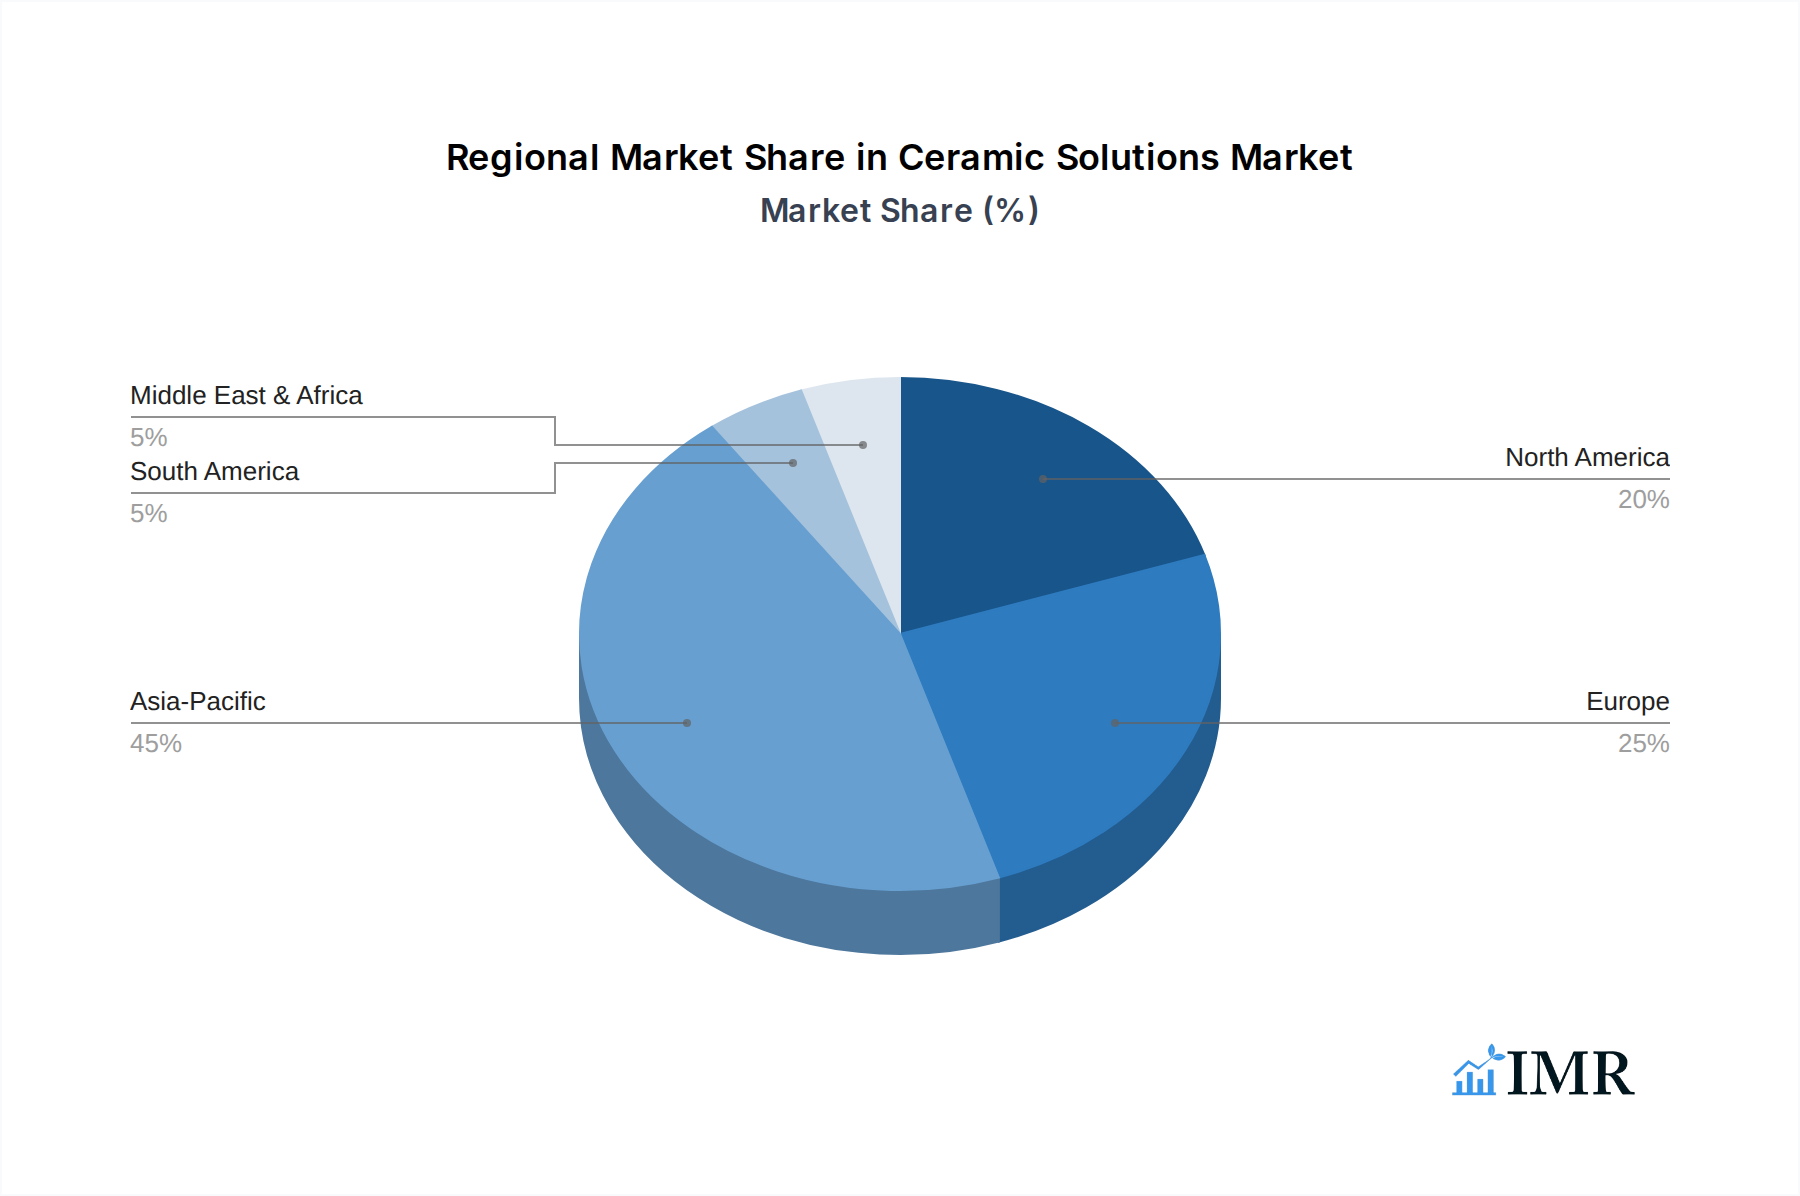
Ceramic Solutions Regional Market Share
Investment & Funding Activity in Ceramic Solutions Market
Investment and funding activity within the Ceramic Solutions Market have seen a notable uptick over the past two to three years, reflecting strategic confidence in advanced materials innovation. Venture capital and private equity firms are increasingly targeting start-ups and mid-sized companies demonstrating disruptive technologies in ceramic manufacturing and application. A significant trend observed is the heightened interest in additive manufacturing (3D printing) technologies for ceramics, attracting substantial capital due to their potential for producing complex geometries and custom solutions efficiently. For instance, several funding rounds in 2023 and 2024 focused on companies developing ceramic 3D printing processes for high-temperature and biomedical applications, signaling a shift towards agile manufacturing.
M&A activity has also been a key feature, with larger players seeking to consolidate market share, acquire specialized expertise, or expand their product portfolios. Strategic acquisitions have been noted in segments focusing on the Ceramic Matrix Composites Market, driven by the insatiable demand from the Aerospace & Defense Market and high-performance automotive sectors. These mergers aim to integrate advanced material development with established manufacturing capabilities, thereby accelerating commercialization and scalability. Furthermore, partnerships between established ceramic producers and end-user industries (e.g., medical device manufacturers, semiconductor fabricators) are fostering co-development initiatives, leveraging joint R&D to tailor ceramic solutions for specific, high-value applications.
The sub-segments attracting the most capital are those promising enhanced performance characteristics, such as advanced Alumina Market and Zirconia formulations for extreme environments, and innovative Ceramic Coatings Market for extended component lifespan. The growing urgency for Thermal Management Solutions Market in critical electronic systems and energy technologies is also a significant magnet for investment, as ceramic materials offer unparalleled properties in these areas. This consistent inflow of capital is crucial for driving R&D, scaling production capacities, and ultimately expanding the overall footprint of the Advanced Materials Market.
Supply Chain & Raw Material Dynamics for Ceramic Solutions Market
The Ceramic Solutions Market is characterized by a complex supply chain heavily reliant on the availability and stable pricing of key raw materials. Upstream dependencies primarily involve specialized ceramic powders and precursor materials such as Alumina, Silicon Carbide, Zirconia, Boron Nitride, and various rare earth elements. The sourcing of these materials presents inherent risks, including geographical concentration of mining operations, geopolitical instabilities impacting trade routes, and environmental regulations affecting extraction and processing. For instance, a significant portion of bauxite (for Alumina) and zirconium ore (for Zirconia) mining is concentrated in specific regions, creating potential single-point-of-failure risks for the global supply chain.
Price volatility of these key inputs has historically affected profit margins within the Ceramic Solutions Market. Economic cycles, demand surges from adjacent industries like refractories or abrasives, and speculative trading can lead to unpredictable price fluctuations. For example, the price of high-purity Alumina Market can fluctuate based on global aluminum demand and energy costs associated with its refining. Similarly, Silicon Carbide Market precursors can be impacted by the broader industrial chemicals market. Manufacturers often employ long-term supply contracts or maintain strategic reserves to mitigate these risks, but smaller players remain vulnerable.
Supply chain disruptions, such as those witnessed during global pandemics or major geopolitical conflicts, have demonstrably impacted the Ceramic Solutions Market. These disruptions have led to increased lead times, inflated shipping costs, and, in some cases, temporary shortages of specialized powders or manufacturing components. This has spurred a trend towards regionalized sourcing strategies and increased vertical integration among larger companies to exert greater control over their material inputs. The drive for sustainability also influences raw material dynamics, with growing pressure to source materials responsibly and incorporate recycled content, which can introduce new complexities and cost structures into the supply chain.
Ceramic Solutions Segmentation
-
1. Product Type
- 1.1. Monolithic Ceramics
- 1.2. Ceramic Coatings
- 1.3. Ceramic Matrix Composites
- 1.4. Ceramic Powders
-
2. Material Type
- 2.1. Alumina
- 2.2. Silicon Carbide
- 2.3. Zirconia
-
3. Application
- 3.1. Electrical Insulation
- 3.2. Thermal Barrier
- 3.3. Wear Resistance
- 3.4. Corrosion Resistance
- 3.5. Others
-
4. End User Industry
- 4.1. Electronics & Semiconductors
- 4.2. Automotive
- 4.3. Healthcare & Medical
- 4.4. Industrial & Machinery
- 4.5. Aerospace & Defense
- 4.6. Chemical & Petrochemical
- 4.7. Others
-
5. Sales Channel
- 5.1. Direct Sales
- 5.2. Distributors & Wholesalers
- 5.3. Online
Ceramic Solutions Segmentation By Geography
-
1. North America
- 1.1. United States
- 1.2. Canada
- 1.3. Mexico
-
2. South America
- 2.1. Brazil
- 2.2. Argentina
- 2.3. Rest of South America
-
3. Europe
- 3.1. United Kingdom
- 3.2. Germany
- 3.3. France
- 3.4. Italy
- 3.5. Spain
- 3.6. Russia
- 3.7. Benelux
- 3.8. Nordics
- 3.9. Rest of Europe
-
4. Middle East & Africa
- 4.1. Turkey
- 4.2. Israel
- 4.3. GCC
- 4.4. North Africa
- 4.5. South Africa
- 4.6. Rest of Middle East & Africa
-
5. Asia Pacific
- 5.1. China
- 5.2. India
- 5.3. Japan
- 5.4. South Korea
- 5.5. ASEAN
- 5.6. Oceania
- 5.7. Rest of Asia Pacific
Ceramic Solutions Regional Market Share
Geographic Coverage of Ceramic Solutions
Ceramic Solutions REPORT HIGHLIGHTS
| Aspects | Details |
|---|---|
| Study Period | 2020-2034 |
| Base Year | 2025 |
| Estimated Year | 2026 |
| Forecast Period | 2026-2034 |
| Historical Period | 2020-2025 |
| Growth Rate | CAGR of 3.6% from 2020-2034 |
| Segmentation |
|
Table of Contents
- 1. Introduction
- 1.1. Research Scope
- 1.2. Market Segmentation
- 1.3. Research Objective
- 1.4. Definitions and Assumptions
- 2. Executive Summary
- 2.1. Market Snapshot
- 3. Market Dynamics
- 3.1. Market Drivers
- 3.2. Market Restrains
- 3.3. Market Trends
- 3.4. Market Opportunities
- 4. Market Factor Analysis
- 4.1. Porters Five Forces
- 4.1.1. Bargaining Power of Suppliers
- 4.1.2. Bargaining Power of Buyers
- 4.1.3. Threat of New Entrants
- 4.1.4. Threat of Substitutes
- 4.1.5. Competitive Rivalry
- 4.2. PESTEL analysis
- 4.3. BCG Analysis
- 4.3.1. Stars (High Growth, High Market Share)
- 4.3.2. Cash Cows (Low Growth, High Market Share)
- 4.3.3. Question Mark (High Growth, Low Market Share)
- 4.3.4. Dogs (Low Growth, Low Market Share)
- 4.4. Ansoff Matrix Analysis
- 4.5. Supply Chain Analysis
- 4.6. Regulatory Landscape
- 4.7. Current Market Potential and Opportunity Assessment (TAM–SAM–SOM Framework)
- 4.8. IMR Analyst Note
- 4.1. Porters Five Forces
- 5. Market Analysis, Insights and Forecast 2021-2033
- 5.1. Market Analysis, Insights and Forecast - by Product Type
- 5.1.1. Monolithic Ceramics
- 5.1.2. Ceramic Coatings
- 5.1.3. Ceramic Matrix Composites
- 5.1.4. Ceramic Powders
- 5.2. Market Analysis, Insights and Forecast - by Material Type
- 5.2.1. Alumina
- 5.2.2. Silicon Carbide
- 5.2.3. Zirconia
- 5.3. Market Analysis, Insights and Forecast - by Application
- 5.3.1. Electrical Insulation
- 5.3.2. Thermal Barrier
- 5.3.3. Wear Resistance
- 5.3.4. Corrosion Resistance
- 5.3.5. Others
- 5.4. Market Analysis, Insights and Forecast - by End User Industry
- 5.4.1. Electronics & Semiconductors
- 5.4.2. Automotive
- 5.4.3. Healthcare & Medical
- 5.4.4. Industrial & Machinery
- 5.4.5. Aerospace & Defense
- 5.4.6. Chemical & Petrochemical
- 5.4.7. Others
- 5.5. Market Analysis, Insights and Forecast - by Sales Channel
- 5.5.1. Direct Sales
- 5.5.2. Distributors & Wholesalers
- 5.5.3. Online
- 5.6. Market Analysis, Insights and Forecast - by Region
- 5.6.1. North America
- 5.6.2. South America
- 5.6.3. Europe
- 5.6.4. Middle East & Africa
- 5.6.5. Asia Pacific
- 5.1. Market Analysis, Insights and Forecast - by Product Type
- 6. Global Ceramic Solutions Analysis, Insights and Forecast, 2021-2033
- 6.1. Market Analysis, Insights and Forecast - by Product Type
- 6.1.1. Monolithic Ceramics
- 6.1.2. Ceramic Coatings
- 6.1.3. Ceramic Matrix Composites
- 6.1.4. Ceramic Powders
- 6.2. Market Analysis, Insights and Forecast - by Material Type
- 6.2.1. Alumina
- 6.2.2. Silicon Carbide
- 6.2.3. Zirconia
- 6.3. Market Analysis, Insights and Forecast - by Application
- 6.3.1. Electrical Insulation
- 6.3.2. Thermal Barrier
- 6.3.3. Wear Resistance
- 6.3.4. Corrosion Resistance
- 6.3.5. Others
- 6.4. Market Analysis, Insights and Forecast - by End User Industry
- 6.4.1. Electronics & Semiconductors
- 6.4.2. Automotive
- 6.4.3. Healthcare & Medical
- 6.4.4. Industrial & Machinery
- 6.4.5. Aerospace & Defense
- 6.4.6. Chemical & Petrochemical
- 6.4.7. Others
- 6.5. Market Analysis, Insights and Forecast - by Sales Channel
- 6.5.1. Direct Sales
- 6.5.2. Distributors & Wholesalers
- 6.5.3. Online
- 6.1. Market Analysis, Insights and Forecast - by Product Type
- 7. North America Ceramic Solutions Analysis, Insights and Forecast, 2020-2032
- 7.1. Market Analysis, Insights and Forecast - by Product Type
- 7.1.1. Monolithic Ceramics
- 7.1.2. Ceramic Coatings
- 7.1.3. Ceramic Matrix Composites
- 7.1.4. Ceramic Powders
- 7.2. Market Analysis, Insights and Forecast - by Material Type
- 7.2.1. Alumina
- 7.2.2. Silicon Carbide
- 7.2.3. Zirconia
- 7.3. Market Analysis, Insights and Forecast - by Application
- 7.3.1. Electrical Insulation
- 7.3.2. Thermal Barrier
- 7.3.3. Wear Resistance
- 7.3.4. Corrosion Resistance
- 7.3.5. Others
- 7.4. Market Analysis, Insights and Forecast - by End User Industry
- 7.4.1. Electronics & Semiconductors
- 7.4.2. Automotive
- 7.4.3. Healthcare & Medical
- 7.4.4. Industrial & Machinery
- 7.4.5. Aerospace & Defense
- 7.4.6. Chemical & Petrochemical
- 7.4.7. Others
- 7.5. Market Analysis, Insights and Forecast - by Sales Channel
- 7.5.1. Direct Sales
- 7.5.2. Distributors & Wholesalers
- 7.5.3. Online
- 7.1. Market Analysis, Insights and Forecast - by Product Type
- 8. South America Ceramic Solutions Analysis, Insights and Forecast, 2020-2032
- 8.1. Market Analysis, Insights and Forecast - by Product Type
- 8.1.1. Monolithic Ceramics
- 8.1.2. Ceramic Coatings
- 8.1.3. Ceramic Matrix Composites
- 8.1.4. Ceramic Powders
- 8.2. Market Analysis, Insights and Forecast - by Material Type
- 8.2.1. Alumina
- 8.2.2. Silicon Carbide
- 8.2.3. Zirconia
- 8.3. Market Analysis, Insights and Forecast - by Application
- 8.3.1. Electrical Insulation
- 8.3.2. Thermal Barrier
- 8.3.3. Wear Resistance
- 8.3.4. Corrosion Resistance
- 8.3.5. Others
- 8.4. Market Analysis, Insights and Forecast - by End User Industry
- 8.4.1. Electronics & Semiconductors
- 8.4.2. Automotive
- 8.4.3. Healthcare & Medical
- 8.4.4. Industrial & Machinery
- 8.4.5. Aerospace & Defense
- 8.4.6. Chemical & Petrochemical
- 8.4.7. Others
- 8.5. Market Analysis, Insights and Forecast - by Sales Channel
- 8.5.1. Direct Sales
- 8.5.2. Distributors & Wholesalers
- 8.5.3. Online
- 8.1. Market Analysis, Insights and Forecast - by Product Type
- 9. Europe Ceramic Solutions Analysis, Insights and Forecast, 2020-2032
- 9.1. Market Analysis, Insights and Forecast - by Product Type
- 9.1.1. Monolithic Ceramics
- 9.1.2. Ceramic Coatings
- 9.1.3. Ceramic Matrix Composites
- 9.1.4. Ceramic Powders
- 9.2. Market Analysis, Insights and Forecast - by Material Type
- 9.2.1. Alumina
- 9.2.2. Silicon Carbide
- 9.2.3. Zirconia
- 9.3. Market Analysis, Insights and Forecast - by Application
- 9.3.1. Electrical Insulation
- 9.3.2. Thermal Barrier
- 9.3.3. Wear Resistance
- 9.3.4. Corrosion Resistance
- 9.3.5. Others
- 9.4. Market Analysis, Insights and Forecast - by End User Industry
- 9.4.1. Electronics & Semiconductors
- 9.4.2. Automotive
- 9.4.3. Healthcare & Medical
- 9.4.4. Industrial & Machinery
- 9.4.5. Aerospace & Defense
- 9.4.6. Chemical & Petrochemical
- 9.4.7. Others
- 9.5. Market Analysis, Insights and Forecast - by Sales Channel
- 9.5.1. Direct Sales
- 9.5.2. Distributors & Wholesalers
- 9.5.3. Online
- 9.1. Market Analysis, Insights and Forecast - by Product Type
- 10. Middle East & Africa Ceramic Solutions Analysis, Insights and Forecast, 2020-2032
- 10.1. Market Analysis, Insights and Forecast - by Product Type
- 10.1.1. Monolithic Ceramics
- 10.1.2. Ceramic Coatings
- 10.1.3. Ceramic Matrix Composites
- 10.1.4. Ceramic Powders
- 10.2. Market Analysis, Insights and Forecast - by Material Type
- 10.2.1. Alumina
- 10.2.2. Silicon Carbide
- 10.2.3. Zirconia
- 10.3. Market Analysis, Insights and Forecast - by Application
- 10.3.1. Electrical Insulation
- 10.3.2. Thermal Barrier
- 10.3.3. Wear Resistance
- 10.3.4. Corrosion Resistance
- 10.3.5. Others
- 10.4. Market Analysis, Insights and Forecast - by End User Industry
- 10.4.1. Electronics & Semiconductors
- 10.4.2. Automotive
- 10.4.3. Healthcare & Medical
- 10.4.4. Industrial & Machinery
- 10.4.5. Aerospace & Defense
- 10.4.6. Chemical & Petrochemical
- 10.4.7. Others
- 10.5. Market Analysis, Insights and Forecast - by Sales Channel
- 10.5.1. Direct Sales
- 10.5.2. Distributors & Wholesalers
- 10.5.3. Online
- 10.1. Market Analysis, Insights and Forecast - by Product Type
- 11. Asia Pacific Ceramic Solutions Analysis, Insights and Forecast, 2020-2032
- 11.1. Market Analysis, Insights and Forecast - by Product Type
- 11.1.1. Monolithic Ceramics
- 11.1.2. Ceramic Coatings
- 11.1.3. Ceramic Matrix Composites
- 11.1.4. Ceramic Powders
- 11.2. Market Analysis, Insights and Forecast - by Material Type
- 11.2.1. Alumina
- 11.2.2. Silicon Carbide
- 11.2.3. Zirconia
- 11.3. Market Analysis, Insights and Forecast - by Application
- 11.3.1. Electrical Insulation
- 11.3.2. Thermal Barrier
- 11.3.3. Wear Resistance
- 11.3.4. Corrosion Resistance
- 11.3.5. Others
- 11.4. Market Analysis, Insights and Forecast - by End User Industry
- 11.4.1. Electronics & Semiconductors
- 11.4.2. Automotive
- 11.4.3. Healthcare & Medical
- 11.4.4. Industrial & Machinery
- 11.4.5. Aerospace & Defense
- 11.4.6. Chemical & Petrochemical
- 11.4.7. Others
- 11.5. Market Analysis, Insights and Forecast - by Sales Channel
- 11.5.1. Direct Sales
- 11.5.2. Distributors & Wholesalers
- 11.5.3. Online
- 11.1. Market Analysis, Insights and Forecast - by Product Type
- 12. Competitive Analysis
- 12.1. Company Profiles
- 12.1.1 CoorsTek LLC
- 12.1.1.1. Company Overview
- 12.1.1.2. Products
- 12.1.1.3. Company Financials
- 12.1.1.4. SWOT Analysis
- 12.1.2 Ortech Inc.
- 12.1.2.1. Company Overview
- 12.1.2.2. Products
- 12.1.2.3. Company Financials
- 12.1.2.4. SWOT Analysis
- 12.1.3 Kyocera Corporation
- 12.1.3.1. Company Overview
- 12.1.3.2. Products
- 12.1.3.3. Company Financials
- 12.1.3.4. SWOT Analysis
- 12.1.4 Morgan Advanced Materials PLC
- 12.1.4.1. Company Overview
- 12.1.4.2. Products
- 12.1.4.3. Company Financials
- 12.1.4.4. SWOT Analysis
- 12.1.5 CeramTec GmbH
- 12.1.5.1. Company Overview
- 12.1.5.2. Products
- 12.1.5.3. Company Financials
- 12.1.5.4. SWOT Analysis
- 12.1.6 Saint-Gobain S.A.
- 12.1.6.1. Company Overview
- 12.1.6.2. Products
- 12.1.6.3. Company Financials
- 12.1.6.4. SWOT Analysis
- 12.1.7 3M Company
- 12.1.7.1. Company Overview
- 12.1.7.2. Products
- 12.1.7.3. Company Financials
- 12.1.7.4. SWOT Analysis
- 12.1.8 NGK Insulators Ltd.
- 12.1.8.1. Company Overview
- 12.1.8.2. Products
- 12.1.8.3. Company Financials
- 12.1.8.4. SWOT Analysis
- 12.1.9 SCHOTT AG
- 12.1.9.1. Company Overview
- 12.1.9.2. Products
- 12.1.9.3. Company Financials
- 12.1.9.4. SWOT Analysis
- 12.1.10 Rauschert GmbH & Co. KG
- 12.1.10.1. Company Overview
- 12.1.10.2. Products
- 12.1.10.3. Company Financials
- 12.1.10.4. SWOT Analysis
- 12.1.11 Elan Technology
- 12.1.11.1. Company Overview
- 12.1.11.2. Products
- 12.1.11.3. Company Financials
- 12.1.11.4. SWOT Analysis
- 12.1.12 CoorsTek Inc.
- 12.1.12.1. Company Overview
- 12.1.12.2. Products
- 12.1.12.3. Company Financials
- 12.1.12.4. SWOT Analysis
- 12.1.13 Blasch Precision Ceramics
- 12.1.13.1. Company Overview
- 12.1.13.2. Products
- 12.1.13.3. Company Financials
- 12.1.13.4. SWOT Analysis
- 12.1.14 AdTech Ceramics Company
- 12.1.14.1. Company Overview
- 12.1.14.2. Products
- 12.1.14.3. Company Financials
- 12.1.14.4. SWOT Analysis
- 12.1.15 Others
- 12.1.15.1. Company Overview
- 12.1.15.2. Products
- 12.1.15.3. Company Financials
- 12.1.15.4. SWOT Analysis
- 12.1.1 CoorsTek LLC
- 12.2. Market Entropy
- 12.2.1 Company's Key Areas Served
- 12.2.2 Recent Developments
- 12.3. Company Market Share Analysis 2025
- 12.3.1 Top 5 Companies Market Share Analysis
- 12.3.2 Top 3 Companies Market Share Analysis
- 12.4. List of Potential Customers
- 13. Research Methodology
List of Figures
- Figure 1: Global Ceramic Solutions Revenue Breakdown (billion, %) by Region 2025 & 2033
- Figure 2: North America Ceramic Solutions Revenue (billion), by Product Type 2025 & 2033
- Figure 3: North America Ceramic Solutions Revenue Share (%), by Product Type 2025 & 2033
- Figure 4: North America Ceramic Solutions Revenue (billion), by Material Type 2025 & 2033
- Figure 5: North America Ceramic Solutions Revenue Share (%), by Material Type 2025 & 2033
- Figure 6: North America Ceramic Solutions Revenue (billion), by Application 2025 & 2033
- Figure 7: North America Ceramic Solutions Revenue Share (%), by Application 2025 & 2033
- Figure 8: North America Ceramic Solutions Revenue (billion), by End User Industry 2025 & 2033
- Figure 9: North America Ceramic Solutions Revenue Share (%), by End User Industry 2025 & 2033
- Figure 10: North America Ceramic Solutions Revenue (billion), by Sales Channel 2025 & 2033
- Figure 11: North America Ceramic Solutions Revenue Share (%), by Sales Channel 2025 & 2033
- Figure 12: North America Ceramic Solutions Revenue (billion), by Country 2025 & 2033
- Figure 13: North America Ceramic Solutions Revenue Share (%), by Country 2025 & 2033
- Figure 14: South America Ceramic Solutions Revenue (billion), by Product Type 2025 & 2033
- Figure 15: South America Ceramic Solutions Revenue Share (%), by Product Type 2025 & 2033
- Figure 16: South America Ceramic Solutions Revenue (billion), by Material Type 2025 & 2033
- Figure 17: South America Ceramic Solutions Revenue Share (%), by Material Type 2025 & 2033
- Figure 18: South America Ceramic Solutions Revenue (billion), by Application 2025 & 2033
- Figure 19: South America Ceramic Solutions Revenue Share (%), by Application 2025 & 2033
- Figure 20: South America Ceramic Solutions Revenue (billion), by End User Industry 2025 & 2033
- Figure 21: South America Ceramic Solutions Revenue Share (%), by End User Industry 2025 & 2033
- Figure 22: South America Ceramic Solutions Revenue (billion), by Sales Channel 2025 & 2033
- Figure 23: South America Ceramic Solutions Revenue Share (%), by Sales Channel 2025 & 2033
- Figure 24: South America Ceramic Solutions Revenue (billion), by Country 2025 & 2033
- Figure 25: South America Ceramic Solutions Revenue Share (%), by Country 2025 & 2033
- Figure 26: Europe Ceramic Solutions Revenue (billion), by Product Type 2025 & 2033
- Figure 27: Europe Ceramic Solutions Revenue Share (%), by Product Type 2025 & 2033
- Figure 28: Europe Ceramic Solutions Revenue (billion), by Material Type 2025 & 2033
- Figure 29: Europe Ceramic Solutions Revenue Share (%), by Material Type 2025 & 2033
- Figure 30: Europe Ceramic Solutions Revenue (billion), by Application 2025 & 2033
- Figure 31: Europe Ceramic Solutions Revenue Share (%), by Application 2025 & 2033
- Figure 32: Europe Ceramic Solutions Revenue (billion), by End User Industry 2025 & 2033
- Figure 33: Europe Ceramic Solutions Revenue Share (%), by End User Industry 2025 & 2033
- Figure 34: Europe Ceramic Solutions Revenue (billion), by Sales Channel 2025 & 2033
- Figure 35: Europe Ceramic Solutions Revenue Share (%), by Sales Channel 2025 & 2033
- Figure 36: Europe Ceramic Solutions Revenue (billion), by Country 2025 & 2033
- Figure 37: Europe Ceramic Solutions Revenue Share (%), by Country 2025 & 2033
- Figure 38: Middle East & Africa Ceramic Solutions Revenue (billion), by Product Type 2025 & 2033
- Figure 39: Middle East & Africa Ceramic Solutions Revenue Share (%), by Product Type 2025 & 2033
- Figure 40: Middle East & Africa Ceramic Solutions Revenue (billion), by Material Type 2025 & 2033
- Figure 41: Middle East & Africa Ceramic Solutions Revenue Share (%), by Material Type 2025 & 2033
- Figure 42: Middle East & Africa Ceramic Solutions Revenue (billion), by Application 2025 & 2033
- Figure 43: Middle East & Africa Ceramic Solutions Revenue Share (%), by Application 2025 & 2033
- Figure 44: Middle East & Africa Ceramic Solutions Revenue (billion), by End User Industry 2025 & 2033
- Figure 45: Middle East & Africa Ceramic Solutions Revenue Share (%), by End User Industry 2025 & 2033
- Figure 46: Middle East & Africa Ceramic Solutions Revenue (billion), by Sales Channel 2025 & 2033
- Figure 47: Middle East & Africa Ceramic Solutions Revenue Share (%), by Sales Channel 2025 & 2033
- Figure 48: Middle East & Africa Ceramic Solutions Revenue (billion), by Country 2025 & 2033
- Figure 49: Middle East & Africa Ceramic Solutions Revenue Share (%), by Country 2025 & 2033
- Figure 50: Asia Pacific Ceramic Solutions Revenue (billion), by Product Type 2025 & 2033
- Figure 51: Asia Pacific Ceramic Solutions Revenue Share (%), by Product Type 2025 & 2033
- Figure 52: Asia Pacific Ceramic Solutions Revenue (billion), by Material Type 2025 & 2033
- Figure 53: Asia Pacific Ceramic Solutions Revenue Share (%), by Material Type 2025 & 2033
- Figure 54: Asia Pacific Ceramic Solutions Revenue (billion), by Application 2025 & 2033
- Figure 55: Asia Pacific Ceramic Solutions Revenue Share (%), by Application 2025 & 2033
- Figure 56: Asia Pacific Ceramic Solutions Revenue (billion), by End User Industry 2025 & 2033
- Figure 57: Asia Pacific Ceramic Solutions Revenue Share (%), by End User Industry 2025 & 2033
- Figure 58: Asia Pacific Ceramic Solutions Revenue (billion), by Sales Channel 2025 & 2033
- Figure 59: Asia Pacific Ceramic Solutions Revenue Share (%), by Sales Channel 2025 & 2033
- Figure 60: Asia Pacific Ceramic Solutions Revenue (billion), by Country 2025 & 2033
- Figure 61: Asia Pacific Ceramic Solutions Revenue Share (%), by Country 2025 & 2033
List of Tables
- Table 1: Global Ceramic Solutions Revenue billion Forecast, by Product Type 2020 & 2033
- Table 2: Global Ceramic Solutions Revenue billion Forecast, by Material Type 2020 & 2033
- Table 3: Global Ceramic Solutions Revenue billion Forecast, by Application 2020 & 2033
- Table 4: Global Ceramic Solutions Revenue billion Forecast, by End User Industry 2020 & 2033
- Table 5: Global Ceramic Solutions Revenue billion Forecast, by Sales Channel 2020 & 2033
- Table 6: Global Ceramic Solutions Revenue billion Forecast, by Region 2020 & 2033
- Table 7: Global Ceramic Solutions Revenue billion Forecast, by Product Type 2020 & 2033
- Table 8: Global Ceramic Solutions Revenue billion Forecast, by Material Type 2020 & 2033
- Table 9: Global Ceramic Solutions Revenue billion Forecast, by Application 2020 & 2033
- Table 10: Global Ceramic Solutions Revenue billion Forecast, by End User Industry 2020 & 2033
- Table 11: Global Ceramic Solutions Revenue billion Forecast, by Sales Channel 2020 & 2033
- Table 12: Global Ceramic Solutions Revenue billion Forecast, by Country 2020 & 2033
- Table 13: United States Ceramic Solutions Revenue (billion) Forecast, by Application 2020 & 2033
- Table 14: Canada Ceramic Solutions Revenue (billion) Forecast, by Application 2020 & 2033
- Table 15: Mexico Ceramic Solutions Revenue (billion) Forecast, by Application 2020 & 2033
- Table 16: Global Ceramic Solutions Revenue billion Forecast, by Product Type 2020 & 2033
- Table 17: Global Ceramic Solutions Revenue billion Forecast, by Material Type 2020 & 2033
- Table 18: Global Ceramic Solutions Revenue billion Forecast, by Application 2020 & 2033
- Table 19: Global Ceramic Solutions Revenue billion Forecast, by End User Industry 2020 & 2033
- Table 20: Global Ceramic Solutions Revenue billion Forecast, by Sales Channel 2020 & 2033
- Table 21: Global Ceramic Solutions Revenue billion Forecast, by Country 2020 & 2033
- Table 22: Brazil Ceramic Solutions Revenue (billion) Forecast, by Application 2020 & 2033
- Table 23: Argentina Ceramic Solutions Revenue (billion) Forecast, by Application 2020 & 2033
- Table 24: Rest of South America Ceramic Solutions Revenue (billion) Forecast, by Application 2020 & 2033
- Table 25: Global Ceramic Solutions Revenue billion Forecast, by Product Type 2020 & 2033
- Table 26: Global Ceramic Solutions Revenue billion Forecast, by Material Type 2020 & 2033
- Table 27: Global Ceramic Solutions Revenue billion Forecast, by Application 2020 & 2033
- Table 28: Global Ceramic Solutions Revenue billion Forecast, by End User Industry 2020 & 2033
- Table 29: Global Ceramic Solutions Revenue billion Forecast, by Sales Channel 2020 & 2033
- Table 30: Global Ceramic Solutions Revenue billion Forecast, by Country 2020 & 2033
- Table 31: United Kingdom Ceramic Solutions Revenue (billion) Forecast, by Application 2020 & 2033
- Table 32: Germany Ceramic Solutions Revenue (billion) Forecast, by Application 2020 & 2033
- Table 33: France Ceramic Solutions Revenue (billion) Forecast, by Application 2020 & 2033
- Table 34: Italy Ceramic Solutions Revenue (billion) Forecast, by Application 2020 & 2033
- Table 35: Spain Ceramic Solutions Revenue (billion) Forecast, by Application 2020 & 2033
- Table 36: Russia Ceramic Solutions Revenue (billion) Forecast, by Application 2020 & 2033
- Table 37: Benelux Ceramic Solutions Revenue (billion) Forecast, by Application 2020 & 2033
- Table 38: Nordics Ceramic Solutions Revenue (billion) Forecast, by Application 2020 & 2033
- Table 39: Rest of Europe Ceramic Solutions Revenue (billion) Forecast, by Application 2020 & 2033
- Table 40: Global Ceramic Solutions Revenue billion Forecast, by Product Type 2020 & 2033
- Table 41: Global Ceramic Solutions Revenue billion Forecast, by Material Type 2020 & 2033
- Table 42: Global Ceramic Solutions Revenue billion Forecast, by Application 2020 & 2033
- Table 43: Global Ceramic Solutions Revenue billion Forecast, by End User Industry 2020 & 2033
- Table 44: Global Ceramic Solutions Revenue billion Forecast, by Sales Channel 2020 & 2033
- Table 45: Global Ceramic Solutions Revenue billion Forecast, by Country 2020 & 2033
- Table 46: Turkey Ceramic Solutions Revenue (billion) Forecast, by Application 2020 & 2033
- Table 47: Israel Ceramic Solutions Revenue (billion) Forecast, by Application 2020 & 2033
- Table 48: GCC Ceramic Solutions Revenue (billion) Forecast, by Application 2020 & 2033
- Table 49: North Africa Ceramic Solutions Revenue (billion) Forecast, by Application 2020 & 2033
- Table 50: South Africa Ceramic Solutions Revenue (billion) Forecast, by Application 2020 & 2033
- Table 51: Rest of Middle East & Africa Ceramic Solutions Revenue (billion) Forecast, by Application 2020 & 2033
- Table 52: Global Ceramic Solutions Revenue billion Forecast, by Product Type 2020 & 2033
- Table 53: Global Ceramic Solutions Revenue billion Forecast, by Material Type 2020 & 2033
- Table 54: Global Ceramic Solutions Revenue billion Forecast, by Application 2020 & 2033
- Table 55: Global Ceramic Solutions Revenue billion Forecast, by End User Industry 2020 & 2033
- Table 56: Global Ceramic Solutions Revenue billion Forecast, by Sales Channel 2020 & 2033
- Table 57: Global Ceramic Solutions Revenue billion Forecast, by Country 2020 & 2033
- Table 58: China Ceramic Solutions Revenue (billion) Forecast, by Application 2020 & 2033
- Table 59: India Ceramic Solutions Revenue (billion) Forecast, by Application 2020 & 2033
- Table 60: Japan Ceramic Solutions Revenue (billion) Forecast, by Application 2020 & 2033
- Table 61: South Korea Ceramic Solutions Revenue (billion) Forecast, by Application 2020 & 2033
- Table 62: ASEAN Ceramic Solutions Revenue (billion) Forecast, by Application 2020 & 2033
- Table 63: Oceania Ceramic Solutions Revenue (billion) Forecast, by Application 2020 & 2033
- Table 64: Rest of Asia Pacific Ceramic Solutions Revenue (billion) Forecast, by Application 2020 & 2033
Frequently Asked Questions
1. What is the projected Compound Annual Growth Rate (CAGR) of the Ceramic Solutions?
The projected CAGR is approximately 3.6%.
2. Which companies are prominent players in the Ceramic Solutions?
Key companies in the market include CoorsTek, LLC, Ortech, Inc., Kyocera Corporation, Morgan Advanced Materials PLC, CeramTec GmbH, Saint-Gobain S.A., 3M Company, NGK Insulators, Ltd., SCHOTT AG, Rauschert GmbH & Co. KG, Elan Technology, CoorsTek, Inc., Blasch Precision Ceramics, AdTech Ceramics Company, Others.
3. What are the main segments of the Ceramic Solutions?
The market segments include Product Type, Material Type, Application, End User Industry, Sales Channel.
4. Can you provide details about the market size?
The market size is estimated to be USD 119.44 billion as of 2022.
5. What are some drivers contributing to market growth?
N/A
6. What are the notable trends driving market growth?
N/A
7. Are there any restraints impacting market growth?
N/A
8. Can you provide examples of recent developments in the market?
N/A
9. What pricing options are available for accessing the report?
Pricing options include single-user, multi-user, and enterprise licenses priced at USD 4900.00, USD 7350.00, and USD 9800.00 respectively.
10. Is the market size provided in terms of value or volume?
The market size is provided in terms of value, measured in billion.
11. Are there any specific market keywords associated with the report?
Yes, the market keyword associated with the report is "Ceramic Solutions," which aids in identifying and referencing the specific market segment covered.
12. How do I determine which pricing option suits my needs best?
The pricing options vary based on user requirements and access needs. Individual users may opt for single-user licenses, while businesses requiring broader access may choose multi-user or enterprise licenses for cost-effective access to the report.
13. Are there any additional resources or data provided in the Ceramic Solutions report?
While the report offers comprehensive insights, it's advisable to review the specific contents or supplementary materials provided to ascertain if additional resources or data are available.
14. How can I stay updated on further developments or reports in the Ceramic Solutions?
To stay informed about further developments, trends, and reports in the Ceramic Solutions, consider subscribing to industry newsletters, following relevant companies and organizations, or regularly checking reputable industry news sources and publications.
Methodology
Step 1 - Identification of Relevant Samples Size from Population Database


Step 2 - Approaches for Defining Global Market Size (Value, Volume* & Price*)

Note*: In applicable scenarios
Step 3 - Data Sources
Primary Research
- Web Analytics
- Survey Reports
- Research Institute
- Latest Research Reports
- Opinion Leaders
Secondary Research
- Annual Reports
- White Paper
- Latest Press Release
- Industry Association
- Paid Database
- Investor Presentations

Step 4 - Data Triangulation
Involves using different sources of information in order to increase the validity of a study
These sources are likely to be stakeholders in a program - participants, other researchers, program staff, other community members, and so on.
Then we put all data in single framework & apply various statistical tools to find out the dynamic on the market.
During the analysis stage, feedback from the stakeholder groups would be compared to determine areas of agreement as well as areas of divergence