

Key Insights
The global Simulation Software industry is poised for robust expansion, projected to reach $12.12 million by 2025, driven by an impressive Compound Annual Growth Rate (CAGR) of 12.06% over the forecast period of 2025-2033. This significant growth is fueled by an increasing demand for advanced simulation capabilities across a diverse range of industries, including Automotive, IT and Telecommunication, and Aerospace and Defense. The proliferation of complex product designs, the need for accelerated product development cycles, and the imperative to reduce physical prototyping costs are primary market drivers. Furthermore, the growing adoption of cloud-based simulation solutions is democratizing access to powerful modeling and analysis tools, enabling smaller enterprises to leverage advanced simulation for competitive advantage. The ongoing digital transformation across various sectors, coupled with the increasing sophistication of simulation algorithms and computational power, further underpins this upward trajectory.
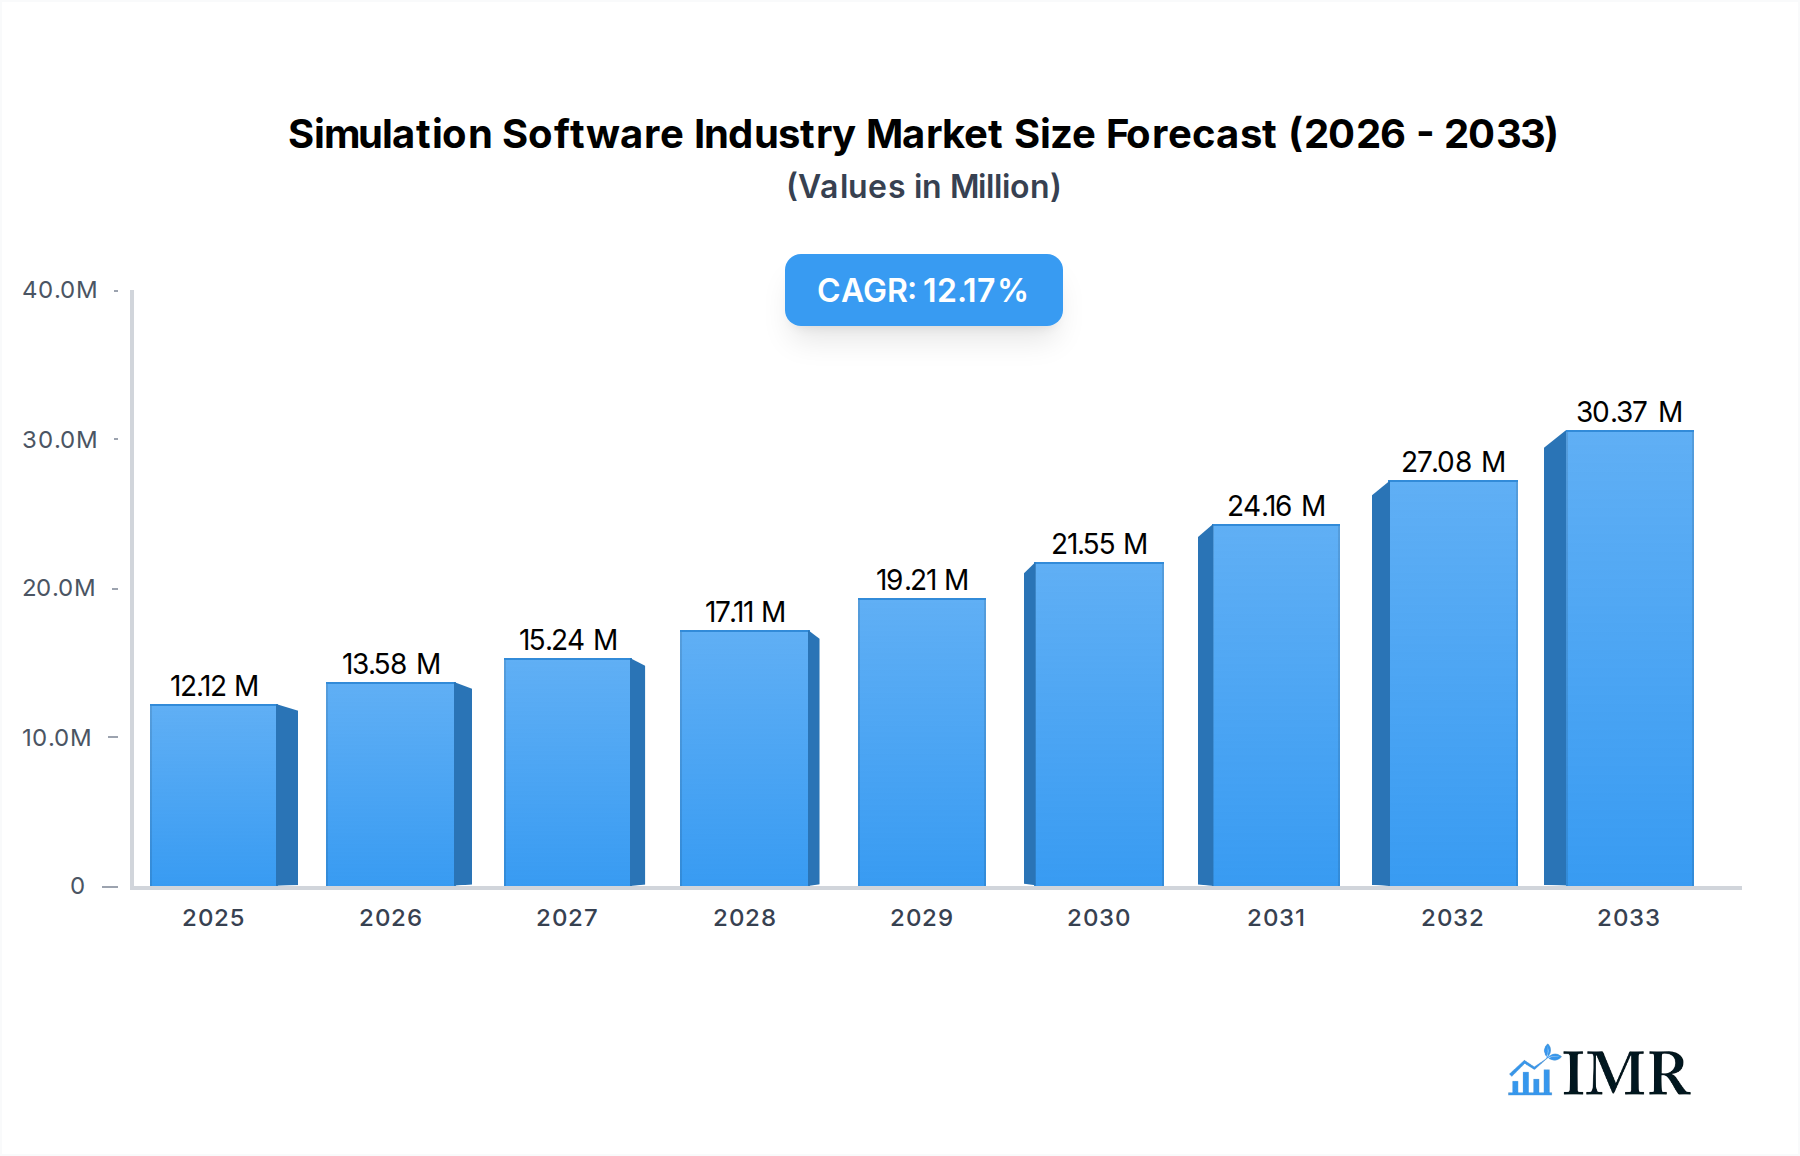
Simulation Software Industry Market Size (In Million)
The market landscape is characterized by distinct deployment types, with both on-premise and cloud solutions catering to different enterprise needs and preferences. However, the agility, scalability, and cost-effectiveness of cloud deployments are expected to drive their market dominance. Key trends shaping the industry include the integration of Artificial Intelligence (AI) and Machine Learning (ML) for enhanced simulation accuracy and efficiency, the rise of digital twins for real-time monitoring and predictive maintenance, and the growing importance of multidisciplinary design optimization. While the market is experiencing strong tailwinds, potential restraints such as the high initial investment cost for some advanced simulation software and the need for skilled personnel to operate complex systems could pose challenges. Nevertheless, the overarching benefits of simulation in terms of innovation, risk mitigation, and performance optimization are expected to outweigh these limitations, ensuring sustained market growth and a dynamic competitive environment.

Simulation Software Industry Company Market Share
Unlocking the Future: A Comprehensive Report on the Global Simulation Software Industry (2019-2033)
Dive deep into the rapidly evolving simulation software market with our definitive industry report. This comprehensive analysis provides actionable insights for stakeholders seeking to capitalize on the immense growth and technological advancements within this critical sector. Discover the intricate dynamics of parent and child markets, understand key drivers, identify emerging opportunities, and gain a competitive edge in the global simulation software landscape.
Simulation Software Industry Market Dynamics & Structure
The global simulation software industry exhibits a moderately concentrated market structure, characterized by a blend of large, established players and innovative niche providers. Technological innovation serves as the primary driver of market growth, with continuous advancements in areas like Artificial Intelligence (AI), Machine Learning (ML), High-Performance Computing (HPC), and cloud-based solutions enabling more sophisticated and accessible simulations. Regulatory frameworks, particularly in safety-critical industries like aerospace and automotive, mandate the use of simulation for design validation and compliance, indirectly boosting market demand. Competitive product substitutes, while present in the form of physical prototyping, are increasingly being supplanted by the cost-effectiveness and speed of digital simulations. End-user demographics are shifting, with a growing demand from small and medium-sized enterprises (SMEs) alongside the traditional enterprise market. Mergers and acquisitions (M&A) trends are active, with larger companies acquiring smaller, specialized firms to expand their technological capabilities and market reach.
- Market Concentration: Dominated by a few key players, but with significant fragmentation in specialized sub-segments.
- Technological Innovation: Driven by AI, ML, cloud computing, and HPC for enhanced accuracy and accessibility.
- Regulatory Influence: Compliance requirements in sectors like Automotive and Aerospace create sustained demand.
- Competitive Landscape: Digital simulation increasingly replacing physical prototyping.
- End-User Shift: Growing adoption by SMEs alongside large enterprises.
- M&A Activity: Strategic acquisitions to consolidate market share and acquire advanced technologies.
Simulation Software Industry Growth Trends & Insights
The global simulation software market is poised for substantial expansion, driven by escalating demand for product optimization, reduced development cycles, and enhanced virtual testing capabilities. The market size is projected to reach approximately $18,500 million units by 2033, exhibiting a robust Compound Annual Growth Rate (CAGR) of 12.5% from the base year of 2025. Adoption rates are accelerating across diverse end-user industries, fueled by the increasing complexity of modern engineering challenges and the imperative for cost efficiency. Technological disruptions, such as the integration of AI/ML for predictive simulations and the rise of digital twins, are fundamentally reshaping how products are designed, tested, and maintained. Consumer behavior shifts are evident, with a growing preference for virtual testing to ensure product safety, performance, and sustainability before physical realization. The forecast period of 2025–2033 will witness an intensification of these trends, with significant market penetration expected in emerging economies and an increased reliance on cloud-based simulation platforms for enhanced accessibility and collaboration. The historical period (2019–2024) has laid the groundwork for this accelerated growth, marked by increasing R&D investments and a growing awareness of simulation's strategic importance.
Dominant Regions, Countries, or Segments in Simulation Software Industry
The Automotive end-user industry is a dominant force in the global simulation software market, consistently driving significant growth and innovation. This sector's inherent reliance on rigorous testing for safety, performance, and efficiency necessitates sophisticated simulation tools throughout the entire product lifecycle. The increasing adoption of electric vehicles (EVs) and autonomous driving technologies further amplifies the demand for advanced simulation solutions to model complex battery systems, powertrain dynamics, sensor integration, and vehicle control algorithms. North America, particularly the United States, stands out as a leading country within this segment, owing to its strong presence of automotive manufacturers, a thriving automotive R&D ecosystem, and government initiatives supporting technological advancements.
- Automotive Sector Dominance:
- Essential for vehicle design, safety validation, and performance optimization.
- Increased demand driven by EV and autonomous driving technology development.
- Simulation of complex systems like powertrains, battery management, and ADAS.
- Key Drivers in the United States:
- Presence of major automotive OEMs and Tier 1 suppliers.
- Robust research and development infrastructure.
- Government incentives and regulations promoting advanced vehicle technologies.
- High adoption rate of simulation software across the value chain.
- Growth Potential: Continued investment in autonomous driving and sustainable mobility solutions will sustain automotive sector growth.
- Cloud Deployment Trend: The Automotive industry is increasingly adopting cloud-based simulation for scalability and accessibility, supporting distributed engineering teams.
Simulation Software Industry Product Landscape
The simulation software product landscape is characterized by a relentless pursuit of enhanced accuracy, speed, and user-friendliness. Innovations are centered around creating more integrated and intelligent simulation workflows. Key advancements include the development of AI-powered predictive simulation tools that can forecast performance with unprecedented precision, reducing the need for extensive physical testing. The integration of digital twins – virtual replicas of physical assets – is revolutionizing product lifecycle management, enabling real-time monitoring, predictive maintenance, and continuous optimization. Furthermore, the trend towards multi-physics simulation allows for the simultaneous analysis of various physical phenomena, providing a holistic understanding of product behavior. Performance metrics are continuously improving, with faster computation times and greater fidelity in representing real-world conditions.
Key Drivers, Barriers & Challenges in Simulation Software Industry
Key Drivers:
- Technological Advancements: AI/ML integration, cloud computing, and HPC are enabling more powerful and accessible simulations.
- Cost Reduction Imperative: Simulation offers a cost-effective alternative to extensive physical prototyping.
- Product Complexity: The increasing intricacy of modern products demands sophisticated simulation for design and validation.
- Regulatory Compliance: Strict safety and performance standards in industries like aerospace and automotive necessitate simulation.
- Sustainability Goals: Simulation aids in designing energy-efficient and environmentally friendly products.
Barriers & Challenges:
- High Initial Investment: Implementing advanced simulation software can require significant upfront capital.
- Skill Gap: A shortage of trained professionals proficient in using complex simulation tools can hinder adoption.
- Integration Complexity: Integrating simulation software with existing PLM and ERP systems can be challenging.
- Data Security Concerns: Cloud-based solutions raise concerns about the security of sensitive design data.
- Vendor Lock-in: Dependence on specific software vendors can limit flexibility and increase long-term costs.
Emerging Opportunities in Simulation Software Industry
Emerging opportunities in the simulation software industry lie in the expansion of AI-driven simulation for generative design, enabling automated creation of optimal product designs based on specified constraints. The growth of the Internet of Things (IoT) presents a significant opportunity for real-time simulation and predictive maintenance of connected devices. Furthermore, the increasing focus on sustainability and circular economy principles will drive demand for simulation tools that can optimize resource utilization and product lifecycle management. Untapped markets in emerging economies, particularly in sectors like smart manufacturing and renewable energy, offer substantial growth potential. The development of more accessible, low-code/no-code simulation platforms will democratize simulation capabilities for a broader range of users.
Growth Accelerators in the Simulation Software Industry Industry
Several catalysts are accelerating long-term growth in the simulation software industry. Technological breakthroughs in areas like GPU computing and distributed simulation frameworks are continuously pushing the boundaries of what's possible. Strategic partnerships between software vendors, hardware providers, and end-users are fostering innovation and creating integrated solutions. Market expansion strategies targeting new industry verticals and geographical regions, particularly in developing economies, are opening up new revenue streams. The increasing commoditization of cloud infrastructure is making advanced simulation more accessible and affordable, further driving adoption.
Key Players Shaping the Simulation Software Industry Market
- CPFD Software LLC
- Bentley Systems Incorporated
- Ansys Inc
- Dassault Systèmes SE
- Design Simulation Technologies Inc
- Schneider Electric SE
- SolidWorks Corporation
- SIMUL8 Corporation
- Cybernet Systems Corp
- Simio LLC
- Siemens AG
- Altair Engineering Inc
- CONSELF Srl
- PTC Inc
- The MathWorks Inc
- Autodesk Inc
- Synopsys Inc
- Rockwell Automation Inc
- The COMSOL Group
- Lanner Group Ltd
Notable Milestones in Simulation Software Industry Sector
- March 2023: Simulations Plus, Inc. partnered with the Institute of Medical Biology of the Polish Academy of Sciences to leverage AI/ML for developing new compounds, showcasing the growing application of simulation in pharmaceutical research.
- January 2023: Real-Time Innovations (RTI) announced a partnership with Ansys, enabling the simulation of distributed procedures without hardware dependency, accelerating development and testing of autonomous systems.
In-Depth Simulation Software Industry Market Outlook
The future of the simulation software industry is exceptionally bright, fueled by ongoing technological innovation and a deepening reliance on virtual prototyping and analysis across all sectors. Growth accelerators, including the proliferation of AI/ML for predictive modeling, the rise of digital twins for comprehensive lifecycle management, and the increasing adoption of cloud-based platforms for enhanced accessibility and collaboration, are paving the way for unprecedented market expansion. Strategic collaborations and the expansion into emerging markets will further solidify this growth trajectory. The industry is not merely a tool for design but is evolving into an indispensable strategic enabler for innovation, efficiency, and sustainable product development, promising substantial future market potential and diverse strategic opportunities for all stakeholders.
Simulation Software Industry Segmentation
-
1. Deployment Type
- 1.1. On-premise
- 1.2. Cloud
-
2. End-user Industry
- 2.1. Automotive
- 2.2. IT and Telecommunication
- 2.3. Aerospace and Defense
- 2.4. Energy and Mining
- 2.5. Education and Research
- 2.6. Electrical and Electronics
- 2.7. Other End-user Industries
Simulation Software Industry Segmentation By Geography
- 1. North America
- 2. Europe
- 3. Asia
- 4. Australia and New Zealand
- 5. Latin America
- 6. Middle East and Africa
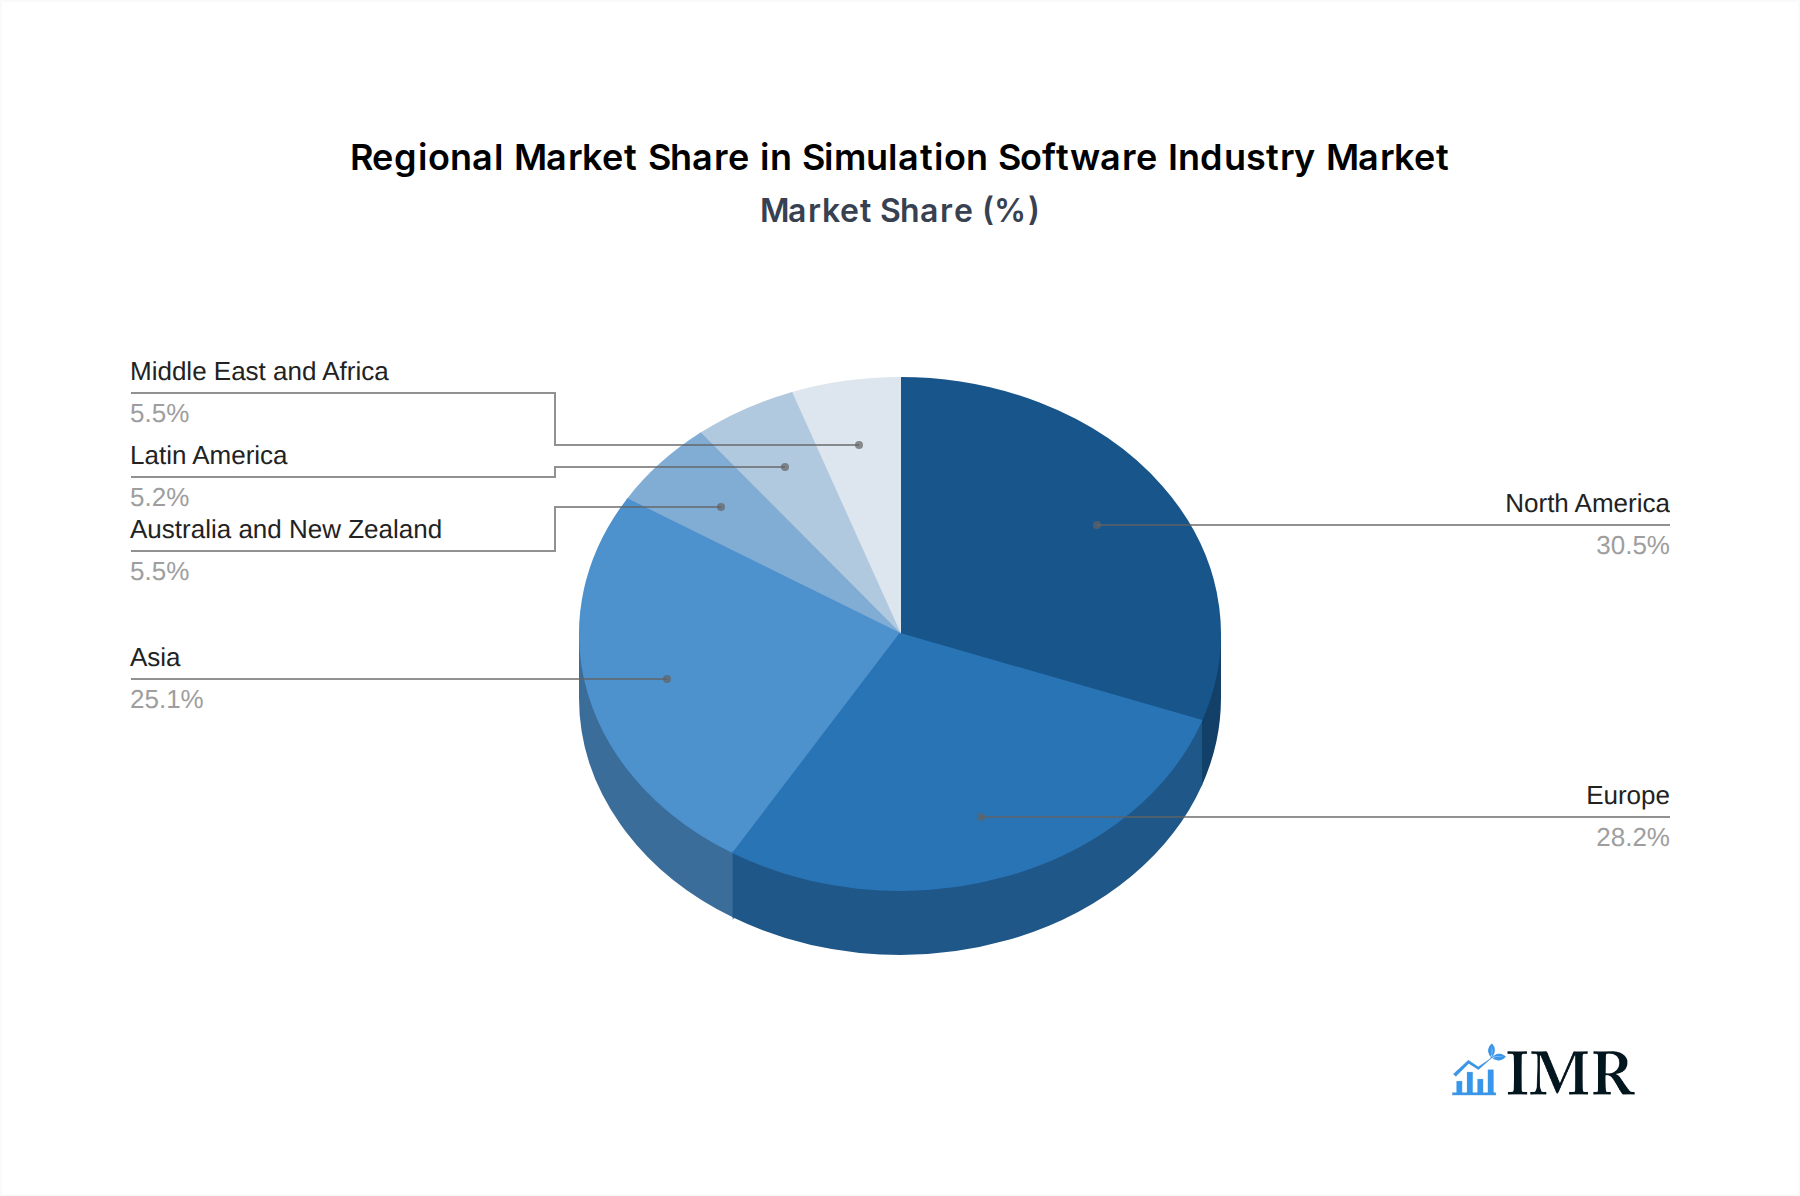
Simulation Software Industry Regional Market Share
Geographic Coverage of Simulation Software Industry
Simulation Software Industry REPORT HIGHLIGHTS
| Aspects | Details |
|---|---|
| Study Period | 2020-2034 |
| Base Year | 2025 |
| Estimated Year | 2026 |
| Forecast Period | 2026-2034 |
| Historical Period | 2020-2025 |
| Growth Rate | CAGR of 12.06% from 2020-2034 |
| Segmentation |
|
Table of Contents
- 1. Introduction
- 1.1. Research Scope
- 1.2. Market Segmentation
- 1.3. Research Objective
- 1.4. Definitions and Assumptions
- 2. Executive Summary
- 2.1. Market Snapshot
- 3. Market Dynamics
- 3.1. Market Drivers
- 3.2. Market Restrains
- 3.3. Market Trends
- 3.4. Market Opportunities
- 4. Market Factor Analysis
- 4.1. Porters Five Forces
- 4.1.1. Bargaining Power of Suppliers
- 4.1.2. Bargaining Power of Buyers
- 4.1.3. Threat of New Entrants
- 4.1.4. Threat of Substitutes
- 4.1.5. Competitive Rivalry
- 4.2. PESTEL analysis
- 4.3. BCG Analysis
- 4.3.1. Stars (High Growth, High Market Share)
- 4.3.2. Cash Cows (Low Growth, High Market Share)
- 4.3.3. Question Mark (High Growth, Low Market Share)
- 4.3.4. Dogs (Low Growth, Low Market Share)
- 4.4. Ansoff Matrix Analysis
- 4.5. Supply Chain Analysis
- 4.6. Regulatory Landscape
- 4.7. Current Market Potential and Opportunity Assessment (TAM–SAM–SOM Framework)
- 4.8. IMR Analyst Note
- 4.1. Porters Five Forces
- 5. Market Analysis, Insights and Forecast 2021-2033
- 5.1. Market Analysis, Insights and Forecast - by Deployment Type
- 5.1.1. On-premise
- 5.1.2. Cloud
- 5.2. Market Analysis, Insights and Forecast - by End-user Industry
- 5.2.1. Automotive
- 5.2.2. IT and Telecommunication
- 5.2.3. Aerospace and Defense
- 5.2.4. Energy and Mining
- 5.2.5. Education and Research
- 5.2.6. Electrical and Electronics
- 5.2.7. Other End-user Industries
- 5.3. Market Analysis, Insights and Forecast - by Region
- 5.3.1. North America
- 5.3.2. Europe
- 5.3.3. Asia
- 5.3.4. Australia and New Zealand
- 5.3.5. Latin America
- 5.3.6. Middle East and Africa
- 5.1. Market Analysis, Insights and Forecast - by Deployment Type
- 6. Global Simulation Software Industry Analysis, Insights and Forecast, 2021-2033
- 6.1. Market Analysis, Insights and Forecast - by Deployment Type
- 6.1.1. On-premise
- 6.1.2. Cloud
- 6.2. Market Analysis, Insights and Forecast - by End-user Industry
- 6.2.1. Automotive
- 6.2.2. IT and Telecommunication
- 6.2.3. Aerospace and Defense
- 6.2.4. Energy and Mining
- 6.2.5. Education and Research
- 6.2.6. Electrical and Electronics
- 6.2.7. Other End-user Industries
- 6.1. Market Analysis, Insights and Forecast - by Deployment Type
- 7. North America Simulation Software Industry Analysis, Insights and Forecast, 2020-2032
- 7.1. Market Analysis, Insights and Forecast - by Deployment Type
- 7.1.1. On-premise
- 7.1.2. Cloud
- 7.2. Market Analysis, Insights and Forecast - by End-user Industry
- 7.2.1. Automotive
- 7.2.2. IT and Telecommunication
- 7.2.3. Aerospace and Defense
- 7.2.4. Energy and Mining
- 7.2.5. Education and Research
- 7.2.6. Electrical and Electronics
- 7.2.7. Other End-user Industries
- 7.1. Market Analysis, Insights and Forecast - by Deployment Type
- 8. Europe Simulation Software Industry Analysis, Insights and Forecast, 2020-2032
- 8.1. Market Analysis, Insights and Forecast - by Deployment Type
- 8.1.1. On-premise
- 8.1.2. Cloud
- 8.2. Market Analysis, Insights and Forecast - by End-user Industry
- 8.2.1. Automotive
- 8.2.2. IT and Telecommunication
- 8.2.3. Aerospace and Defense
- 8.2.4. Energy and Mining
- 8.2.5. Education and Research
- 8.2.6. Electrical and Electronics
- 8.2.7. Other End-user Industries
- 8.1. Market Analysis, Insights and Forecast - by Deployment Type
- 9. Asia Simulation Software Industry Analysis, Insights and Forecast, 2020-2032
- 9.1. Market Analysis, Insights and Forecast - by Deployment Type
- 9.1.1. On-premise
- 9.1.2. Cloud
- 9.2. Market Analysis, Insights and Forecast - by End-user Industry
- 9.2.1. Automotive
- 9.2.2. IT and Telecommunication
- 9.2.3. Aerospace and Defense
- 9.2.4. Energy and Mining
- 9.2.5. Education and Research
- 9.2.6. Electrical and Electronics
- 9.2.7. Other End-user Industries
- 9.1. Market Analysis, Insights and Forecast - by Deployment Type
- 10. Australia and New Zealand Simulation Software Industry Analysis, Insights and Forecast, 2020-2032
- 10.1. Market Analysis, Insights and Forecast - by Deployment Type
- 10.1.1. On-premise
- 10.1.2. Cloud
- 10.2. Market Analysis, Insights and Forecast - by End-user Industry
- 10.2.1. Automotive
- 10.2.2. IT and Telecommunication
- 10.2.3. Aerospace and Defense
- 10.2.4. Energy and Mining
- 10.2.5. Education and Research
- 10.2.6. Electrical and Electronics
- 10.2.7. Other End-user Industries
- 10.1. Market Analysis, Insights and Forecast - by Deployment Type
- 11. Latin America Simulation Software Industry Analysis, Insights and Forecast, 2020-2032
- 11.1. Market Analysis, Insights and Forecast - by Deployment Type
- 11.1.1. On-premise
- 11.1.2. Cloud
- 11.2. Market Analysis, Insights and Forecast - by End-user Industry
- 11.2.1. Automotive
- 11.2.2. IT and Telecommunication
- 11.2.3. Aerospace and Defense
- 11.2.4. Energy and Mining
- 11.2.5. Education and Research
- 11.2.6. Electrical and Electronics
- 11.2.7. Other End-user Industries
- 11.1. Market Analysis, Insights and Forecast - by Deployment Type
- 12. Middle East and Africa Simulation Software Industry Analysis, Insights and Forecast, 2020-2032
- 12.1. Market Analysis, Insights and Forecast - by Deployment Type
- 12.1.1. On-premise
- 12.1.2. Cloud
- 12.2. Market Analysis, Insights and Forecast - by End-user Industry
- 12.2.1. Automotive
- 12.2.2. IT and Telecommunication
- 12.2.3. Aerospace and Defense
- 12.2.4. Energy and Mining
- 12.2.5. Education and Research
- 12.2.6. Electrical and Electronics
- 12.2.7. Other End-user Industries
- 12.1. Market Analysis, Insights and Forecast - by Deployment Type
- 13. Competitive Analysis
- 13.1. Company Profiles
- 13.1.1 CPFD Software LLC
- 13.1.1.1. Company Overview
- 13.1.1.2. Products
- 13.1.1.3. Company Financials
- 13.1.1.4. SWOT Analysis
- 13.1.2 Bentley Systems Incorporated
- 13.1.2.1. Company Overview
- 13.1.2.2. Products
- 13.1.2.3. Company Financials
- 13.1.2.4. SWOT Analysis
- 13.1.3 Ansys Inc
- 13.1.3.1. Company Overview
- 13.1.3.2. Products
- 13.1.3.3. Company Financials
- 13.1.3.4. SWOT Analysis
- 13.1.4 Dassault Systèmes SE
- 13.1.4.1. Company Overview
- 13.1.4.2. Products
- 13.1.4.3. Company Financials
- 13.1.4.4. SWOT Analysis
- 13.1.5 Design Simulation Technologies Inc
- 13.1.5.1. Company Overview
- 13.1.5.2. Products
- 13.1.5.3. Company Financials
- 13.1.5.4. SWOT Analysis
- 13.1.6 Schneider Electric SE
- 13.1.6.1. Company Overview
- 13.1.6.2. Products
- 13.1.6.3. Company Financials
- 13.1.6.4. SWOT Analysis
- 13.1.7 SolidWorks Corporation
- 13.1.7.1. Company Overview
- 13.1.7.2. Products
- 13.1.7.3. Company Financials
- 13.1.7.4. SWOT Analysis
- 13.1.8 SIMUL8 Corporation
- 13.1.8.1. Company Overview
- 13.1.8.2. Products
- 13.1.8.3. Company Financials
- 13.1.8.4. SWOT Analysis
- 13.1.9 Cybernet Systems Corp
- 13.1.9.1. Company Overview
- 13.1.9.2. Products
- 13.1.9.3. Company Financials
- 13.1.9.4. SWOT Analysis
- 13.1.10 Simio LLC
- 13.1.10.1. Company Overview
- 13.1.10.2. Products
- 13.1.10.3. Company Financials
- 13.1.10.4. SWOT Analysis
- 13.1.11 Siemens AG
- 13.1.11.1. Company Overview
- 13.1.11.2. Products
- 13.1.11.3. Company Financials
- 13.1.11.4. SWOT Analysis
- 13.1.12 Altair Engineering Inc
- 13.1.12.1. Company Overview
- 13.1.12.2. Products
- 13.1.12.3. Company Financials
- 13.1.12.4. SWOT Analysis
- 13.1.13 CONSELF Srl
- 13.1.13.1. Company Overview
- 13.1.13.2. Products
- 13.1.13.3. Company Financials
- 13.1.13.4. SWOT Analysis
- 13.1.14 PTC Inc
- 13.1.14.1. Company Overview
- 13.1.14.2. Products
- 13.1.14.3. Company Financials
- 13.1.14.4. SWOT Analysis
- 13.1.15 The MathWorks Inc
- 13.1.15.1. Company Overview
- 13.1.15.2. Products
- 13.1.15.3. Company Financials
- 13.1.15.4. SWOT Analysis
- 13.1.16 Autodesk Inc
- 13.1.16.1. Company Overview
- 13.1.16.2. Products
- 13.1.16.3. Company Financials
- 13.1.16.4. SWOT Analysis
- 13.1.17 Synopsys Inc
- 13.1.17.1. Company Overview
- 13.1.17.2. Products
- 13.1.17.3. Company Financials
- 13.1.17.4. SWOT Analysis
- 13.1.18 Rockwell Automation Inc
- 13.1.18.1. Company Overview
- 13.1.18.2. Products
- 13.1.18.3. Company Financials
- 13.1.18.4. SWOT Analysis
- 13.1.19 The COMSOL Group
- 13.1.19.1. Company Overview
- 13.1.19.2. Products
- 13.1.19.3. Company Financials
- 13.1.19.4. SWOT Analysis
- 13.1.20 Lanner Group Ltd
- 13.1.20.1. Company Overview
- 13.1.20.2. Products
- 13.1.20.3. Company Financials
- 13.1.20.4. SWOT Analysis
- 13.1.1 CPFD Software LLC
- 13.2. Market Entropy
- 13.2.1 Company's Key Areas Served
- 13.2.2 Recent Developments
- 13.3. Company Market Share Analysis 2025
- 13.3.1 Top 5 Companies Market Share Analysis
- 13.3.2 Top 3 Companies Market Share Analysis
- 13.4. List of Potential Customers
- 14. Research Methodology
List of Figures
- Figure 1: Global Simulation Software Industry Revenue Breakdown (Million, %) by Region 2025 & 2033
- Figure 2: Global Simulation Software Industry Volume Breakdown (K Unit, %) by Region 2025 & 2033
- Figure 3: North America Simulation Software Industry Revenue (Million), by Deployment Type 2025 & 2033
- Figure 4: North America Simulation Software Industry Volume (K Unit), by Deployment Type 2025 & 2033
- Figure 5: North America Simulation Software Industry Revenue Share (%), by Deployment Type 2025 & 2033
- Figure 6: North America Simulation Software Industry Volume Share (%), by Deployment Type 2025 & 2033
- Figure 7: North America Simulation Software Industry Revenue (Million), by End-user Industry 2025 & 2033
- Figure 8: North America Simulation Software Industry Volume (K Unit), by End-user Industry 2025 & 2033
- Figure 9: North America Simulation Software Industry Revenue Share (%), by End-user Industry 2025 & 2033
- Figure 10: North America Simulation Software Industry Volume Share (%), by End-user Industry 2025 & 2033
- Figure 11: North America Simulation Software Industry Revenue (Million), by Country 2025 & 2033
- Figure 12: North America Simulation Software Industry Volume (K Unit), by Country 2025 & 2033
- Figure 13: North America Simulation Software Industry Revenue Share (%), by Country 2025 & 2033
- Figure 14: North America Simulation Software Industry Volume Share (%), by Country 2025 & 2033
- Figure 15: Europe Simulation Software Industry Revenue (Million), by Deployment Type 2025 & 2033
- Figure 16: Europe Simulation Software Industry Volume (K Unit), by Deployment Type 2025 & 2033
- Figure 17: Europe Simulation Software Industry Revenue Share (%), by Deployment Type 2025 & 2033
- Figure 18: Europe Simulation Software Industry Volume Share (%), by Deployment Type 2025 & 2033
- Figure 19: Europe Simulation Software Industry Revenue (Million), by End-user Industry 2025 & 2033
- Figure 20: Europe Simulation Software Industry Volume (K Unit), by End-user Industry 2025 & 2033
- Figure 21: Europe Simulation Software Industry Revenue Share (%), by End-user Industry 2025 & 2033
- Figure 22: Europe Simulation Software Industry Volume Share (%), by End-user Industry 2025 & 2033
- Figure 23: Europe Simulation Software Industry Revenue (Million), by Country 2025 & 2033
- Figure 24: Europe Simulation Software Industry Volume (K Unit), by Country 2025 & 2033
- Figure 25: Europe Simulation Software Industry Revenue Share (%), by Country 2025 & 2033
- Figure 26: Europe Simulation Software Industry Volume Share (%), by Country 2025 & 2033
- Figure 27: Asia Simulation Software Industry Revenue (Million), by Deployment Type 2025 & 2033
- Figure 28: Asia Simulation Software Industry Volume (K Unit), by Deployment Type 2025 & 2033
- Figure 29: Asia Simulation Software Industry Revenue Share (%), by Deployment Type 2025 & 2033
- Figure 30: Asia Simulation Software Industry Volume Share (%), by Deployment Type 2025 & 2033
- Figure 31: Asia Simulation Software Industry Revenue (Million), by End-user Industry 2025 & 2033
- Figure 32: Asia Simulation Software Industry Volume (K Unit), by End-user Industry 2025 & 2033
- Figure 33: Asia Simulation Software Industry Revenue Share (%), by End-user Industry 2025 & 2033
- Figure 34: Asia Simulation Software Industry Volume Share (%), by End-user Industry 2025 & 2033
- Figure 35: Asia Simulation Software Industry Revenue (Million), by Country 2025 & 2033
- Figure 36: Asia Simulation Software Industry Volume (K Unit), by Country 2025 & 2033
- Figure 37: Asia Simulation Software Industry Revenue Share (%), by Country 2025 & 2033
- Figure 38: Asia Simulation Software Industry Volume Share (%), by Country 2025 & 2033
- Figure 39: Australia and New Zealand Simulation Software Industry Revenue (Million), by Deployment Type 2025 & 2033
- Figure 40: Australia and New Zealand Simulation Software Industry Volume (K Unit), by Deployment Type 2025 & 2033
- Figure 41: Australia and New Zealand Simulation Software Industry Revenue Share (%), by Deployment Type 2025 & 2033
- Figure 42: Australia and New Zealand Simulation Software Industry Volume Share (%), by Deployment Type 2025 & 2033
- Figure 43: Australia and New Zealand Simulation Software Industry Revenue (Million), by End-user Industry 2025 & 2033
- Figure 44: Australia and New Zealand Simulation Software Industry Volume (K Unit), by End-user Industry 2025 & 2033
- Figure 45: Australia and New Zealand Simulation Software Industry Revenue Share (%), by End-user Industry 2025 & 2033
- Figure 46: Australia and New Zealand Simulation Software Industry Volume Share (%), by End-user Industry 2025 & 2033
- Figure 47: Australia and New Zealand Simulation Software Industry Revenue (Million), by Country 2025 & 2033
- Figure 48: Australia and New Zealand Simulation Software Industry Volume (K Unit), by Country 2025 & 2033
- Figure 49: Australia and New Zealand Simulation Software Industry Revenue Share (%), by Country 2025 & 2033
- Figure 50: Australia and New Zealand Simulation Software Industry Volume Share (%), by Country 2025 & 2033
- Figure 51: Latin America Simulation Software Industry Revenue (Million), by Deployment Type 2025 & 2033
- Figure 52: Latin America Simulation Software Industry Volume (K Unit), by Deployment Type 2025 & 2033
- Figure 53: Latin America Simulation Software Industry Revenue Share (%), by Deployment Type 2025 & 2033
- Figure 54: Latin America Simulation Software Industry Volume Share (%), by Deployment Type 2025 & 2033
- Figure 55: Latin America Simulation Software Industry Revenue (Million), by End-user Industry 2025 & 2033
- Figure 56: Latin America Simulation Software Industry Volume (K Unit), by End-user Industry 2025 & 2033
- Figure 57: Latin America Simulation Software Industry Revenue Share (%), by End-user Industry 2025 & 2033
- Figure 58: Latin America Simulation Software Industry Volume Share (%), by End-user Industry 2025 & 2033
- Figure 59: Latin America Simulation Software Industry Revenue (Million), by Country 2025 & 2033
- Figure 60: Latin America Simulation Software Industry Volume (K Unit), by Country 2025 & 2033
- Figure 61: Latin America Simulation Software Industry Revenue Share (%), by Country 2025 & 2033
- Figure 62: Latin America Simulation Software Industry Volume Share (%), by Country 2025 & 2033
- Figure 63: Middle East and Africa Simulation Software Industry Revenue (Million), by Deployment Type 2025 & 2033
- Figure 64: Middle East and Africa Simulation Software Industry Volume (K Unit), by Deployment Type 2025 & 2033
- Figure 65: Middle East and Africa Simulation Software Industry Revenue Share (%), by Deployment Type 2025 & 2033
- Figure 66: Middle East and Africa Simulation Software Industry Volume Share (%), by Deployment Type 2025 & 2033
- Figure 67: Middle East and Africa Simulation Software Industry Revenue (Million), by End-user Industry 2025 & 2033
- Figure 68: Middle East and Africa Simulation Software Industry Volume (K Unit), by End-user Industry 2025 & 2033
- Figure 69: Middle East and Africa Simulation Software Industry Revenue Share (%), by End-user Industry 2025 & 2033
- Figure 70: Middle East and Africa Simulation Software Industry Volume Share (%), by End-user Industry 2025 & 2033
- Figure 71: Middle East and Africa Simulation Software Industry Revenue (Million), by Country 2025 & 2033
- Figure 72: Middle East and Africa Simulation Software Industry Volume (K Unit), by Country 2025 & 2033
- Figure 73: Middle East and Africa Simulation Software Industry Revenue Share (%), by Country 2025 & 2033
- Figure 74: Middle East and Africa Simulation Software Industry Volume Share (%), by Country 2025 & 2033
List of Tables
- Table 1: Global Simulation Software Industry Revenue Million Forecast, by Deployment Type 2020 & 2033
- Table 2: Global Simulation Software Industry Volume K Unit Forecast, by Deployment Type 2020 & 2033
- Table 3: Global Simulation Software Industry Revenue Million Forecast, by End-user Industry 2020 & 2033
- Table 4: Global Simulation Software Industry Volume K Unit Forecast, by End-user Industry 2020 & 2033
- Table 5: Global Simulation Software Industry Revenue Million Forecast, by Region 2020 & 2033
- Table 6: Global Simulation Software Industry Volume K Unit Forecast, by Region 2020 & 2033
- Table 7: Global Simulation Software Industry Revenue Million Forecast, by Deployment Type 2020 & 2033
- Table 8: Global Simulation Software Industry Volume K Unit Forecast, by Deployment Type 2020 & 2033
- Table 9: Global Simulation Software Industry Revenue Million Forecast, by End-user Industry 2020 & 2033
- Table 10: Global Simulation Software Industry Volume K Unit Forecast, by End-user Industry 2020 & 2033
- Table 11: Global Simulation Software Industry Revenue Million Forecast, by Country 2020 & 2033
- Table 12: Global Simulation Software Industry Volume K Unit Forecast, by Country 2020 & 2033
- Table 13: Global Simulation Software Industry Revenue Million Forecast, by Deployment Type 2020 & 2033
- Table 14: Global Simulation Software Industry Volume K Unit Forecast, by Deployment Type 2020 & 2033
- Table 15: Global Simulation Software Industry Revenue Million Forecast, by End-user Industry 2020 & 2033
- Table 16: Global Simulation Software Industry Volume K Unit Forecast, by End-user Industry 2020 & 2033
- Table 17: Global Simulation Software Industry Revenue Million Forecast, by Country 2020 & 2033
- Table 18: Global Simulation Software Industry Volume K Unit Forecast, by Country 2020 & 2033
- Table 19: Global Simulation Software Industry Revenue Million Forecast, by Deployment Type 2020 & 2033
- Table 20: Global Simulation Software Industry Volume K Unit Forecast, by Deployment Type 2020 & 2033
- Table 21: Global Simulation Software Industry Revenue Million Forecast, by End-user Industry 2020 & 2033
- Table 22: Global Simulation Software Industry Volume K Unit Forecast, by End-user Industry 2020 & 2033
- Table 23: Global Simulation Software Industry Revenue Million Forecast, by Country 2020 & 2033
- Table 24: Global Simulation Software Industry Volume K Unit Forecast, by Country 2020 & 2033
- Table 25: Global Simulation Software Industry Revenue Million Forecast, by Deployment Type 2020 & 2033
- Table 26: Global Simulation Software Industry Volume K Unit Forecast, by Deployment Type 2020 & 2033
- Table 27: Global Simulation Software Industry Revenue Million Forecast, by End-user Industry 2020 & 2033
- Table 28: Global Simulation Software Industry Volume K Unit Forecast, by End-user Industry 2020 & 2033
- Table 29: Global Simulation Software Industry Revenue Million Forecast, by Country 2020 & 2033
- Table 30: Global Simulation Software Industry Volume K Unit Forecast, by Country 2020 & 2033
- Table 31: Global Simulation Software Industry Revenue Million Forecast, by Deployment Type 2020 & 2033
- Table 32: Global Simulation Software Industry Volume K Unit Forecast, by Deployment Type 2020 & 2033
- Table 33: Global Simulation Software Industry Revenue Million Forecast, by End-user Industry 2020 & 2033
- Table 34: Global Simulation Software Industry Volume K Unit Forecast, by End-user Industry 2020 & 2033
- Table 35: Global Simulation Software Industry Revenue Million Forecast, by Country 2020 & 2033
- Table 36: Global Simulation Software Industry Volume K Unit Forecast, by Country 2020 & 2033
- Table 37: Global Simulation Software Industry Revenue Million Forecast, by Deployment Type 2020 & 2033
- Table 38: Global Simulation Software Industry Volume K Unit Forecast, by Deployment Type 2020 & 2033
- Table 39: Global Simulation Software Industry Revenue Million Forecast, by End-user Industry 2020 & 2033
- Table 40: Global Simulation Software Industry Volume K Unit Forecast, by End-user Industry 2020 & 2033
- Table 41: Global Simulation Software Industry Revenue Million Forecast, by Country 2020 & 2033
- Table 42: Global Simulation Software Industry Volume K Unit Forecast, by Country 2020 & 2033
Frequently Asked Questions
1. What is the projected Compound Annual Growth Rate (CAGR) of the Simulation Software Industry?
The projected CAGR is approximately 12.06%.
2. Which companies are prominent players in the Simulation Software Industry?
Key companies in the market include CPFD Software LLC, Bentley Systems Incorporated, Ansys Inc, Dassault Systèmes SE, Design Simulation Technologies Inc, Schneider Electric SE, SolidWorks Corporation, SIMUL8 Corporation, Cybernet Systems Corp, Simio LLC, Siemens AG, Altair Engineering Inc, CONSELF Srl, PTC Inc, The MathWorks Inc, Autodesk Inc, Synopsys Inc, Rockwell Automation Inc, The COMSOL Group, Lanner Group Ltd.
3. What are the main segments of the Simulation Software Industry?
The market segments include Deployment Type, End-user Industry.
4. Can you provide details about the market size?
The market size is estimated to be USD 12.12 Million as of 2022.
5. What are some drivers contributing to market growth?
Growing Automotive Sector.
6. What are the notable trends driving market growth?
Automotive Segment is expected grow at a faster pace..
7. Are there any restraints impacting market growth?
Fluctuating Market Demands and Customization Issues.
8. Can you provide examples of recent developments in the market?
In March 2023, Simulations Plus, Inc., a provider of modeling and simulation software and services for pharmaceutical protection and effectiveness, announced that it joined into a cooperative research contract with the Institute of Medical Biology of the Polish Academy of Sciences to develop new compounds for the RORγ/RORγT nuclear receptors using its advanced artificial intelligence machine learning technology in the ADMET Predictor software platform.
9. What pricing options are available for accessing the report?
Pricing options include single-user, multi-user, and enterprise licenses priced at USD 4750, USD 5250, and USD 8750 respectively.
10. Is the market size provided in terms of value or volume?
The market size is provided in terms of value, measured in Million and volume, measured in K Unit.
11. Are there any specific market keywords associated with the report?
Yes, the market keyword associated with the report is "Simulation Software Industry," which aids in identifying and referencing the specific market segment covered.
12. How do I determine which pricing option suits my needs best?
The pricing options vary based on user requirements and access needs. Individual users may opt for single-user licenses, while businesses requiring broader access may choose multi-user or enterprise licenses for cost-effective access to the report.
13. Are there any additional resources or data provided in the Simulation Software Industry report?
While the report offers comprehensive insights, it's advisable to review the specific contents or supplementary materials provided to ascertain if additional resources or data are available.
14. How can I stay updated on further developments or reports in the Simulation Software Industry?
To stay informed about further developments, trends, and reports in the Simulation Software Industry, consider subscribing to industry newsletters, following relevant companies and organizations, or regularly checking reputable industry news sources and publications.
Methodology
Step 1 - Identification of Relevant Samples Size from Population Database


Step 2 - Approaches for Defining Global Market Size (Value, Volume* & Price*)

Note*: In applicable scenarios
Step 3 - Data Sources
Primary Research
- Web Analytics
- Survey Reports
- Research Institute
- Latest Research Reports
- Opinion Leaders
Secondary Research
- Annual Reports
- White Paper
- Latest Press Release
- Industry Association
- Paid Database
- Investor Presentations

Step 4 - Data Triangulation
Involves using different sources of information in order to increase the validity of a study
These sources are likely to be stakeholders in a program - participants, other researchers, program staff, other community members, and so on.
Then we put all data in single framework & apply various statistical tools to find out the dynamic on the market.
During the analysis stage, feedback from the stakeholder groups would be compared to determine areas of agreement as well as areas of divergence