

Key Insights
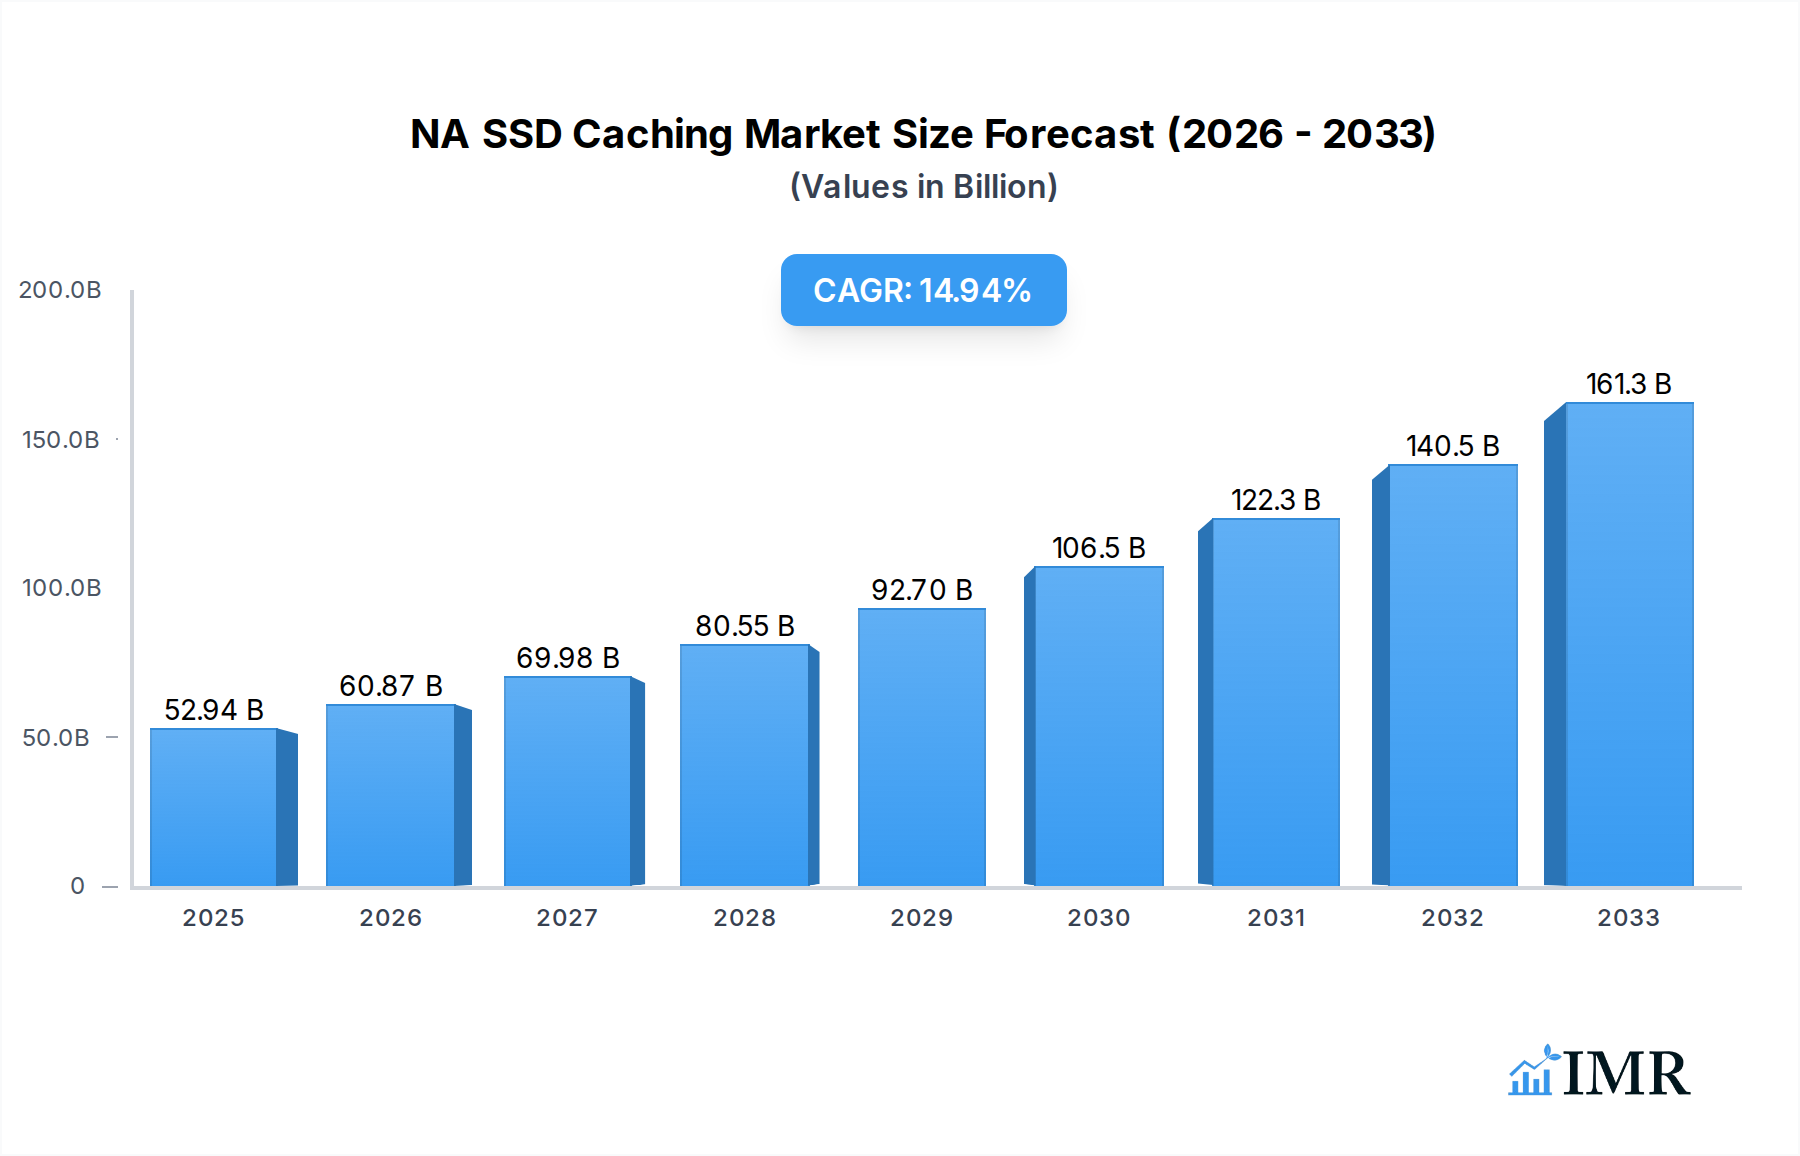
The North American SSD Caching Market is poised for significant expansion, driven by the increasing demand for enhanced data storage performance across enterprise and personal computing environments. With a projected market size of USD 52.94 billion in 2025, the market is expected to witness a robust Compound Annual Growth Rate (CAGR) of 14.94% throughout the forecast period of 2025-2033. This impressive growth is underpinned by the fundamental need to accelerate application responsiveness, reduce latency, and improve overall system efficiency, particularly in data-intensive applications like big data analytics, AI/ML workloads, and high-frequency trading. The adoption of SSD caching solutions is becoming a critical strategy for businesses seeking to optimize their existing infrastructure without the prohibitive costs of a complete overhaul, making it an attractive investment for IT decision-makers.

NA SSD Caching Market Market Size (In Billion)
The market's trajectory is further bolstered by key trends such as the burgeoning adoption of NVMe SSDs, which offer significantly higher speeds than traditional SATA interfaces, thereby amplifying the effectiveness of caching. Furthermore, the growing prevalence of cloud computing and hybrid cloud environments necessitates sophisticated data management solutions that can seamlessly integrate with existing cloud architectures, where SSD caching plays a vital role in bridging the performance gap. While the market is experiencing rapid growth, potential restraints include the initial setup costs for larger enterprise deployments and the ongoing advancements in native SSD performance, which might, in some scenarios, reduce the incremental benefit of caching. However, the inherent cost-effectiveness and performance uplift offered by SSD caching solutions are anticipated to maintain their strong market position.
NA SSD Caching Market Company Market Share
NA SSD Caching Market: Unlocking Peak Performance and Scalability in North America
This comprehensive report delves into the North American (NA) SSD Caching Market, a critical segment of the broader North American storage solutions market. We explore the dynamics, growth trends, regional dominance, product landscape, key drivers, challenges, and the pivotal role of leading companies in shaping the future of high-speed data access. The report analyzes the enterprise storage solutions market and personal storage market as key parent and child markets, providing a granular view of adoption and innovation.
NA SSD Caching Market Dynamics & Structure
The NA SSD Caching Market is characterized by a dynamic interplay of technological innovation, increasing demand for faster data access, and evolving regulatory landscapes. Market concentration is moderate, with several key players vying for market share, driven by continuous advancements in NAND flash technology and PCIe interfaces. Technological innovation is primarily fueled by the pursuit of lower latency, higher endurance, and increased storage density in SSDs designed for caching applications. Regulatory frameworks are generally supportive, focusing on data security and interoperability standards. Competitive product substitutes include traditional hard disk drives (HDDs) and tiered storage solutions, though SSD caching offers a distinct performance advantage. End-user demographics are diverse, ranging from large enterprises with extensive data processing needs to individual power users and gamers seeking optimized performance. Mergers and acquisitions (M&A) trends are observed as companies aim to consolidate their market position and expand their technological capabilities, with a projected xx M&A deals expected during the forecast period. Barriers to innovation include the high cost of advanced NAND flash technologies and the complexities of firmware optimization for diverse workloads.
- Market Concentration: Moderate, with key players investing heavily in R&D.
- Technological Drivers: Lower latency, higher endurance, increased IOPS, PCIe Gen4/Gen5 adoption.
- Regulatory Framework: Focus on data security, reliability, and interoperability standards.
- Competitive Landscape: HDDs, tiered storage, other high-performance storage solutions.
- End-User Segments: Enterprise, SMB, personal/consumer.
- M&A Activity: Strategic acquisitions to enhance product portfolios and market reach.
NA SSD Caching Market Growth Trends & Insights
The NA SSD Caching Market is experiencing robust growth, projected to reach an estimated USD $xx billion in 2025, with a significant Compound Annual Growth Rate (CAGR) of xx% during the forecast period of 2025–2033. This expansion is driven by the insatiable demand for faster data processing and reduced latency across various applications. Adoption rates are steadily increasing as businesses recognize the tangible benefits of SSD caching in accelerating critical workloads, from database operations and virtualized environments to AI/ML training and real-time analytics. Technological disruptions, such as the advent of NVMe over Fabrics (NVMe-oF) and the continuous improvement in NAND flash endurance and performance, are further propelling market penetration. Consumer behavior shifts towards data-intensive applications, including high-definition media consumption, online gaming, and complex creative workflows, are also contributing to the growing demand for enhanced storage performance. The market penetration of SSD caching solutions is expected to rise from xx% in 2025 to xx% by 2033, indicating a strong upward trajectory. The total market size, including both enterprise and personal storage applications, is a key indicator of this growth.
- Market Size Evolution: Significant growth from USD $xx billion in 2019 to an estimated USD $xx billion by 2033.
- Adoption Rates: Increasing adoption across enterprise, SMB, and consumer segments.
- Technological Disrupters: NVMe, PCIe Gen5, 3D NAND advancements, QLC and PLC NAND integration.
- Consumer Behavior Shifts: Growing demand for faster data access in gaming, content creation, and AI.
- Market Penetration: Expected to double from 2025 to 2033.
Dominant Regions, Countries, or Segments in NA SSD Caching Market
Within the North American SSD Caching Market, Enterprise Storage stands out as the dominant segment driving significant growth, accounting for an estimated xx% of the total market share in 2025. This dominance is underpinned by the escalating need for high-performance storage in data centers, cloud computing infrastructure, and demanding enterprise applications such as big data analytics, AI/ML, and transactional databases. The United States, as the largest economy in North America, spearheads this dominance, contributing an estimated xx% to the regional market revenue in 2025. Key drivers for this segment's leadership include substantial investments in digital transformation initiatives, the proliferation of cloud services, and the increasing adoption of high-performance computing (HPC) environments. Economic policies that foster innovation and investment in technology, coupled with robust IT infrastructure, further solidify the US market's leading position. The Canadian and Mexican markets, while smaller, are also exhibiting strong growth potential, driven by increasing enterprise adoption of advanced storage solutions. The growth in enterprise storage is further amplified by the demand for improved storage efficiency and cost optimization, where SSD caching plays a pivotal role in maximizing the performance of existing infrastructure.
- Dominant Segment: Enterprise Storage, expected to capture xx% of the market in 2025.
- Leading Country: United States, contributing xx% to the North American market.
- Key Drivers for Enterprise: Digital transformation, cloud computing, big data analytics, AI/ML.
- Market Share in Enterprise: Estimated at xx% of total NA SSD Caching Market.
- Growth Potential in Enterprise: High, driven by ongoing technological advancements and data growth.
- Personal Storage Segment Contribution: Estimated at xx% of the market in 2025, with steady growth.
NA SSD Caching Market Product Landscape
The NA SSD Caching Market is defined by a landscape of increasingly sophisticated and high-performance SSD caching solutions. Product innovations are primarily focused on enhancing IOPS (Input/Output Operations Per Second), reducing latency, and improving endurance for sustained high-speed operations. Applications range from accelerating operating system boot times and application loading in personal computing to optimizing critical database transactions and virtual machine performance in enterprise environments. Key technological advancements include the integration of PCIe Gen4 and Gen5 interfaces, offering significantly higher bandwidth, and the utilization of advanced NAND flash technologies like QLC (Quad-Level Cell) and PLC (Penta-Level Cell) to improve density and cost-effectiveness. Performance metrics such as sequential read/write speeds, random read/write speeds, and TBW (Terabytes Written) are crucial differentiating factors. Unique selling propositions often revolve around intelligent caching algorithms, power loss protection, and enhanced data integrity features, ensuring reliable and consistent performance for demanding workloads.
Key Drivers, Barriers & Challenges in NA SSD Caching Market
The NA SSD Caching Market is propelled by several key drivers, including the relentless demand for faster data access in a data-intensive world, the growing adoption of cloud computing and virtualized environments, and the continuous advancements in NAND flash technology and PCIe interfaces. The increasing affordability of SSDs also makes caching solutions more accessible.
- Key Drivers:
- Demand for low latency and high throughput.
- Growth of big data analytics, AI, and ML.
- Virtualization and cloud infrastructure expansion.
- Technological advancements in SSD controllers and NAND.
Conversely, the market faces significant barriers and challenges such as the initial cost of enterprise-grade SSDs compared to traditional HDDs, which can be a deterrent for smaller businesses. Supply chain disruptions and the geopolitical factors affecting NAND flash production can lead to price volatility and availability issues. Intense competition from established players and emerging technologies also presents a challenge, requiring continuous innovation and competitive pricing. Regulatory compliance for data security and privacy in enterprise deployments can add complexity.
- Key Barriers & Challenges:
- High initial cost for enterprise deployments.
- Supply chain volatility and NAND flash price fluctuations.
- Intense market competition.
- Firmware complexity and optimization for diverse workloads.
- Evolving data security and privacy regulations.
Emerging Opportunities in NA SSD Caching Market
Emerging opportunities in the NA SSD Caching Market are abundant, fueled by untapped market segments and evolving consumer preferences. The growth of edge computing presents a significant opportunity, where localized SSD caching can dramatically improve real-time data processing for IoT devices and decentralized applications. Furthermore, the increasing demand for AI-powered applications in sectors like autonomous vehicles, smart cities, and personalized healthcare necessitates faster data processing, making SSD caching a crucial component. The expansion of high-performance gaming and virtual reality (VR)/augmented reality (AR) experiences is also creating a niche for consumer-grade SSD caching solutions that offer immersive and lag-free performance. There is also a growing opportunity in the SMB sector, as more small and medium-sized businesses recognize the performance benefits of SSD caching for their critical business applications without the full cost of a complete SSD array.
Growth Accelerators in the NA SSD Caching Market Industry
Several catalysts are accelerating the long-term growth of the NA SSD Caching Market. Technological breakthroughs in NAND flash technology, such as the development of 3D XPoint and next-generation QLC/PLC NAND, promise even higher performance and greater cost-efficiency. Strategic partnerships between SSD manufacturers, system integrators, and software developers are crucial for creating integrated solutions that simplify deployment and maximize benefits for end-users. Market expansion strategies, including penetration into emerging vertical industries like healthcare, finance, and manufacturing, are also driving sustained growth. Furthermore, the ongoing decline in the cost-per-gigabyte of SSDs, coupled with increasing server density and the need for faster data access in cloud environments, are powerful growth accelerators.
Key Players Shaping the NA SSD Caching Market Market
- Seagate Technology LLC
- Microsemi (Microchip Technology Inc)
- Micron Technology Inc
- Inspur Group
- Samsung Electronics Co Ltd
- Transcend Information Inc
- Kioxia (Toshiba Memory Corporation)
- ADATA Technology Co Ltd
- Western Digital Corporation
- SK Hynix Inc
- NetApp Inc
- Intel Corporation
- QNAP Systems Inc
Notable Milestones in NA SSD Caching Market Sector
- March 2021: Intel released the Solid State Drive (SSD) 670p, a 144-layer quad-level cell-based client SSD with up to two terabytes of storage. This drive, optimized for low queue depth and mixed workloads, offers improved performance, including a 2-times sequential read and a 20% endurance boost compared to its predecessor, catering to everyday computing and extreme gaming needs.
- August 2020: Intel launched the SSD D7-P5500/5600 Series. Designed for enhanced IT efficiency and data security in enterprise and cloud settings, these all-TLC arrays feature an all-new Intel PCIe Gen4 controller and firmware. They deliver low latency, superior administration capabilities, scalability, and crucial new NVMe features for demanding environments.
In-Depth NA SSD Caching Market Market Outlook
The NA SSD Caching Market is poised for sustained and significant growth, driven by a confluence of technological advancements and escalating data demands. Future market potential lies in the continued evolution of NVMe technology and the integration of intelligent caching algorithms that optimize data placement and retrieval. Strategic opportunities include capitalizing on the burgeoning edge computing landscape, where low-latency data processing is paramount, and further penetrating the AI/ML ecosystem that thrives on rapid data ingestion and analysis. The increasing adoption of hybrid cloud architectures will also demand sophisticated caching solutions to bridge performance gaps. As NAND flash technology matures, offering higher densities and improved endurance at lower costs, the accessibility and adoption of SSD caching will broaden, solidifying its position as an indispensable component of modern IT infrastructure.
NA SSD Caching Market Segmentation
-
1. Application
- 1.1. Enterprise Storage
- 1.2. Personal Storage
NA SSD Caching Market Segmentation By Geography
-
1. North America
- 1.1. United States
- 1.2. Canada
- 1.3. Mexico
-
2. South America
- 2.1. Brazil
- 2.2. Argentina
- 2.3. Rest of South America
-
3. Europe
- 3.1. United Kingdom
- 3.2. Germany
- 3.3. France
- 3.4. Italy
- 3.5. Spain
- 3.6. Russia
- 3.7. Benelux
- 3.8. Nordics
- 3.9. Rest of Europe
-
4. Middle East & Africa
- 4.1. Turkey
- 4.2. Israel
- 4.3. GCC
- 4.4. North Africa
- 4.5. South Africa
- 4.6. Rest of Middle East & Africa
-
5. Asia Pacific
- 5.1. China
- 5.2. India
- 5.3. Japan
- 5.4. South Korea
- 5.5. ASEAN
- 5.6. Oceania
- 5.7. Rest of Asia Pacific
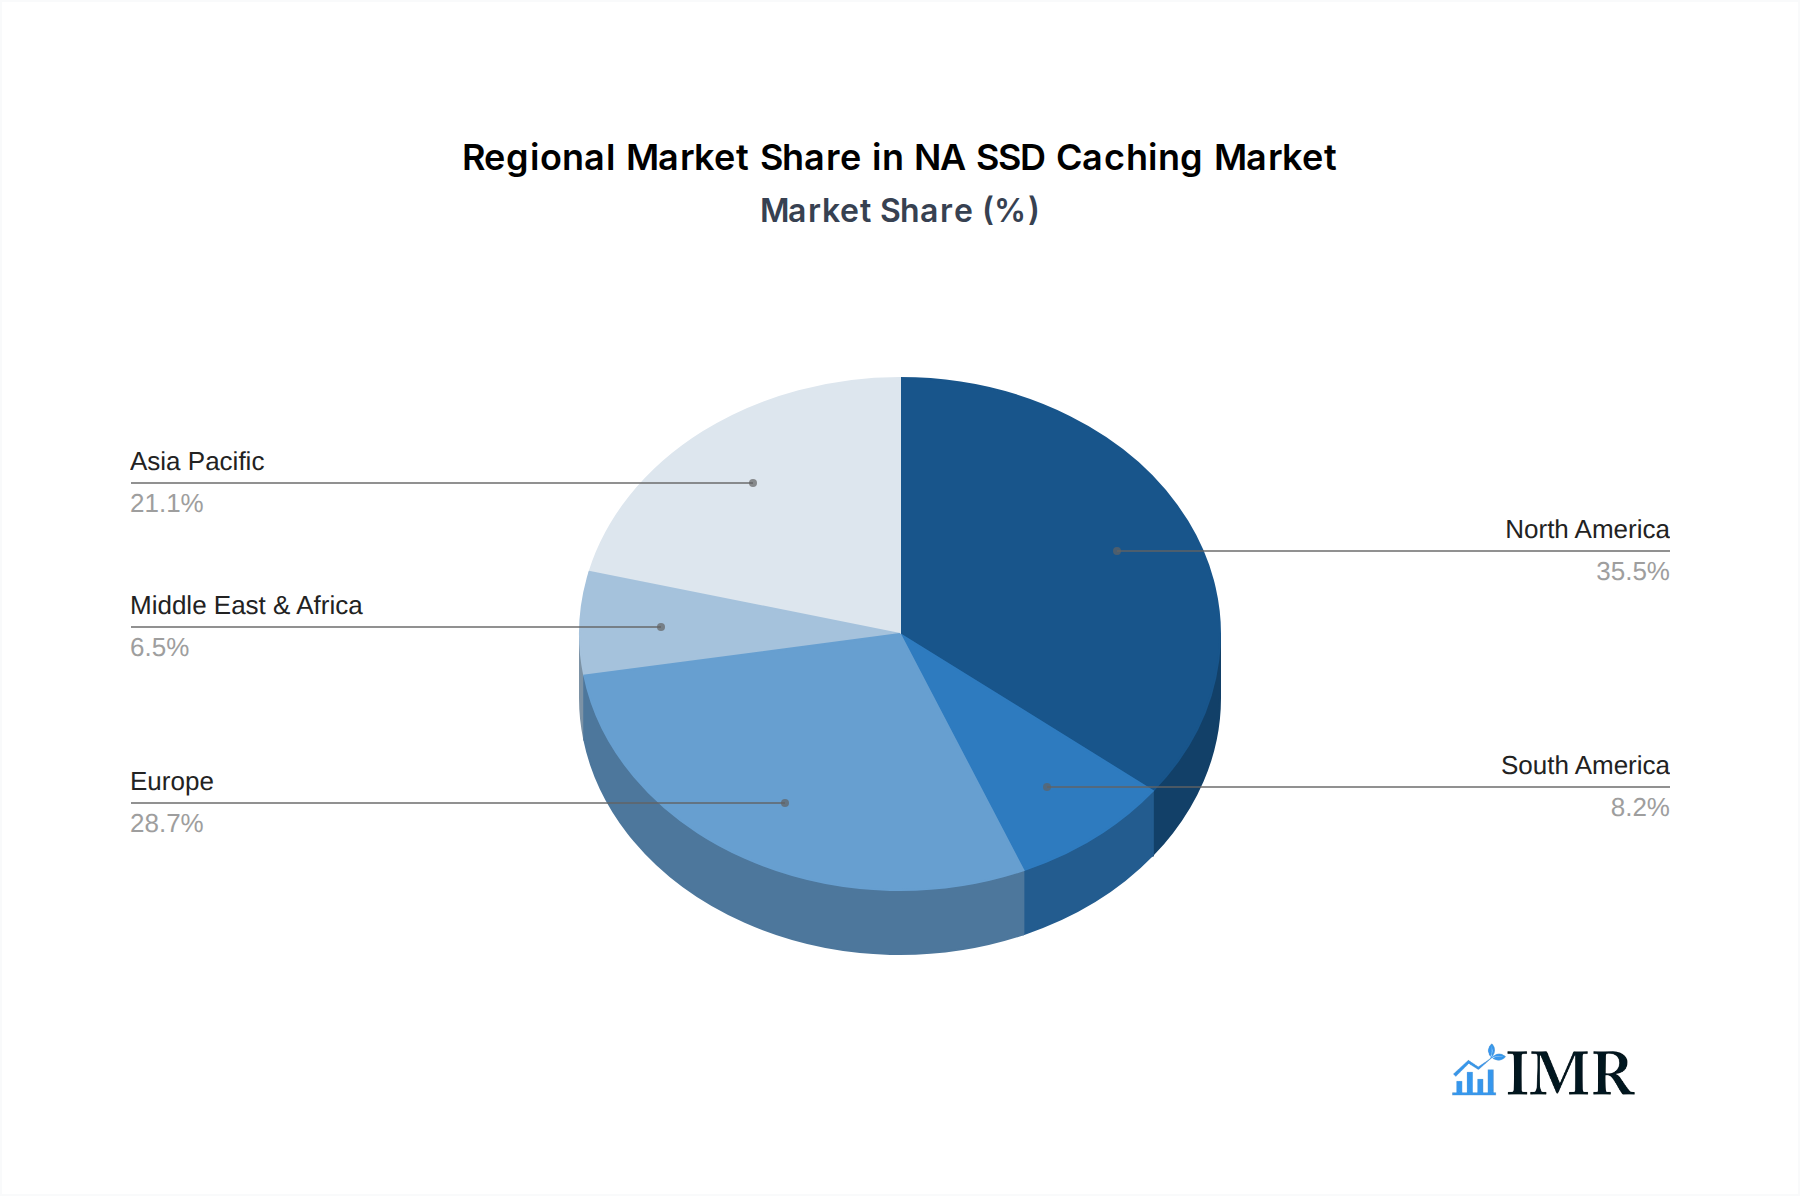
NA SSD Caching Market Regional Market Share
Geographic Coverage of NA SSD Caching Market
NA SSD Caching Market REPORT HIGHLIGHTS
| Aspects | Details |
|---|---|
| Study Period | 2020-2034 |
| Base Year | 2025 |
| Estimated Year | 2026 |
| Forecast Period | 2026-2034 |
| Historical Period | 2020-2025 |
| Growth Rate | CAGR of 14.94% from 2020-2034 |
| Segmentation |
|
Table of Contents
- 1. Introduction
- 1.1. Research Scope
- 1.2. Market Segmentation
- 1.3. Research Objective
- 1.4. Definitions and Assumptions
- 2. Executive Summary
- 2.1. Market Snapshot
- 3. Market Dynamics
- 3.1. Market Drivers
- 3.2. Market Restrains
- 3.3. Market Trends
- 3.4. Market Opportunities
- 4. Market Factor Analysis
- 4.1. Porters Five Forces
- 4.1.1. Bargaining Power of Suppliers
- 4.1.2. Bargaining Power of Buyers
- 4.1.3. Threat of New Entrants
- 4.1.4. Threat of Substitutes
- 4.1.5. Competitive Rivalry
- 4.2. PESTEL analysis
- 4.3. BCG Analysis
- 4.3.1. Stars (High Growth, High Market Share)
- 4.3.2. Cash Cows (Low Growth, High Market Share)
- 4.3.3. Question Mark (High Growth, Low Market Share)
- 4.3.4. Dogs (Low Growth, Low Market Share)
- 4.4. Ansoff Matrix Analysis
- 4.5. Supply Chain Analysis
- 4.6. Regulatory Landscape
- 4.7. Current Market Potential and Opportunity Assessment (TAM–SAM–SOM Framework)
- 4.8. IMR Analyst Note
- 4.1. Porters Five Forces
- 5. Market Analysis, Insights and Forecast 2021-2033
- 5.1. Market Analysis, Insights and Forecast - by Application
- 5.1.1. Enterprise Storage
- 5.1.2. Personal Storage
- 5.2. Market Analysis, Insights and Forecast - by Region
- 5.2.1. North America
- 5.2.2. South America
- 5.2.3. Europe
- 5.2.4. Middle East & Africa
- 5.2.5. Asia Pacific
- 5.1. Market Analysis, Insights and Forecast - by Application
- 6. Global NA SSD Caching Market Analysis, Insights and Forecast, 2021-2033
- 6.1. Market Analysis, Insights and Forecast - by Application
- 6.1.1. Enterprise Storage
- 6.1.2. Personal Storage
- 6.1. Market Analysis, Insights and Forecast - by Application
- 7. North America NA SSD Caching Market Analysis, Insights and Forecast, 2020-2032
- 7.1. Market Analysis, Insights and Forecast - by Application
- 7.1.1. Enterprise Storage
- 7.1.2. Personal Storage
- 7.1. Market Analysis, Insights and Forecast - by Application
- 8. South America NA SSD Caching Market Analysis, Insights and Forecast, 2020-2032
- 8.1. Market Analysis, Insights and Forecast - by Application
- 8.1.1. Enterprise Storage
- 8.1.2. Personal Storage
- 8.1. Market Analysis, Insights and Forecast - by Application
- 9. Europe NA SSD Caching Market Analysis, Insights and Forecast, 2020-2032
- 9.1. Market Analysis, Insights and Forecast - by Application
- 9.1.1. Enterprise Storage
- 9.1.2. Personal Storage
- 9.1. Market Analysis, Insights and Forecast - by Application
- 10. Middle East & Africa NA SSD Caching Market Analysis, Insights and Forecast, 2020-2032
- 10.1. Market Analysis, Insights and Forecast - by Application
- 10.1.1. Enterprise Storage
- 10.1.2. Personal Storage
- 10.1. Market Analysis, Insights and Forecast - by Application
- 11. Asia Pacific NA SSD Caching Market Analysis, Insights and Forecast, 2020-2032
- 11.1. Market Analysis, Insights and Forecast - by Application
- 11.1.1. Enterprise Storage
- 11.1.2. Personal Storage
- 11.1. Market Analysis, Insights and Forecast - by Application
- 12. Competitive Analysis
- 12.1. Company Profiles
- 12.1.1 Seagate Technology LLC
- 12.1.1.1. Company Overview
- 12.1.1.2. Products
- 12.1.1.3. Company Financials
- 12.1.1.4. SWOT Analysis
- 12.1.2 Microsemi (Microchip Technology Inc
- 12.1.2.1. Company Overview
- 12.1.2.2. Products
- 12.1.2.3. Company Financials
- 12.1.2.4. SWOT Analysis
- 12.1.3 Micron Technology Inc
- 12.1.3.1. Company Overview
- 12.1.3.2. Products
- 12.1.3.3. Company Financials
- 12.1.3.4. SWOT Analysis
- 12.1.4 Inspur Group
- 12.1.4.1. Company Overview
- 12.1.4.2. Products
- 12.1.4.3. Company Financials
- 12.1.4.4. SWOT Analysis
- 12.1.5 Samsung Electronics Co Ltd
- 12.1.5.1. Company Overview
- 12.1.5.2. Products
- 12.1.5.3. Company Financials
- 12.1.5.4. SWOT Analysis
- 12.1.6 Transcend Information Inc
- 12.1.6.1. Company Overview
- 12.1.6.2. Products
- 12.1.6.3. Company Financials
- 12.1.6.4. SWOT Analysis
- 12.1.7 Kioxia (Toshiba Memory Corporation)
- 12.1.7.1. Company Overview
- 12.1.7.2. Products
- 12.1.7.3. Company Financials
- 12.1.7.4. SWOT Analysis
- 12.1.8 ADATA Technology Co Ltd
- 12.1.8.1. Company Overview
- 12.1.8.2. Products
- 12.1.8.3. Company Financials
- 12.1.8.4. SWOT Analysis
- 12.1.9 Western Digital Corporation
- 12.1.9.1. Company Overview
- 12.1.9.2. Products
- 12.1.9.3. Company Financials
- 12.1.9.4. SWOT Analysis
- 12.1.10 SK Hynix Inc
- 12.1.10.1. Company Overview
- 12.1.10.2. Products
- 12.1.10.3. Company Financials
- 12.1.10.4. SWOT Analysis
- 12.1.11 NetApp Inc
- 12.1.11.1. Company Overview
- 12.1.11.2. Products
- 12.1.11.3. Company Financials
- 12.1.11.4. SWOT Analysis
- 12.1.12 Intel Corporation
- 12.1.12.1. Company Overview
- 12.1.12.2. Products
- 12.1.12.3. Company Financials
- 12.1.12.4. SWOT Analysis
- 12.1.13 QNAP Systems Inc
- 12.1.13.1. Company Overview
- 12.1.13.2. Products
- 12.1.13.3. Company Financials
- 12.1.13.4. SWOT Analysis
- 12.1.1 Seagate Technology LLC
- 12.2. Market Entropy
- 12.2.1 Company's Key Areas Served
- 12.2.2 Recent Developments
- 12.3. Company Market Share Analysis 2025
- 12.3.1 Top 5 Companies Market Share Analysis
- 12.3.2 Top 3 Companies Market Share Analysis
- 12.4. List of Potential Customers
- 13. Research Methodology
List of Figures
- Figure 1: Global NA SSD Caching Market Revenue Breakdown (billion, %) by Region 2025 & 2033
- Figure 2: North America NA SSD Caching Market Revenue (billion), by Application 2025 & 2033
- Figure 3: North America NA SSD Caching Market Revenue Share (%), by Application 2025 & 2033
- Figure 4: North America NA SSD Caching Market Revenue (billion), by Country 2025 & 2033
- Figure 5: North America NA SSD Caching Market Revenue Share (%), by Country 2025 & 2033
- Figure 6: South America NA SSD Caching Market Revenue (billion), by Application 2025 & 2033
- Figure 7: South America NA SSD Caching Market Revenue Share (%), by Application 2025 & 2033
- Figure 8: South America NA SSD Caching Market Revenue (billion), by Country 2025 & 2033
- Figure 9: South America NA SSD Caching Market Revenue Share (%), by Country 2025 & 2033
- Figure 10: Europe NA SSD Caching Market Revenue (billion), by Application 2025 & 2033
- Figure 11: Europe NA SSD Caching Market Revenue Share (%), by Application 2025 & 2033
- Figure 12: Europe NA SSD Caching Market Revenue (billion), by Country 2025 & 2033
- Figure 13: Europe NA SSD Caching Market Revenue Share (%), by Country 2025 & 2033
- Figure 14: Middle East & Africa NA SSD Caching Market Revenue (billion), by Application 2025 & 2033
- Figure 15: Middle East & Africa NA SSD Caching Market Revenue Share (%), by Application 2025 & 2033
- Figure 16: Middle East & Africa NA SSD Caching Market Revenue (billion), by Country 2025 & 2033
- Figure 17: Middle East & Africa NA SSD Caching Market Revenue Share (%), by Country 2025 & 2033
- Figure 18: Asia Pacific NA SSD Caching Market Revenue (billion), by Application 2025 & 2033
- Figure 19: Asia Pacific NA SSD Caching Market Revenue Share (%), by Application 2025 & 2033
- Figure 20: Asia Pacific NA SSD Caching Market Revenue (billion), by Country 2025 & 2033
- Figure 21: Asia Pacific NA SSD Caching Market Revenue Share (%), by Country 2025 & 2033
List of Tables
- Table 1: Global NA SSD Caching Market Revenue billion Forecast, by Application 2020 & 2033
- Table 2: Global NA SSD Caching Market Revenue billion Forecast, by Region 2020 & 2033
- Table 3: Global NA SSD Caching Market Revenue billion Forecast, by Application 2020 & 2033
- Table 4: Global NA SSD Caching Market Revenue billion Forecast, by Country 2020 & 2033
- Table 5: United States NA SSD Caching Market Revenue (billion) Forecast, by Application 2020 & 2033
- Table 6: Canada NA SSD Caching Market Revenue (billion) Forecast, by Application 2020 & 2033
- Table 7: Mexico NA SSD Caching Market Revenue (billion) Forecast, by Application 2020 & 2033
- Table 8: Global NA SSD Caching Market Revenue billion Forecast, by Application 2020 & 2033
- Table 9: Global NA SSD Caching Market Revenue billion Forecast, by Country 2020 & 2033
- Table 10: Brazil NA SSD Caching Market Revenue (billion) Forecast, by Application 2020 & 2033
- Table 11: Argentina NA SSD Caching Market Revenue (billion) Forecast, by Application 2020 & 2033
- Table 12: Rest of South America NA SSD Caching Market Revenue (billion) Forecast, by Application 2020 & 2033
- Table 13: Global NA SSD Caching Market Revenue billion Forecast, by Application 2020 & 2033
- Table 14: Global NA SSD Caching Market Revenue billion Forecast, by Country 2020 & 2033
- Table 15: United Kingdom NA SSD Caching Market Revenue (billion) Forecast, by Application 2020 & 2033
- Table 16: Germany NA SSD Caching Market Revenue (billion) Forecast, by Application 2020 & 2033
- Table 17: France NA SSD Caching Market Revenue (billion) Forecast, by Application 2020 & 2033
- Table 18: Italy NA SSD Caching Market Revenue (billion) Forecast, by Application 2020 & 2033
- Table 19: Spain NA SSD Caching Market Revenue (billion) Forecast, by Application 2020 & 2033
- Table 20: Russia NA SSD Caching Market Revenue (billion) Forecast, by Application 2020 & 2033
- Table 21: Benelux NA SSD Caching Market Revenue (billion) Forecast, by Application 2020 & 2033
- Table 22: Nordics NA SSD Caching Market Revenue (billion) Forecast, by Application 2020 & 2033
- Table 23: Rest of Europe NA SSD Caching Market Revenue (billion) Forecast, by Application 2020 & 2033
- Table 24: Global NA SSD Caching Market Revenue billion Forecast, by Application 2020 & 2033
- Table 25: Global NA SSD Caching Market Revenue billion Forecast, by Country 2020 & 2033
- Table 26: Turkey NA SSD Caching Market Revenue (billion) Forecast, by Application 2020 & 2033
- Table 27: Israel NA SSD Caching Market Revenue (billion) Forecast, by Application 2020 & 2033
- Table 28: GCC NA SSD Caching Market Revenue (billion) Forecast, by Application 2020 & 2033
- Table 29: North Africa NA SSD Caching Market Revenue (billion) Forecast, by Application 2020 & 2033
- Table 30: South Africa NA SSD Caching Market Revenue (billion) Forecast, by Application 2020 & 2033
- Table 31: Rest of Middle East & Africa NA SSD Caching Market Revenue (billion) Forecast, by Application 2020 & 2033
- Table 32: Global NA SSD Caching Market Revenue billion Forecast, by Application 2020 & 2033
- Table 33: Global NA SSD Caching Market Revenue billion Forecast, by Country 2020 & 2033
- Table 34: China NA SSD Caching Market Revenue (billion) Forecast, by Application 2020 & 2033
- Table 35: India NA SSD Caching Market Revenue (billion) Forecast, by Application 2020 & 2033
- Table 36: Japan NA SSD Caching Market Revenue (billion) Forecast, by Application 2020 & 2033
- Table 37: South Korea NA SSD Caching Market Revenue (billion) Forecast, by Application 2020 & 2033
- Table 38: ASEAN NA SSD Caching Market Revenue (billion) Forecast, by Application 2020 & 2033
- Table 39: Oceania NA SSD Caching Market Revenue (billion) Forecast, by Application 2020 & 2033
- Table 40: Rest of Asia Pacific NA SSD Caching Market Revenue (billion) Forecast, by Application 2020 & 2033
Frequently Asked Questions
1. What is the projected Compound Annual Growth Rate (CAGR) of the NA SSD Caching Market?
The projected CAGR is approximately 14.94%.
2. Which companies are prominent players in the NA SSD Caching Market?
Key companies in the market include Seagate Technology LLC, Microsemi (Microchip Technology Inc, Micron Technology Inc, Inspur Group, Samsung Electronics Co Ltd, Transcend Information Inc, Kioxia (Toshiba Memory Corporation), ADATA Technology Co Ltd, Western Digital Corporation, SK Hynix Inc, NetApp Inc, Intel Corporation, QNAP Systems Inc.
3. What are the main segments of the NA SSD Caching Market?
The market segments include Application.
4. Can you provide details about the market size?
The market size is estimated to be USD 52.94 billion as of 2022.
5. What are some drivers contributing to market growth?
Improvements Offered by SSDs Over Conventional HDDs.
6. What are the notable trends driving market growth?
Enterprise Storage Expected to Hold Major Share.
7. Are there any restraints impacting market growth?
Slow Pace in Development of Applications Despite Heavy investments in R&D; Commplexities in Hardware Designing.
8. Can you provide examples of recent developments in the market?
March 2021 - A Solid State Drive (SSD) 670p has been released by Intel. The client SSD is a 144-layer quad-level cell-based device. The SSD can hold up to two terabytes of data in a single drive. According to Intel, SSDs can be used to supplement everyday computing needs and assist extreme gaming. When compared to the previous generation Intel QLC 3D NAND SSD, the new SSD 670p is said to give improved performance, including a 2-times sequential read and a 20% endurance boost. To meet normal processing demands, the Intel SSD 670p has been optimized for low queue depth and mixed workloads.
9. What pricing options are available for accessing the report?
Pricing options include single-user, multi-user, and enterprise licenses priced at USD 3800, USD 4500, and USD 5800 respectively.
10. Is the market size provided in terms of value or volume?
The market size is provided in terms of value, measured in billion.
11. Are there any specific market keywords associated with the report?
Yes, the market keyword associated with the report is "NA SSD Caching Market," which aids in identifying and referencing the specific market segment covered.
12. How do I determine which pricing option suits my needs best?
The pricing options vary based on user requirements and access needs. Individual users may opt for single-user licenses, while businesses requiring broader access may choose multi-user or enterprise licenses for cost-effective access to the report.
13. Are there any additional resources or data provided in the NA SSD Caching Market report?
While the report offers comprehensive insights, it's advisable to review the specific contents or supplementary materials provided to ascertain if additional resources or data are available.
14. How can I stay updated on further developments or reports in the NA SSD Caching Market?
To stay informed about further developments, trends, and reports in the NA SSD Caching Market, consider subscribing to industry newsletters, following relevant companies and organizations, or regularly checking reputable industry news sources and publications.
Methodology
Step 1 - Identification of Relevant Samples Size from Population Database


Step 2 - Approaches for Defining Global Market Size (Value, Volume* & Price*)

Note*: In applicable scenarios
Step 3 - Data Sources
Primary Research
- Web Analytics
- Survey Reports
- Research Institute
- Latest Research Reports
- Opinion Leaders
Secondary Research
- Annual Reports
- White Paper
- Latest Press Release
- Industry Association
- Paid Database
- Investor Presentations

Step 4 - Data Triangulation
Involves using different sources of information in order to increase the validity of a study
These sources are likely to be stakeholders in a program - participants, other researchers, program staff, other community members, and so on.
Then we put all data in single framework & apply various statistical tools to find out the dynamic on the market.
During the analysis stage, feedback from the stakeholder groups would be compared to determine areas of agreement as well as areas of divergence