

Key Insights
The global circus performance market is poised for substantial growth, driven by increasing disposable incomes and a rising demand for family-friendly entertainment. Innovation in artistic expression, technology integration, and compelling storytelling are key growth enablers. The market size is projected to reach $2.74 billion by 2025, with a compound annual growth rate (CAGR) of 5.3%. Leading entities like Cirque du Soleil and Feld Entertainment exemplify the market's potential, blending large-scale productions with regional appeal.
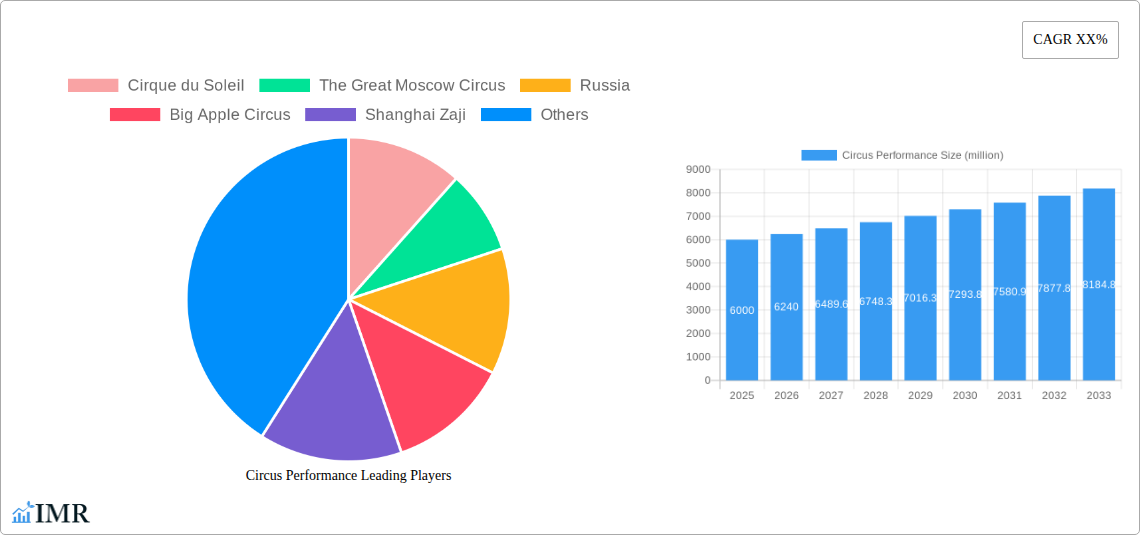
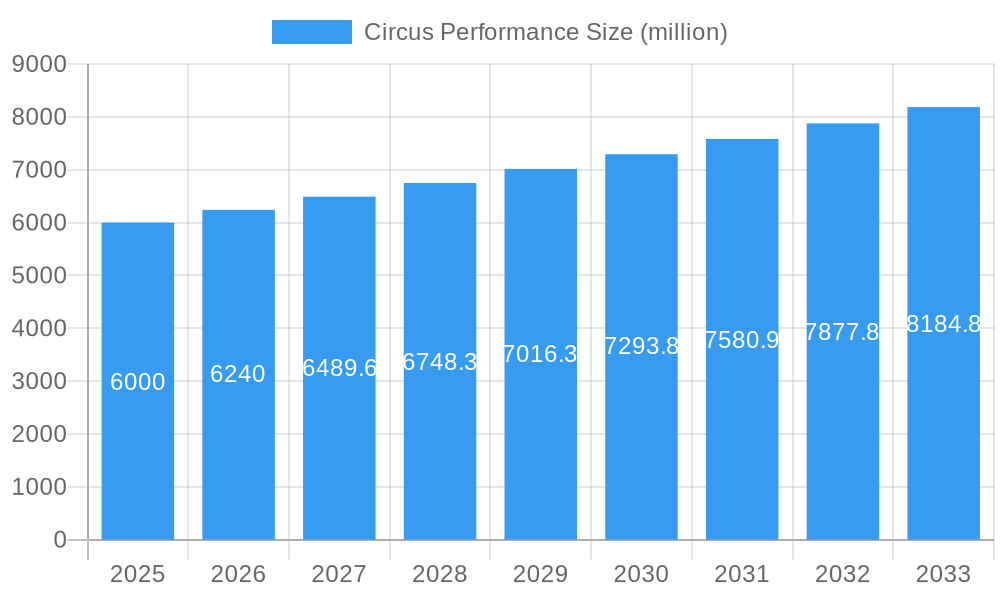
Circus Performance Market Size (In Billion)
Challenges such as escalating production costs, competition from alternative entertainment forms, and a growing focus on animal welfare necessitate strategic adaptation. Leading companies are increasingly prioritizing animal-free, immersive, and narrative-driven performances enhanced by cutting-edge technology. Market segmentation spans traditional and contemporary acts, diverse venue types, and varied regional adoption rates. Future expansion depends on adapting to evolving consumer tastes, robust marketing initiatives, and a commitment to sustainable operational practices.
Circus Performance Company Market Share
Circus Performance Market Report: 2019-2033
This comprehensive report provides a detailed analysis of the global circus performance market, encompassing historical data (2019-2024), current estimates (2025), and future forecasts (2025-2033). The study delves into market dynamics, growth trends, regional performance, key players, and emerging opportunities, offering invaluable insights for industry professionals, investors, and strategic decision-makers. The market is segmented by key players and geographic regions, offering a granular understanding of the industry's complexities. This report is crucial for understanding the evolving landscape of the entertainment industry, specifically within the niche circus performance sector, and its potential for future growth. The parent market is considered the broader entertainment and leisure industry, while the child market specifically focuses on live performance and family-oriented events.
Total Market Size (2025 Estimate): $xx Billion
Circus Performance Market Dynamics & Structure
This section analyzes the competitive landscape of the circus performance market, focusing on market concentration, technological innovation, regulatory aspects, and market trends. The study period (2019-2033) allows for a comprehensive understanding of historical performance and future projections.
Market Concentration: The global circus performance market exhibits a moderately concentrated structure, with a few major players like Cirque du Soleil and Feld Entertainment holding significant market share. Smaller, regional circuses contribute substantially to the overall market size, creating a diversified landscape. We estimate the top 5 players to hold approximately 60% of the market share in 2025.
Technological Innovation: Technological advancements, such as improved special effects, immersive technologies (VR/AR), and enhanced stage design are driving innovation and attracting wider audiences. However, high initial investment costs can act as a barrier for smaller companies.
Regulatory Frameworks: Safety regulations and licensing requirements vary across regions, influencing operating costs and market access. Compliance with these standards is critical for market participation.
Competitive Product Substitutes: The circus performance market faces competition from other forms of entertainment like theme parks, concerts, and sporting events. Differentiation through unique acts and immersive experiences is crucial to maintain market share.
End-User Demographics: The primary end-users are families with children, young adults, and tourists. Demographic shifts and changing preferences influence the demand for specific types of circus performances.
M&A Trends: The circus performance sector has witnessed a moderate level of mergers and acquisitions (M&A) activity in the past, primarily driven by expansion strategies and market consolidation. We predict xx M&A deals within the forecast period.
Circus Performance Growth Trends & Insights
This section analyzes market size evolution, adoption rates, technological disruptions, and consumer behavior shifts, leveraging [Specify Data Source/Methodology - e.g., industry reports, surveys, proprietary data]. The analysis considers the impact of various factors on market growth, including changing consumer preferences and technological advancements.
The global circus performance market experienced steady growth during the historical period (2019-2024), with a CAGR of xx%. This growth is projected to continue during the forecast period (2025-2033), albeit at a slightly moderated pace, reaching an estimated market size of $xx billion by 2033. This moderation is primarily attributed to the increased competition from other forms of entertainment and economic fluctuations. Increased adoption of innovative technologies, such as augmented reality and virtual reality, is anticipated to boost market growth. Consumer preference shifts towards more interactive and experiential performances are further driving market expansion. Market penetration in emerging economies is also expected to contribute significantly to overall growth.
Dominant Regions, Countries, or Segments in Circus Performance
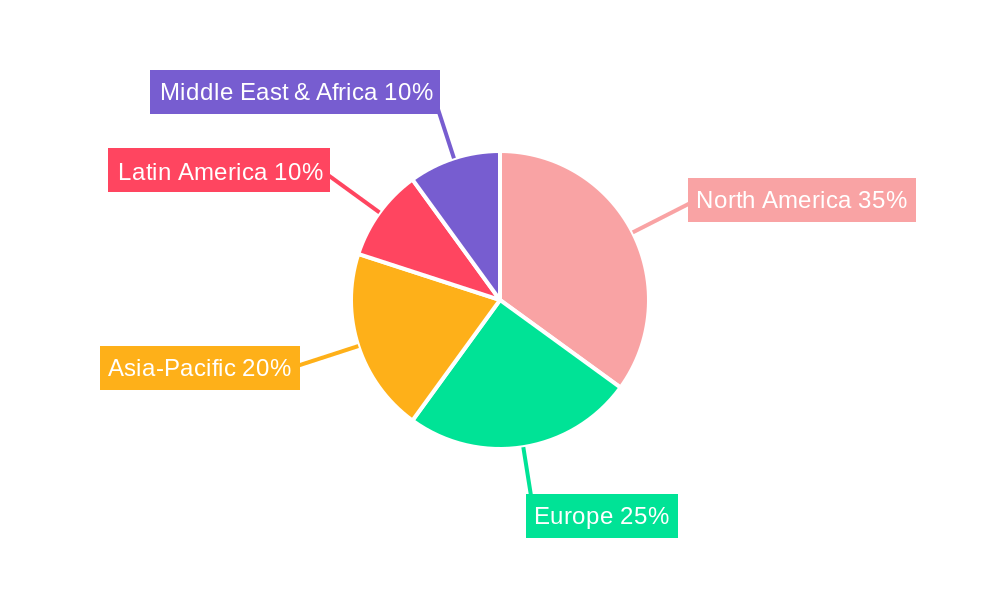
North America and Europe currently represent the largest segments of the circus performance market, driven by a well-established infrastructure, high disposable incomes, and a strong tourism sector. However, Asia-Pacific is expected to witness the highest growth rate during the forecast period due to rising disposable incomes, increasing urbanization, and a burgeoning entertainment industry.
- North America: Strong demand, well-developed infrastructure.
- Europe: Established market, high tourist influx.
- Asia-Pacific: High growth potential, rising disposable incomes.
- Russia: Significant presence of established circuses.
- China: Rapid growth driven by increasing investment in the entertainment industry.
The dominance of North America and Europe stems from factors including established circus traditions, robust infrastructure supporting large-scale productions, and a high disposable income level among consumers. However, the Asia-Pacific region is anticipated to show strong growth, driven by a rapidly expanding middle class with increasing disposable income and a growing appetite for entertainment. Specific countries like China are witnessing significant investment in the entertainment sector, further fueling the regional expansion of the circus performance market.
Circus Performance Product Landscape
The circus performance market offers a diverse range of shows, incorporating traditional acts like acrobatics, clowning, and animal performances, alongside modern elements like high-tech special effects, aerial arts, and immersive storytelling. Product innovation is focused on creating unique and engaging experiences that cater to a broader audience. The incorporation of technology, particularly in areas such as lighting, sound, and stage design, enhances the overall spectacle and elevates the viewing experience.
Key Drivers, Barriers & Challenges in Circus Performance
Key Drivers:
- Increasing disposable incomes globally.
- Growing popularity of live entertainment experiences.
- Technological advancements enhancing the spectacle.
- Government initiatives promoting tourism and cultural events.
Challenges and Restraints:
- High operating costs and intense competition.
- Stringent safety regulations and licensing requirements.
- Concerns regarding animal welfare impacting traditional acts.
- Economic downturns affecting consumer spending on entertainment. This factor impacted the market by xx% during the 2020 economic downturn.
Emerging Opportunities in Circus Performance
- Expansion into untapped markets in developing economies.
- Development of niche circus performances catering to specific audience segments.
- Integration of virtual reality and augmented reality technologies for immersive experiences.
- Creation of themed shows collaborating with popular franchises and intellectual properties.
Growth Accelerators in the Circus Performance Industry
Strategic partnerships between circus companies and other entertainment businesses will further drive market expansion. Technological advancements, particularly in areas like immersive technologies and special effects, will enhance audience engagement and create new revenue streams. Moreover, expansion into new geographic markets, particularly in emerging economies with a growing middle class, will provide substantial growth opportunities for companies in the circus performance industry.
Key Players Shaping the Circus Performance Market
- Cirque du Soleil
- The Great Moscow Circus
- Russia (representing various Russian circus companies)
- Big Apple Circus
- Shanghai Zaji
- Royal Circus
- Changlong Group
- Chongqin Zaji
- Feld Entertainment
Notable Milestones in Circus Performance Sector
- 2020: Many circuses worldwide experienced significant disruptions due to the COVID-19 pandemic.
- 2022: A resurgence in live performances was observed post-pandemic, with increased demand for outdoor and socially distanced shows.
- 2023: Several major circus companies invested heavily in technological upgrades and innovative show formats.
In-Depth Circus Performance Market Outlook
The future of the circus performance market looks promising, driven by ongoing technological advancements, increasing consumer demand for live entertainment, and expansion into new markets. Strategic partnerships, diversification of offerings, and a focus on immersive experiences will be crucial for long-term success. The market is projected to experience sustained growth, albeit at a potentially moderated pace compared to previous years, maintaining its position as a vibrant and dynamic segment of the global entertainment industry.
Circus Performance Segmentation
-
1. Application
- 1.1. Entertainment Industry
- 1.2. Public Welfare Industry
- 1.3. Tourism Industry
- 1.4. Diplomacy
-
2. Types
- 2.1. Without Animals
- 2.2. With Animal
Circus Performance Segmentation By Geography
-
1. North America
- 1.1. United States
- 1.2. Canada
- 1.3. Mexico
-
2. South America
- 2.1. Brazil
- 2.2. Argentina
- 2.3. Rest of South America
-
3. Europe
- 3.1. United Kingdom
- 3.2. Germany
- 3.3. France
- 3.4. Italy
- 3.5. Spain
- 3.6. Russia
- 3.7. Benelux
- 3.8. Nordics
- 3.9. Rest of Europe
-
4. Middle East & Africa
- 4.1. Turkey
- 4.2. Israel
- 4.3. GCC
- 4.4. North Africa
- 4.5. South Africa
- 4.6. Rest of Middle East & Africa
-
5. Asia Pacific
- 5.1. China
- 5.2. India
- 5.3. Japan
- 5.4. South Korea
- 5.5. ASEAN
- 5.6. Oceania
- 5.7. Rest of Asia Pacific
Circus Performance Regional Market Share
Geographic Coverage of Circus Performance
Circus Performance REPORT HIGHLIGHTS
| Aspects | Details |
|---|---|
| Study Period | 2020-2034 |
| Base Year | 2025 |
| Estimated Year | 2026 |
| Forecast Period | 2026-2034 |
| Historical Period | 2020-2025 |
| Growth Rate | CAGR of 5.3% from 2020-2034 |
| Segmentation |
|
Table of Contents
- 1. Introduction
- 1.1. Research Scope
- 1.2. Market Segmentation
- 1.3. Research Objective
- 1.4. Definitions and Assumptions
- 2. Executive Summary
- 2.1. Market Snapshot
- 3. Market Dynamics
- 3.1. Market Drivers
- 3.2. Market Restrains
- 3.3. Market Trends
- 3.4. Market Opportunities
- 4. Market Factor Analysis
- 4.1. Porters Five Forces
- 4.1.1. Bargaining Power of Suppliers
- 4.1.2. Bargaining Power of Buyers
- 4.1.3. Threat of New Entrants
- 4.1.4. Threat of Substitutes
- 4.1.5. Competitive Rivalry
- 4.2. PESTEL analysis
- 4.3. BCG Analysis
- 4.3.1. Stars (High Growth, High Market Share)
- 4.3.2. Cash Cows (Low Growth, High Market Share)
- 4.3.3. Question Mark (High Growth, Low Market Share)
- 4.3.4. Dogs (Low Growth, Low Market Share)
- 4.4. Ansoff Matrix Analysis
- 4.5. Supply Chain Analysis
- 4.6. Regulatory Landscape
- 4.7. Current Market Potential and Opportunity Assessment (TAM–SAM–SOM Framework)
- 4.8. IMR Analyst Note
- 4.1. Porters Five Forces
- 5. Market Analysis, Insights and Forecast 2021-2033
- 5.1. Market Analysis, Insights and Forecast - by Application
- 5.1.1. Entertainment Industry
- 5.1.2. Public Welfare Industry
- 5.1.3. Tourism Industry
- 5.1.4. Diplomacy
- 5.2. Market Analysis, Insights and Forecast - by Types
- 5.2.1. Without Animals
- 5.2.2. With Animal
- 5.3. Market Analysis, Insights and Forecast - by Region
- 5.3.1. North America
- 5.3.2. South America
- 5.3.3. Europe
- 5.3.4. Middle East & Africa
- 5.3.5. Asia Pacific
- 5.1. Market Analysis, Insights and Forecast - by Application
- 6. Global Circus Performance Analysis, Insights and Forecast, 2021-2033
- 6.1. Market Analysis, Insights and Forecast - by Application
- 6.1.1. Entertainment Industry
- 6.1.2. Public Welfare Industry
- 6.1.3. Tourism Industry
- 6.1.4. Diplomacy
- 6.2. Market Analysis, Insights and Forecast - by Types
- 6.2.1. Without Animals
- 6.2.2. With Animal
- 6.1. Market Analysis, Insights and Forecast - by Application
- 7. North America Circus Performance Analysis, Insights and Forecast, 2020-2032
- 7.1. Market Analysis, Insights and Forecast - by Application
- 7.1.1. Entertainment Industry
- 7.1.2. Public Welfare Industry
- 7.1.3. Tourism Industry
- 7.1.4. Diplomacy
- 7.2. Market Analysis, Insights and Forecast - by Types
- 7.2.1. Without Animals
- 7.2.2. With Animal
- 7.1. Market Analysis, Insights and Forecast - by Application
- 8. South America Circus Performance Analysis, Insights and Forecast, 2020-2032
- 8.1. Market Analysis, Insights and Forecast - by Application
- 8.1.1. Entertainment Industry
- 8.1.2. Public Welfare Industry
- 8.1.3. Tourism Industry
- 8.1.4. Diplomacy
- 8.2. Market Analysis, Insights and Forecast - by Types
- 8.2.1. Without Animals
- 8.2.2. With Animal
- 8.1. Market Analysis, Insights and Forecast - by Application
- 9. Europe Circus Performance Analysis, Insights and Forecast, 2020-2032
- 9.1. Market Analysis, Insights and Forecast - by Application
- 9.1.1. Entertainment Industry
- 9.1.2. Public Welfare Industry
- 9.1.3. Tourism Industry
- 9.1.4. Diplomacy
- 9.2. Market Analysis, Insights and Forecast - by Types
- 9.2.1. Without Animals
- 9.2.2. With Animal
- 9.1. Market Analysis, Insights and Forecast - by Application
- 10. Middle East & Africa Circus Performance Analysis, Insights and Forecast, 2020-2032
- 10.1. Market Analysis, Insights and Forecast - by Application
- 10.1.1. Entertainment Industry
- 10.1.2. Public Welfare Industry
- 10.1.3. Tourism Industry
- 10.1.4. Diplomacy
- 10.2. Market Analysis, Insights and Forecast - by Types
- 10.2.1. Without Animals
- 10.2.2. With Animal
- 10.1. Market Analysis, Insights and Forecast - by Application
- 11. Asia Pacific Circus Performance Analysis, Insights and Forecast, 2020-2032
- 11.1. Market Analysis, Insights and Forecast - by Application
- 11.1.1. Entertainment Industry
- 11.1.2. Public Welfare Industry
- 11.1.3. Tourism Industry
- 11.1.4. Diplomacy
- 11.2. Market Analysis, Insights and Forecast - by Types
- 11.2.1. Without Animals
- 11.2.2. With Animal
- 11.1. Market Analysis, Insights and Forecast - by Application
- 12. Competitive Analysis
- 12.1. Company Profiles
- 12.1.1 Cirque du Soleil
- 12.1.1.1. Company Overview
- 12.1.1.2. Products
- 12.1.1.3. Company Financials
- 12.1.1.4. SWOT Analysis
- 12.1.2 The Great Moscow Circus
- 12.1.2.1. Company Overview
- 12.1.2.2. Products
- 12.1.2.3. Company Financials
- 12.1.2.4. SWOT Analysis
- 12.1.3 Russia
- 12.1.3.1. Company Overview
- 12.1.3.2. Products
- 12.1.3.3. Company Financials
- 12.1.3.4. SWOT Analysis
- 12.1.4 Big Apple Circus
- 12.1.4.1. Company Overview
- 12.1.4.2. Products
- 12.1.4.3. Company Financials
- 12.1.4.4. SWOT Analysis
- 12.1.5 Shanghai Zaji
- 12.1.5.1. Company Overview
- 12.1.5.2. Products
- 12.1.5.3. Company Financials
- 12.1.5.4. SWOT Analysis
- 12.1.6 Royal Circus
- 12.1.6.1. Company Overview
- 12.1.6.2. Products
- 12.1.6.3. Company Financials
- 12.1.6.4. SWOT Analysis
- 12.1.7 Changlong Group
- 12.1.7.1. Company Overview
- 12.1.7.2. Products
- 12.1.7.3. Company Financials
- 12.1.7.4. SWOT Analysis
- 12.1.8 Chongqin Zaji
- 12.1.8.1. Company Overview
- 12.1.8.2. Products
- 12.1.8.3. Company Financials
- 12.1.8.4. SWOT Analysis
- 12.1.9 Feld Entertainment
- 12.1.9.1. Company Overview
- 12.1.9.2. Products
- 12.1.9.3. Company Financials
- 12.1.9.4. SWOT Analysis
- 12.1.1 Cirque du Soleil
- 12.2. Market Entropy
- 12.2.1 Company's Key Areas Served
- 12.2.2 Recent Developments
- 12.3. Company Market Share Analysis 2025
- 12.3.1 Top 5 Companies Market Share Analysis
- 12.3.2 Top 3 Companies Market Share Analysis
- 12.4. List of Potential Customers
- 13. Research Methodology
List of Figures
- Figure 1: Global Circus Performance Revenue Breakdown (billion, %) by Region 2025 & 2033
- Figure 2: North America Circus Performance Revenue (billion), by Application 2025 & 2033
- Figure 3: North America Circus Performance Revenue Share (%), by Application 2025 & 2033
- Figure 4: North America Circus Performance Revenue (billion), by Types 2025 & 2033
- Figure 5: North America Circus Performance Revenue Share (%), by Types 2025 & 2033
- Figure 6: North America Circus Performance Revenue (billion), by Country 2025 & 2033
- Figure 7: North America Circus Performance Revenue Share (%), by Country 2025 & 2033
- Figure 8: South America Circus Performance Revenue (billion), by Application 2025 & 2033
- Figure 9: South America Circus Performance Revenue Share (%), by Application 2025 & 2033
- Figure 10: South America Circus Performance Revenue (billion), by Types 2025 & 2033
- Figure 11: South America Circus Performance Revenue Share (%), by Types 2025 & 2033
- Figure 12: South America Circus Performance Revenue (billion), by Country 2025 & 2033
- Figure 13: South America Circus Performance Revenue Share (%), by Country 2025 & 2033
- Figure 14: Europe Circus Performance Revenue (billion), by Application 2025 & 2033
- Figure 15: Europe Circus Performance Revenue Share (%), by Application 2025 & 2033
- Figure 16: Europe Circus Performance Revenue (billion), by Types 2025 & 2033
- Figure 17: Europe Circus Performance Revenue Share (%), by Types 2025 & 2033
- Figure 18: Europe Circus Performance Revenue (billion), by Country 2025 & 2033
- Figure 19: Europe Circus Performance Revenue Share (%), by Country 2025 & 2033
- Figure 20: Middle East & Africa Circus Performance Revenue (billion), by Application 2025 & 2033
- Figure 21: Middle East & Africa Circus Performance Revenue Share (%), by Application 2025 & 2033
- Figure 22: Middle East & Africa Circus Performance Revenue (billion), by Types 2025 & 2033
- Figure 23: Middle East & Africa Circus Performance Revenue Share (%), by Types 2025 & 2033
- Figure 24: Middle East & Africa Circus Performance Revenue (billion), by Country 2025 & 2033
- Figure 25: Middle East & Africa Circus Performance Revenue Share (%), by Country 2025 & 2033
- Figure 26: Asia Pacific Circus Performance Revenue (billion), by Application 2025 & 2033
- Figure 27: Asia Pacific Circus Performance Revenue Share (%), by Application 2025 & 2033
- Figure 28: Asia Pacific Circus Performance Revenue (billion), by Types 2025 & 2033
- Figure 29: Asia Pacific Circus Performance Revenue Share (%), by Types 2025 & 2033
- Figure 30: Asia Pacific Circus Performance Revenue (billion), by Country 2025 & 2033
- Figure 31: Asia Pacific Circus Performance Revenue Share (%), by Country 2025 & 2033
List of Tables
- Table 1: Global Circus Performance Revenue billion Forecast, by Application 2020 & 2033
- Table 2: Global Circus Performance Revenue billion Forecast, by Types 2020 & 2033
- Table 3: Global Circus Performance Revenue billion Forecast, by Region 2020 & 2033
- Table 4: Global Circus Performance Revenue billion Forecast, by Application 2020 & 2033
- Table 5: Global Circus Performance Revenue billion Forecast, by Types 2020 & 2033
- Table 6: Global Circus Performance Revenue billion Forecast, by Country 2020 & 2033
- Table 7: United States Circus Performance Revenue (billion) Forecast, by Application 2020 & 2033
- Table 8: Canada Circus Performance Revenue (billion) Forecast, by Application 2020 & 2033
- Table 9: Mexico Circus Performance Revenue (billion) Forecast, by Application 2020 & 2033
- Table 10: Global Circus Performance Revenue billion Forecast, by Application 2020 & 2033
- Table 11: Global Circus Performance Revenue billion Forecast, by Types 2020 & 2033
- Table 12: Global Circus Performance Revenue billion Forecast, by Country 2020 & 2033
- Table 13: Brazil Circus Performance Revenue (billion) Forecast, by Application 2020 & 2033
- Table 14: Argentina Circus Performance Revenue (billion) Forecast, by Application 2020 & 2033
- Table 15: Rest of South America Circus Performance Revenue (billion) Forecast, by Application 2020 & 2033
- Table 16: Global Circus Performance Revenue billion Forecast, by Application 2020 & 2033
- Table 17: Global Circus Performance Revenue billion Forecast, by Types 2020 & 2033
- Table 18: Global Circus Performance Revenue billion Forecast, by Country 2020 & 2033
- Table 19: United Kingdom Circus Performance Revenue (billion) Forecast, by Application 2020 & 2033
- Table 20: Germany Circus Performance Revenue (billion) Forecast, by Application 2020 & 2033
- Table 21: France Circus Performance Revenue (billion) Forecast, by Application 2020 & 2033
- Table 22: Italy Circus Performance Revenue (billion) Forecast, by Application 2020 & 2033
- Table 23: Spain Circus Performance Revenue (billion) Forecast, by Application 2020 & 2033
- Table 24: Russia Circus Performance Revenue (billion) Forecast, by Application 2020 & 2033
- Table 25: Benelux Circus Performance Revenue (billion) Forecast, by Application 2020 & 2033
- Table 26: Nordics Circus Performance Revenue (billion) Forecast, by Application 2020 & 2033
- Table 27: Rest of Europe Circus Performance Revenue (billion) Forecast, by Application 2020 & 2033
- Table 28: Global Circus Performance Revenue billion Forecast, by Application 2020 & 2033
- Table 29: Global Circus Performance Revenue billion Forecast, by Types 2020 & 2033
- Table 30: Global Circus Performance Revenue billion Forecast, by Country 2020 & 2033
- Table 31: Turkey Circus Performance Revenue (billion) Forecast, by Application 2020 & 2033
- Table 32: Israel Circus Performance Revenue (billion) Forecast, by Application 2020 & 2033
- Table 33: GCC Circus Performance Revenue (billion) Forecast, by Application 2020 & 2033
- Table 34: North Africa Circus Performance Revenue (billion) Forecast, by Application 2020 & 2033
- Table 35: South Africa Circus Performance Revenue (billion) Forecast, by Application 2020 & 2033
- Table 36: Rest of Middle East & Africa Circus Performance Revenue (billion) Forecast, by Application 2020 & 2033
- Table 37: Global Circus Performance Revenue billion Forecast, by Application 2020 & 2033
- Table 38: Global Circus Performance Revenue billion Forecast, by Types 2020 & 2033
- Table 39: Global Circus Performance Revenue billion Forecast, by Country 2020 & 2033
- Table 40: China Circus Performance Revenue (billion) Forecast, by Application 2020 & 2033
- Table 41: India Circus Performance Revenue (billion) Forecast, by Application 2020 & 2033
- Table 42: Japan Circus Performance Revenue (billion) Forecast, by Application 2020 & 2033
- Table 43: South Korea Circus Performance Revenue (billion) Forecast, by Application 2020 & 2033
- Table 44: ASEAN Circus Performance Revenue (billion) Forecast, by Application 2020 & 2033
- Table 45: Oceania Circus Performance Revenue (billion) Forecast, by Application 2020 & 2033
- Table 46: Rest of Asia Pacific Circus Performance Revenue (billion) Forecast, by Application 2020 & 2033
Frequently Asked Questions
1. What is the projected Compound Annual Growth Rate (CAGR) of the Circus Performance?
The projected CAGR is approximately 5.3%.
2. Which companies are prominent players in the Circus Performance?
Key companies in the market include Cirque du Soleil, The Great Moscow Circus, Russia, Big Apple Circus, Shanghai Zaji, Royal Circus, Changlong Group, Chongqin Zaji, Feld Entertainment.
3. What are the main segments of the Circus Performance?
The market segments include Application, Types.
4. Can you provide details about the market size?
The market size is estimated to be USD 2.74 billion as of 2022.
5. What are some drivers contributing to market growth?
N/A
6. What are the notable trends driving market growth?
N/A
7. Are there any restraints impacting market growth?
N/A
8. Can you provide examples of recent developments in the market?
N/A
9. What pricing options are available for accessing the report?
Pricing options include single-user, multi-user, and enterprise licenses priced at USD 4900.00, USD 7350.00, and USD 9800.00 respectively.
10. Is the market size provided in terms of value or volume?
The market size is provided in terms of value, measured in billion.
11. Are there any specific market keywords associated with the report?
Yes, the market keyword associated with the report is "Circus Performance," which aids in identifying and referencing the specific market segment covered.
12. How do I determine which pricing option suits my needs best?
The pricing options vary based on user requirements and access needs. Individual users may opt for single-user licenses, while businesses requiring broader access may choose multi-user or enterprise licenses for cost-effective access to the report.
13. Are there any additional resources or data provided in the Circus Performance report?
While the report offers comprehensive insights, it's advisable to review the specific contents or supplementary materials provided to ascertain if additional resources or data are available.
14. How can I stay updated on further developments or reports in the Circus Performance?
To stay informed about further developments, trends, and reports in the Circus Performance, consider subscribing to industry newsletters, following relevant companies and organizations, or regularly checking reputable industry news sources and publications.
Methodology
Step 1 - Identification of Relevant Samples Size from Population Database


Step 2 - Approaches for Defining Global Market Size (Value, Volume* & Price*)

Note*: In applicable scenarios
Step 3 - Data Sources
Primary Research
- Web Analytics
- Survey Reports
- Research Institute
- Latest Research Reports
- Opinion Leaders
Secondary Research
- Annual Reports
- White Paper
- Latest Press Release
- Industry Association
- Paid Database
- Investor Presentations

Step 4 - Data Triangulation
Involves using different sources of information in order to increase the validity of a study
These sources are likely to be stakeholders in a program - participants, other researchers, program staff, other community members, and so on.
Then we put all data in single framework & apply various statistical tools to find out the dynamic on the market.
During the analysis stage, feedback from the stakeholder groups would be compared to determine areas of agreement as well as areas of divergence