

Key Insights
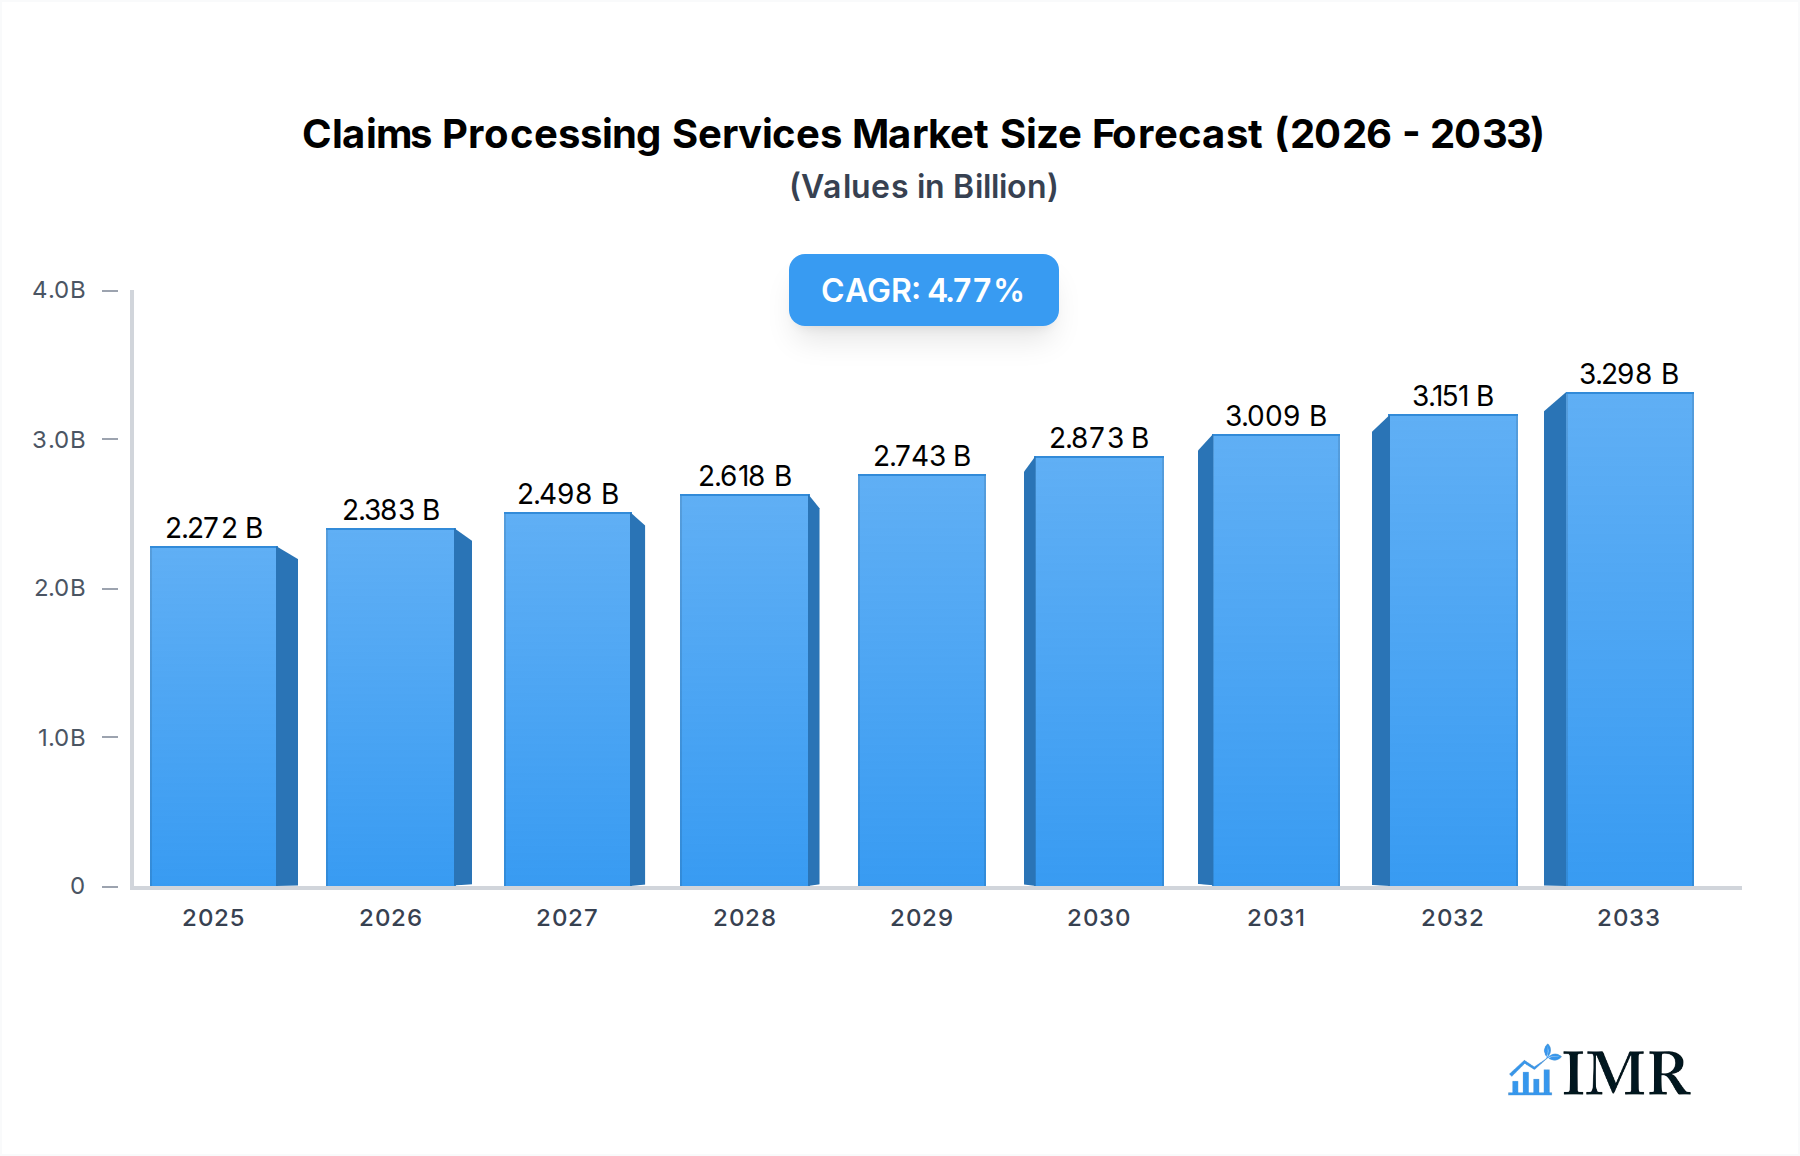
The global Claims Processing Services market is poised for robust expansion, projected to reach an impressive $2272 million by 2025, driven by a CAGR of 4.8% through 2033. This significant growth is underpinned by the increasing complexity of insurance policies and a growing demand for efficient, accurate, and cost-effective claims management across various industries. The market is witnessing a surge in adoption by both Large Enterprises and SMEs, recognizing the strategic advantage of outsourcing these critical functions to specialized providers. Key drivers include the relentless pursuit of operational efficiency, the need to reduce processing costs, and the desire to enhance customer satisfaction through faster and more transparent claims settlements. The digital transformation wave, with its emphasis on automation and AI-powered solutions, is profoundly reshaping the claims processing landscape, enabling quicker data analysis, fraud detection, and streamlined workflows.

Claims Processing Services Market Size (In Billion)
The market's dynamism is further characterized by evolving trends, such as the increasing integration of advanced technologies like AI, machine learning, and blockchain to improve accuracy and security. There's a notable shift towards cloud-based claims processing platforms, offering scalability and accessibility. However, challenges persist, including stringent regulatory compliance requirements and the ongoing need for skilled personnel to manage complex claims. The competitive landscape is dynamic, featuring a mix of established outsourcing giants and specialized niche players. Geographically, North America and Europe are leading the market, owing to mature insurance sectors and early adoption of technology. Asia Pacific is emerging as a high-growth region, fueled by increasing insurance penetration and the rising demand for outsourcing services. The segmentation by application clearly highlights the broad appeal of these services, while the types of processing, such as Property Claims Processing and Medical Claims Processing, showcase the specialized expertise offered by market participants like Flatworld Solutions, Tech2Globe, and Invensis Technologies.
Claims Processing Services Company Market Share
Claims Processing Services Market: Comprehensive Analysis and Future Outlook (2019-2033)
This in-depth report provides a thorough examination of the global Claims Processing Services market, a critical function within the insurance and healthcare industries. Covering the Study Period of 2019–2033, with Base Year and Estimated Year as 2025, and Forecast Period of 2025–2033, this analysis delves into market dynamics, growth trends, regional dominance, product landscape, key drivers, emerging opportunities, and the competitive strategies of major players. Our findings are presented with quantitative insights and qualitative assessments, offering actionable intelligence for stakeholders.
Claims Processing Services Market Dynamics & Structure
The Claims Processing Services market exhibits a moderately concentrated structure, with key players like Flatworld Solutions, Tech2Globe, Invensis Technologies, and Rely Services holding significant market shares. Technological innovation, particularly advancements in Artificial Intelligence (AI), Machine Learning (ML), and Robotic Process Automation (RPA), are the primary drivers of market evolution. These technologies enhance efficiency, reduce processing times, and improve accuracy in both Property Claims Processing and Medical Claims Processing. Regulatory frameworks, such as HIPAA for medical claims and various insurance regulations for property claims, play a crucial role in shaping operational standards and data security protocols. Competitive product substitutes, including in-house processing capabilities and emerging InsurTech solutions, present a dynamic competitive landscape. End-user demographics, characterized by an increasing demand for faster and more transparent claims resolution, are influencing service providers to adopt more customer-centric approaches. Mergers and Acquisitions (M&A) trends are evident, with larger entities acquiring specialized service providers to expand their service offerings and geographic reach.
- Market Concentration: Moderately concentrated, with a mix of large established players and niche specialists.
- Technological Innovation Drivers: AI, ML, RPA for automation, fraud detection, and predictive analytics.
- Regulatory Frameworks: HIPAA, GDPR, and various national insurance regulations influencing data privacy and operational compliance.
- Competitive Product Substitutes: In-house processing, InsurTech platforms, and shared service centers.
- End-User Demographics: Demand for speed, transparency, and digital self-service options.
- M&A Trends: Strategic acquisitions to gain market share, acquire new technologies, and expand service portfolios.
Claims Processing Services Growth Trends & Insights
The global Claims Processing Services market is poised for robust growth, driven by the increasing volume of claims across various sectors, particularly within the parent market of insurance and the child market of healthcare. Market size evolution is anticipated to be significant, with the market projected to reach $XX billion by 2033, exhibiting a Compound Annual Growth Rate (CAGR) of approximately XX% during the Forecast Period (2025–2033). Adoption rates of outsourced claims processing services are on a steady rise as organizations seek to optimize costs, improve operational efficiency, and focus on core competencies. Technological disruptions, including the integration of blockchain for enhanced data security and immutability, and advanced analytics for fraud detection and risk assessment, are transforming the claims landscape. Consumer behavior shifts are also influencing the market; policyholders expect faster claim settlements, personalized communication, and digital access to claim status updates, pushing service providers to invest in user-friendly platforms and omnichannel communication strategies. The child market for Medical Claims Processing is experiencing accelerated growth due to the complexities of healthcare billing, rising healthcare costs, and the increasing prevalence of chronic diseases, leading to a higher volume of claims. Conversely, the parent market of Property Claims Processing is experiencing steady growth, influenced by an increase in extreme weather events and evolving insurance policies.
- Market Size Evolution: Projected to reach $XX billion by 2033.
- CAGR: Approximately XX% during the Forecast Period (2025–2033).
- Adoption Rates: Increasing adoption of outsourced claims processing by insurers and healthcare providers.
- Technological Disruptions: Integration of blockchain, advanced analytics, and AI/ML for efficiency and fraud prevention.
- Consumer Behavior Shifts: Demand for faster settlements, digital access, and personalized communication.
- Market Penetration: Deeper penetration into both Large Enterprises and SMEs segments.
Dominant Regions, Countries, or Segments in Claims Processing Services
The North America region is identified as the dominant force in the Claims Processing Services market, driven by the presence of a highly developed insurance and healthcare infrastructure, stringent regulatory compliance requirements, and a strong propensity for technology adoption. The United States, within North America, stands out as the leading country due to its massive insurance market and complex healthcare system, which necessitates efficient and accurate Medical Claims Processing. The adoption of advanced technologies like AI and RPA is particularly pronounced in this region, leading to significant improvements in processing speed and accuracy for both Property Claims Processing and Medical Claims Processing. The parent market of insurance in North America, coupled with the substantial child market of healthcare, creates a fertile ground for specialized claims processing service providers.
- Dominant Region: North America.
- Leading Country: United States.
- Key Segment Drivers:
- Medical Claims Processing: Driven by the complexities of healthcare billing, rising healthcare expenditures, and adherence to regulations like HIPAA.
- Property Claims Processing: Influenced by the frequency and severity of natural disasters, evolving insurance policies, and the need for rapid damage assessment and payout.
- Market Share: North America is estimated to hold XX% of the global market share in 2025.
- Growth Potential: High growth potential due to continuous technological investment and an increasing demand for outsourced services.
Claims Processing Services Product Landscape
The Claims Processing Services product landscape is characterized by a spectrum of innovative solutions designed to streamline and automate the entire claims lifecycle. Providers are offering end-to-end platforms, encompassing initial claim intake, verification, adjudication, fraud detection, and payment processing. Key product innovations include intelligent document processing, which leverages AI to extract relevant information from claim forms and supporting documents, significantly reducing manual data entry. Performance metrics for these services focus on reduction in processing time, improvement in accuracy rates, decreased fraud instances, and enhanced customer satisfaction scores. Unique selling propositions often revolve around the speed and accuracy of settlements, the robustness of fraud detection capabilities, and the seamless integration with existing enterprise systems. Technological advancements are continually pushing the boundaries of efficiency and accuracy, with a growing emphasis on predictive analytics to anticipate claim trends and potential issues.
Key Drivers, Barriers & Challenges in Claims Processing Services
Key Drivers:
- Cost Optimization: Outsourcing claims processing allows organizations to reduce operational overheads and headcount.
- Efficiency and Speed: Advanced technologies like AI and RPA accelerate processing times, leading to faster claim settlements.
- Enhanced Accuracy and Fraud Detection: Sophisticated algorithms and analytics minimize errors and identify fraudulent claims more effectively.
- Focus on Core Competencies: Enables insurers and healthcare providers to concentrate on their strategic business objectives.
- Regulatory Compliance: Specialized service providers ensure adherence to evolving compliance mandates.
Barriers & Challenges:
- Data Security and Privacy Concerns: Handling sensitive policyholder and patient data requires robust security measures, with breaches posing significant risks.
- Integration Complexities: Integrating new claims processing systems with legacy IT infrastructure can be challenging and costly.
- Resistance to Change: Internal reluctance to adopt new technologies and outsourcing models can hinder adoption.
- Talent Acquisition and Retention: A shortage of skilled professionals in AI, data analytics, and claims adjudication poses a challenge.
- Regulatory Hurdles: Navigating diverse and evolving regulatory landscapes across different jurisdictions can be complex.
- Competitive Pressures: Intense competition among service providers drives pricing pressures and necessitates continuous innovation.
Emerging Opportunities in Claims Processing Services
Emerging opportunities in the Claims Processing Services market lie in the untapped potential of emerging economies and the growing demand for specialized services. The rise of insurtech and fintech is creating new avenues for integrated claims management solutions. The increasing adoption of IoT devices for risk assessment and damage reporting in property insurance presents a significant opportunity for real-time claims processing. Furthermore, the growing complexity of healthcare claims, particularly with the advent of personalized medicine and advanced treatments, will drive the demand for highly specialized Medical Claims Processing expertise. The development of blockchain-based claims platforms offers a promising avenue for enhanced transparency and security.
Growth Accelerators in the Claims Processing Services Industry
Catalysts for long-term growth in the Claims Processing Services industry are multifaceted, driven by continuous technological innovation, strategic partnerships, and evolving market demands. The ongoing development and adoption of AI and ML algorithms for predictive analytics and automated decision-making will significantly enhance efficiency and reduce costs. Strategic partnerships between claims processing service providers and InsurTech startups are accelerating the development and deployment of cutting-edge solutions. Market expansion strategies, including geographical diversification and the offering of specialized vertical services, will further fuel growth. The increasing focus on customer experience, with demand for omnichannel engagement and self-service portals, will drive the development of more user-centric claims processing solutions.
Key Players Shaping the Claims Processing Services Market
- Flatworld Solutions
- Tech2Globe
- Invensis Technologies
- Rely Services
- OutsourceRCM
- Connext
- American Medical Association
- PLEXIS Healthcare Systems
- ARDEM
- Marsh McLennan
- Allianze
- Comarch
- Marlinblue
- Deloitte
- Fusion
- WNS
Notable Milestones in Claims Processing Services Sector
- 2019: WNS expands its BPO offerings with a focus on digital transformation in insurance claims.
- 2020: Invensis Technologies enhances its AI capabilities for accelerated Medical Claims Processing.
- 2021: Marsh McLennan acquires a majority stake in a leading fraud detection analytics firm, strengthening its claims investigation services.
- 2022: Flatworld Solutions introduces an advanced RPA solution for efficient Property Claims Processing.
- 2023 (Q1): Deloitte launches a new cloud-based claims management platform for Large Enterprises.
- 2023 (Q3): Tech2Globe announces a strategic partnership with a leading healthcare data analytics firm to improve claims adjudication.
- 2024 (Q1): Rely Services expands its operational footprint in the European market, focusing on Medical Claims Processing for SMEs.
- 2024 (Q2): Comarch rolls out a comprehensive digital solution for end-to-end claims management.
- 2024 (Q3): PLEXIS Healthcare Systems enhances its platform with advanced natural language processing (NLP) for claim summarization.
- 2024 (Q4): ARDEM invests in new AI models to improve subrogation recovery rates for insurance claims.
In-Depth Claims Processing Services Market Outlook
The Claims Processing Services market is set for sustained growth, propelled by a confluence of technological advancements, evolving industry demands, and strategic market expansions. The integration of AI, ML, and blockchain technologies will continue to be a primary growth accelerator, enabling greater automation, enhanced fraud detection, and improved data security. Strategic partnerships between established players and innovative InsurTech startups will foster the development of next-generation solutions. The increasing demand for specialized Medical Claims Processing services, driven by healthcare complexities, and the steady demand for efficient Property Claims Processing, influenced by environmental factors, will continue to shape market dynamics. The market outlook indicates significant opportunities for providers who can offer scalable, secure, and customer-centric claims processing solutions, particularly catering to both Large Enterprises and SMEs.
Claims Processing Services Segmentation
-
1. Application
- 1.1. Large Enterprises
- 1.2. SMEs
-
2. Types
- 2.1. Property Claims Processing
- 2.2. Medical Claims Processing
Claims Processing Services Segmentation By Geography
-
1. North America
- 1.1. United States
- 1.2. Canada
- 1.3. Mexico
-
2. South America
- 2.1. Brazil
- 2.2. Argentina
- 2.3. Rest of South America
-
3. Europe
- 3.1. United Kingdom
- 3.2. Germany
- 3.3. France
- 3.4. Italy
- 3.5. Spain
- 3.6. Russia
- 3.7. Benelux
- 3.8. Nordics
- 3.9. Rest of Europe
-
4. Middle East & Africa
- 4.1. Turkey
- 4.2. Israel
- 4.3. GCC
- 4.4. North Africa
- 4.5. South Africa
- 4.6. Rest of Middle East & Africa
-
5. Asia Pacific
- 5.1. China
- 5.2. India
- 5.3. Japan
- 5.4. South Korea
- 5.5. ASEAN
- 5.6. Oceania
- 5.7. Rest of Asia Pacific

Claims Processing Services Regional Market Share
Geographic Coverage of Claims Processing Services
Claims Processing Services REPORT HIGHLIGHTS
| Aspects | Details |
|---|---|
| Study Period | 2020-2034 |
| Base Year | 2025 |
| Estimated Year | 2026 |
| Forecast Period | 2026-2034 |
| Historical Period | 2020-2025 |
| Growth Rate | CAGR of 4.8% from 2020-2034 |
| Segmentation |
|
Table of Contents
- 1. Introduction
- 1.1. Research Scope
- 1.2. Market Segmentation
- 1.3. Research Methodology
- 1.4. Definitions and Assumptions
- 2. Executive Summary
- 2.1. Introduction
- 3. Market Dynamics
- 3.1. Introduction
- 3.2. Market Drivers
- 3.3. Market Restrains
- 3.4. Market Trends
- 4. Market Factor Analysis
- 4.1. Porters Five Forces
- 4.2. Supply/Value Chain
- 4.3. PESTEL analysis
- 4.4. Market Entropy
- 4.5. Patent/Trademark Analysis
- 5. Global Claims Processing Services Analysis, Insights and Forecast, 2020-2032
- 5.1. Market Analysis, Insights and Forecast - by Application
- 5.1.1. Large Enterprises
- 5.1.2. SMEs
- 5.2. Market Analysis, Insights and Forecast - by Types
- 5.2.1. Property Claims Processing
- 5.2.2. Medical Claims Processing
- 5.3. Market Analysis, Insights and Forecast - by Region
- 5.3.1. North America
- 5.3.2. South America
- 5.3.3. Europe
- 5.3.4. Middle East & Africa
- 5.3.5. Asia Pacific
- 5.1. Market Analysis, Insights and Forecast - by Application
- 6. North America Claims Processing Services Analysis, Insights and Forecast, 2020-2032
- 6.1. Market Analysis, Insights and Forecast - by Application
- 6.1.1. Large Enterprises
- 6.1.2. SMEs
- 6.2. Market Analysis, Insights and Forecast - by Types
- 6.2.1. Property Claims Processing
- 6.2.2. Medical Claims Processing
- 6.1. Market Analysis, Insights and Forecast - by Application
- 7. South America Claims Processing Services Analysis, Insights and Forecast, 2020-2032
- 7.1. Market Analysis, Insights and Forecast - by Application
- 7.1.1. Large Enterprises
- 7.1.2. SMEs
- 7.2. Market Analysis, Insights and Forecast - by Types
- 7.2.1. Property Claims Processing
- 7.2.2. Medical Claims Processing
- 7.1. Market Analysis, Insights and Forecast - by Application
- 8. Europe Claims Processing Services Analysis, Insights and Forecast, 2020-2032
- 8.1. Market Analysis, Insights and Forecast - by Application
- 8.1.1. Large Enterprises
- 8.1.2. SMEs
- 8.2. Market Analysis, Insights and Forecast - by Types
- 8.2.1. Property Claims Processing
- 8.2.2. Medical Claims Processing
- 8.1. Market Analysis, Insights and Forecast - by Application
- 9. Middle East & Africa Claims Processing Services Analysis, Insights and Forecast, 2020-2032
- 9.1. Market Analysis, Insights and Forecast - by Application
- 9.1.1. Large Enterprises
- 9.1.2. SMEs
- 9.2. Market Analysis, Insights and Forecast - by Types
- 9.2.1. Property Claims Processing
- 9.2.2. Medical Claims Processing
- 9.1. Market Analysis, Insights and Forecast - by Application
- 10. Asia Pacific Claims Processing Services Analysis, Insights and Forecast, 2020-2032
- 10.1. Market Analysis, Insights and Forecast - by Application
- 10.1.1. Large Enterprises
- 10.1.2. SMEs
- 10.2. Market Analysis, Insights and Forecast - by Types
- 10.2.1. Property Claims Processing
- 10.2.2. Medical Claims Processing
- 10.1. Market Analysis, Insights and Forecast - by Application
- 11. Competitive Analysis
- 11.1. Global Market Share Analysis 2025
- 11.2. Company Profiles
- 11.2.1 Flatworld Solutions
- 11.2.1.1. Overview
- 11.2.1.2. Products
- 11.2.1.3. SWOT Analysis
- 11.2.1.4. Recent Developments
- 11.2.1.5. Financials (Based on Availability)
- 11.2.2 Tech2Globe
- 11.2.2.1. Overview
- 11.2.2.2. Products
- 11.2.2.3. SWOT Analysis
- 11.2.2.4. Recent Developments
- 11.2.2.5. Financials (Based on Availability)
- 11.2.3 Invensis Technologies
- 11.2.3.1. Overview
- 11.2.3.2. Products
- 11.2.3.3. SWOT Analysis
- 11.2.3.4. Recent Developments
- 11.2.3.5. Financials (Based on Availability)
- 11.2.4 Rely Services
- 11.2.4.1. Overview
- 11.2.4.2. Products
- 11.2.4.3. SWOT Analysis
- 11.2.4.4. Recent Developments
- 11.2.4.5. Financials (Based on Availability)
- 11.2.5 OutsourceRCM
- 11.2.5.1. Overview
- 11.2.5.2. Products
- 11.2.5.3. SWOT Analysis
- 11.2.5.4. Recent Developments
- 11.2.5.5. Financials (Based on Availability)
- 11.2.6 Connext
- 11.2.6.1. Overview
- 11.2.6.2. Products
- 11.2.6.3. SWOT Analysis
- 11.2.6.4. Recent Developments
- 11.2.6.5. Financials (Based on Availability)
- 11.2.7 American Medical Association
- 11.2.7.1. Overview
- 11.2.7.2. Products
- 11.2.7.3. SWOT Analysis
- 11.2.7.4. Recent Developments
- 11.2.7.5. Financials (Based on Availability)
- 11.2.8 PLEXIS Healthcare Systems
- 11.2.8.1. Overview
- 11.2.8.2. Products
- 11.2.8.3. SWOT Analysis
- 11.2.8.4. Recent Developments
- 11.2.8.5. Financials (Based on Availability)
- 11.2.9 ARDEM
- 11.2.9.1. Overview
- 11.2.9.2. Products
- 11.2.9.3. SWOT Analysis
- 11.2.9.4. Recent Developments
- 11.2.9.5. Financials (Based on Availability)
- 11.2.10 Marsh McLennan
- 11.2.10.1. Overview
- 11.2.10.2. Products
- 11.2.10.3. SWOT Analysis
- 11.2.10.4. Recent Developments
- 11.2.10.5. Financials (Based on Availability)
- 11.2.11 Allianze
- 11.2.11.1. Overview
- 11.2.11.2. Products
- 11.2.11.3. SWOT Analysis
- 11.2.11.4. Recent Developments
- 11.2.11.5. Financials (Based on Availability)
- 11.2.12 Comarch
- 11.2.12.1. Overview
- 11.2.12.2. Products
- 11.2.12.3. SWOT Analysis
- 11.2.12.4. Recent Developments
- 11.2.12.5. Financials (Based on Availability)
- 11.2.13 Marlinblue
- 11.2.13.1. Overview
- 11.2.13.2. Products
- 11.2.13.3. SWOT Analysis
- 11.2.13.4. Recent Developments
- 11.2.13.5. Financials (Based on Availability)
- 11.2.14 Deloitte
- 11.2.14.1. Overview
- 11.2.14.2. Products
- 11.2.14.3. SWOT Analysis
- 11.2.14.4. Recent Developments
- 11.2.14.5. Financials (Based on Availability)
- 11.2.15 Fusion
- 11.2.15.1. Overview
- 11.2.15.2. Products
- 11.2.15.3. SWOT Analysis
- 11.2.15.4. Recent Developments
- 11.2.15.5. Financials (Based on Availability)
- 11.2.16 WNS
- 11.2.16.1. Overview
- 11.2.16.2. Products
- 11.2.16.3. SWOT Analysis
- 11.2.16.4. Recent Developments
- 11.2.16.5. Financials (Based on Availability)
- 11.2.1 Flatworld Solutions
List of Figures
- Figure 1: Global Claims Processing Services Revenue Breakdown (million, %) by Region 2025 & 2033
- Figure 2: North America Claims Processing Services Revenue (million), by Application 2025 & 2033
- Figure 3: North America Claims Processing Services Revenue Share (%), by Application 2025 & 2033
- Figure 4: North America Claims Processing Services Revenue (million), by Types 2025 & 2033
- Figure 5: North America Claims Processing Services Revenue Share (%), by Types 2025 & 2033
- Figure 6: North America Claims Processing Services Revenue (million), by Country 2025 & 2033
- Figure 7: North America Claims Processing Services Revenue Share (%), by Country 2025 & 2033
- Figure 8: South America Claims Processing Services Revenue (million), by Application 2025 & 2033
- Figure 9: South America Claims Processing Services Revenue Share (%), by Application 2025 & 2033
- Figure 10: South America Claims Processing Services Revenue (million), by Types 2025 & 2033
- Figure 11: South America Claims Processing Services Revenue Share (%), by Types 2025 & 2033
- Figure 12: South America Claims Processing Services Revenue (million), by Country 2025 & 2033
- Figure 13: South America Claims Processing Services Revenue Share (%), by Country 2025 & 2033
- Figure 14: Europe Claims Processing Services Revenue (million), by Application 2025 & 2033
- Figure 15: Europe Claims Processing Services Revenue Share (%), by Application 2025 & 2033
- Figure 16: Europe Claims Processing Services Revenue (million), by Types 2025 & 2033
- Figure 17: Europe Claims Processing Services Revenue Share (%), by Types 2025 & 2033
- Figure 18: Europe Claims Processing Services Revenue (million), by Country 2025 & 2033
- Figure 19: Europe Claims Processing Services Revenue Share (%), by Country 2025 & 2033
- Figure 20: Middle East & Africa Claims Processing Services Revenue (million), by Application 2025 & 2033
- Figure 21: Middle East & Africa Claims Processing Services Revenue Share (%), by Application 2025 & 2033
- Figure 22: Middle East & Africa Claims Processing Services Revenue (million), by Types 2025 & 2033
- Figure 23: Middle East & Africa Claims Processing Services Revenue Share (%), by Types 2025 & 2033
- Figure 24: Middle East & Africa Claims Processing Services Revenue (million), by Country 2025 & 2033
- Figure 25: Middle East & Africa Claims Processing Services Revenue Share (%), by Country 2025 & 2033
- Figure 26: Asia Pacific Claims Processing Services Revenue (million), by Application 2025 & 2033
- Figure 27: Asia Pacific Claims Processing Services Revenue Share (%), by Application 2025 & 2033
- Figure 28: Asia Pacific Claims Processing Services Revenue (million), by Types 2025 & 2033
- Figure 29: Asia Pacific Claims Processing Services Revenue Share (%), by Types 2025 & 2033
- Figure 30: Asia Pacific Claims Processing Services Revenue (million), by Country 2025 & 2033
- Figure 31: Asia Pacific Claims Processing Services Revenue Share (%), by Country 2025 & 2033
List of Tables
- Table 1: Global Claims Processing Services Revenue million Forecast, by Application 2020 & 2033
- Table 2: Global Claims Processing Services Revenue million Forecast, by Types 2020 & 2033
- Table 3: Global Claims Processing Services Revenue million Forecast, by Region 2020 & 2033
- Table 4: Global Claims Processing Services Revenue million Forecast, by Application 2020 & 2033
- Table 5: Global Claims Processing Services Revenue million Forecast, by Types 2020 & 2033
- Table 6: Global Claims Processing Services Revenue million Forecast, by Country 2020 & 2033
- Table 7: United States Claims Processing Services Revenue (million) Forecast, by Application 2020 & 2033
- Table 8: Canada Claims Processing Services Revenue (million) Forecast, by Application 2020 & 2033
- Table 9: Mexico Claims Processing Services Revenue (million) Forecast, by Application 2020 & 2033
- Table 10: Global Claims Processing Services Revenue million Forecast, by Application 2020 & 2033
- Table 11: Global Claims Processing Services Revenue million Forecast, by Types 2020 & 2033
- Table 12: Global Claims Processing Services Revenue million Forecast, by Country 2020 & 2033
- Table 13: Brazil Claims Processing Services Revenue (million) Forecast, by Application 2020 & 2033
- Table 14: Argentina Claims Processing Services Revenue (million) Forecast, by Application 2020 & 2033
- Table 15: Rest of South America Claims Processing Services Revenue (million) Forecast, by Application 2020 & 2033
- Table 16: Global Claims Processing Services Revenue million Forecast, by Application 2020 & 2033
- Table 17: Global Claims Processing Services Revenue million Forecast, by Types 2020 & 2033
- Table 18: Global Claims Processing Services Revenue million Forecast, by Country 2020 & 2033
- Table 19: United Kingdom Claims Processing Services Revenue (million) Forecast, by Application 2020 & 2033
- Table 20: Germany Claims Processing Services Revenue (million) Forecast, by Application 2020 & 2033
- Table 21: France Claims Processing Services Revenue (million) Forecast, by Application 2020 & 2033
- Table 22: Italy Claims Processing Services Revenue (million) Forecast, by Application 2020 & 2033
- Table 23: Spain Claims Processing Services Revenue (million) Forecast, by Application 2020 & 2033
- Table 24: Russia Claims Processing Services Revenue (million) Forecast, by Application 2020 & 2033
- Table 25: Benelux Claims Processing Services Revenue (million) Forecast, by Application 2020 & 2033
- Table 26: Nordics Claims Processing Services Revenue (million) Forecast, by Application 2020 & 2033
- Table 27: Rest of Europe Claims Processing Services Revenue (million) Forecast, by Application 2020 & 2033
- Table 28: Global Claims Processing Services Revenue million Forecast, by Application 2020 & 2033
- Table 29: Global Claims Processing Services Revenue million Forecast, by Types 2020 & 2033
- Table 30: Global Claims Processing Services Revenue million Forecast, by Country 2020 & 2033
- Table 31: Turkey Claims Processing Services Revenue (million) Forecast, by Application 2020 & 2033
- Table 32: Israel Claims Processing Services Revenue (million) Forecast, by Application 2020 & 2033
- Table 33: GCC Claims Processing Services Revenue (million) Forecast, by Application 2020 & 2033
- Table 34: North Africa Claims Processing Services Revenue (million) Forecast, by Application 2020 & 2033
- Table 35: South Africa Claims Processing Services Revenue (million) Forecast, by Application 2020 & 2033
- Table 36: Rest of Middle East & Africa Claims Processing Services Revenue (million) Forecast, by Application 2020 & 2033
- Table 37: Global Claims Processing Services Revenue million Forecast, by Application 2020 & 2033
- Table 38: Global Claims Processing Services Revenue million Forecast, by Types 2020 & 2033
- Table 39: Global Claims Processing Services Revenue million Forecast, by Country 2020 & 2033
- Table 40: China Claims Processing Services Revenue (million) Forecast, by Application 2020 & 2033
- Table 41: India Claims Processing Services Revenue (million) Forecast, by Application 2020 & 2033
- Table 42: Japan Claims Processing Services Revenue (million) Forecast, by Application 2020 & 2033
- Table 43: South Korea Claims Processing Services Revenue (million) Forecast, by Application 2020 & 2033
- Table 44: ASEAN Claims Processing Services Revenue (million) Forecast, by Application 2020 & 2033
- Table 45: Oceania Claims Processing Services Revenue (million) Forecast, by Application 2020 & 2033
- Table 46: Rest of Asia Pacific Claims Processing Services Revenue (million) Forecast, by Application 2020 & 2033
Frequently Asked Questions
1. What is the projected Compound Annual Growth Rate (CAGR) of the Claims Processing Services?
The projected CAGR is approximately 4.8%.
2. Which companies are prominent players in the Claims Processing Services?
Key companies in the market include Flatworld Solutions, Tech2Globe, Invensis Technologies, Rely Services, OutsourceRCM, Connext, American Medical Association, PLEXIS Healthcare Systems, ARDEM, Marsh McLennan, Allianze, Comarch, Marlinblue, Deloitte, Fusion, WNS.
3. What are the main segments of the Claims Processing Services?
The market segments include Application, Types.
4. Can you provide details about the market size?
The market size is estimated to be USD 2272 million as of 2022.
5. What are some drivers contributing to market growth?
N/A
6. What are the notable trends driving market growth?
N/A
7. Are there any restraints impacting market growth?
N/A
8. Can you provide examples of recent developments in the market?
N/A
9. What pricing options are available for accessing the report?
Pricing options include single-user, multi-user, and enterprise licenses priced at USD 4900.00, USD 7350.00, and USD 9800.00 respectively.
10. Is the market size provided in terms of value or volume?
The market size is provided in terms of value, measured in million.
11. Are there any specific market keywords associated with the report?
Yes, the market keyword associated with the report is "Claims Processing Services," which aids in identifying and referencing the specific market segment covered.
12. How do I determine which pricing option suits my needs best?
The pricing options vary based on user requirements and access needs. Individual users may opt for single-user licenses, while businesses requiring broader access may choose multi-user or enterprise licenses for cost-effective access to the report.
13. Are there any additional resources or data provided in the Claims Processing Services report?
While the report offers comprehensive insights, it's advisable to review the specific contents or supplementary materials provided to ascertain if additional resources or data are available.
14. How can I stay updated on further developments or reports in the Claims Processing Services?
To stay informed about further developments, trends, and reports in the Claims Processing Services, consider subscribing to industry newsletters, following relevant companies and organizations, or regularly checking reputable industry news sources and publications.
Methodology
Step 1 - Identification of Relevant Samples Size from Population Database


Step 2 - Approaches for Defining Global Market Size (Value, Volume* & Price*)

Note*: In applicable scenarios
Step 3 - Data Sources
Primary Research
- Web Analytics
- Survey Reports
- Research Institute
- Latest Research Reports
- Opinion Leaders
Secondary Research
- Annual Reports
- White Paper
- Latest Press Release
- Industry Association
- Paid Database
- Investor Presentations

Step 4 - Data Triangulation
Involves using different sources of information in order to increase the validity of a study
These sources are likely to be stakeholders in a program - participants, other researchers, program staff, other community members, and so on.
Then we put all data in single framework & apply various statistical tools to find out the dynamic on the market.
During the analysis stage, feedback from the stakeholder groups would be compared to determine areas of agreement as well as areas of divergence