

Key Insights
The coextruded profiles market is poised for significant expansion, driven by escalating demand across key industries. This growth is underpinned by the inherent advantages of coextrusion, including superior material performance, enhanced aesthetic appeal, and cost efficiencies over conventional manufacturing. Applications are widespread, spanning automotive, construction, packaging, and electronics, underscoring the versatility of this technology. The market is projected to reach $12.16 billion by 2033, exhibiting a Compound Annual Growth Rate (CAGR) of 12.31% from a 2025 base year.
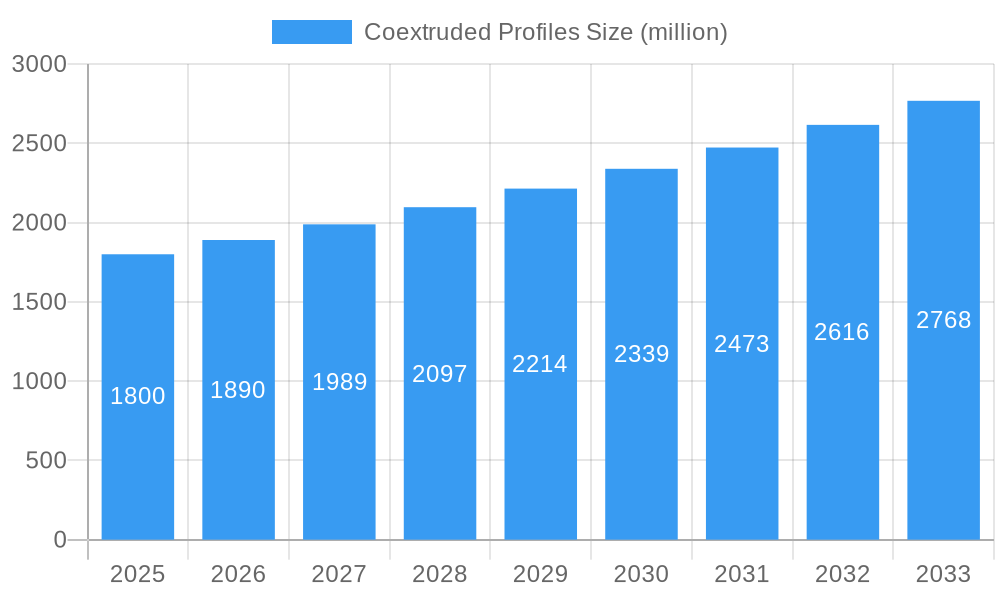
Coextruded Profiles Market Size (In Billion)
Key growth catalysts include the accelerating adoption of lightweight materials in the automotive and construction sectors, the rising demand for advanced packaging solutions with superior barrier properties, and continuous advancements in extrusion processes. The market is also experiencing a surge in demand for customized coextruded profiles, tailored to specific client needs, further fueling market penetration.
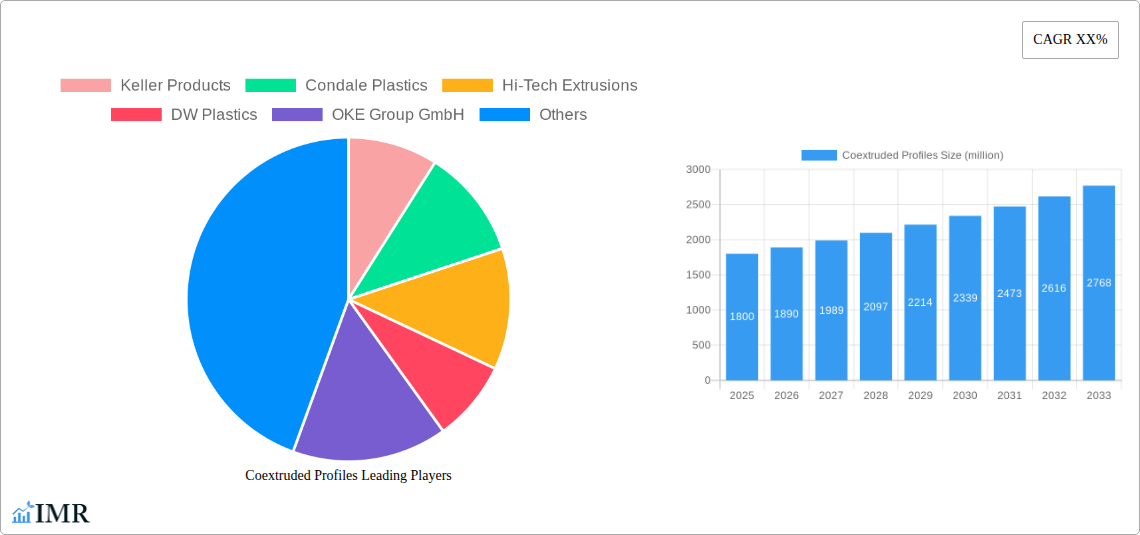
Coextruded Profiles Company Market Share
While the market presents substantial opportunities, certain challenges persist. Volatility in raw material prices, particularly for polymers, impacts manufacturer profitability and pricing strategies. Technical complexities associated with coextrusion, such as material compatibility and precise process control, also pose hurdles. Nevertheless, ongoing technological innovations and evolving industry expertise are actively addressing these constraints. The competitive landscape features both established industry leaders and niche-focused emerging companies, indicating a dynamic market ripe for strategic investment. Geographically, North America and Europe currently dominate market share, with robust growth anticipated in the Asia-Pacific region, propelled by escalating industrialization and infrastructure development.
Coextruded Profiles Market Report: 2019-2033
This comprehensive report provides a detailed analysis of the coextruded profiles market, offering invaluable insights for industry professionals, investors, and strategic decision-makers. Covering the period from 2019 to 2033, with a base year of 2025 and a forecast period of 2025-2033, this report leverages extensive primary and secondary research to deliver a complete understanding of market dynamics, growth trends, and future opportunities. The market is segmented by material type, application, and geography, providing granular data to support informed decision-making. The report assesses market size in million units.
Coextruded Profiles Market Dynamics & Structure
This section analyzes the competitive landscape of the coextruded profiles market, focusing on market concentration, technological advancements, regulatory influences, and market trends from 2019-2024 and future projections up to 2033. The analysis includes a deep dive into merger and acquisition (M&A) activity, identifying key players and their strategic moves.
- Market Concentration: The market exhibits a moderately fragmented structure with several key players commanding significant market share. The top five players hold an estimated xx% of the market share in 2025.
- Technological Innovation: Continuous advancements in extrusion technologies, material science, and additive manufacturing drive innovation. This includes the development of higher-performance materials with enhanced properties like improved barrier properties and recyclability.
- Regulatory Framework: Stringent environmental regulations regarding material composition and recyclability are significantly influencing market dynamics. This has accelerated the adoption of eco-friendly materials and sustainable manufacturing processes.
- Competitive Product Substitutes: Alternative materials such as wood, metal, and other plastics pose a competitive threat. However, the superior properties of coextruded profiles in terms of durability, lightweight nature and design flexibility ensure continuing market demand.
- End-User Demographics: The primary end-users include the automotive, construction, packaging, and electronics industries. The construction and packaging industry showed the highest growth rate during the historical period and expected to dominate in the forecast period. Demand is driven by factors like increasing urbanization and rising consumer goods consumption.
- M&A Trends: The historical period (2019-2024) witnessed xx M&A deals, primarily driven by the need for increased market share and access to new technologies. The forecast period is projected to see an increase, with xx deals expected. This consolidation is likely to further shape the market landscape.
Coextruded Profiles Growth Trends & Insights
This section delves into the growth trajectory of the coextruded profiles market, analyzing market size evolution, adoption rates, and the impact of technological disruptions and consumer behavior shifts from 2019 to 2033.
The global coextruded profiles market experienced substantial growth during the historical period (2019-2024), driven by increasing demand across various industries. The market size was valued at xx million units in 2024 and is projected to reach xx million units by 2033, exhibiting a CAGR of xx% during the forecast period (2025-2033). This growth is fueled by several factors including increasing demand from the construction and packaging industries and technological advancements in coextrusion technologies. The adoption rate of coextruded profiles has increased steadily due to their versatility and superior performance compared to conventional materials. Emerging trends such as sustainable materials and lightweight designs are further accelerating market expansion. Consumer preference shifts towards eco-friendly and durable products are also positively influencing the market growth.
Dominant Regions, Countries, or Segments in Coextruded Profiles
This section identifies the leading geographical regions and segments driving market growth.
- Dominant Region: North America and Europe are currently the leading regions in the coextruded profiles market, holding a combined market share of xx% in 2025. Strong industrial infrastructure, high disposable income, and increased construction activities contribute to this dominance.
- Key Drivers:
- North America: Robust construction sector, increasing automotive production, and favorable government policies supporting manufacturing.
- Europe: High demand from the packaging industry, stringent environmental regulations promoting sustainable materials, and focus on efficient resource management.
- Asia-Pacific: Rapid industrialization, growing population, and increasing investments in infrastructure development are driving market growth in this region.
- Market Share & Growth Potential: While North America and Europe currently hold a larger market share, the Asia-Pacific region is expected to experience the highest growth rate during the forecast period, driven by rapid economic development and industrial expansion.
Coextruded Profiles Product Landscape
Coextruded profiles offer a wide array of products tailored to specific applications. These profiles are designed with customized combinations of layers, each possessing unique properties, enabling functionalities such as enhanced barrier protection, increased rigidity, improved thermal insulation, and superior aesthetic appeal. Ongoing product innovation focuses on improving material sustainability and enhancing performance metrics. Recent advancements include the integration of recycled content, bio-based materials, and the development of profiles with superior impact resistance.
Key Drivers, Barriers & Challenges in Coextruded Profiles
Key Drivers:
- Increasing demand from the construction industry for durable and energy-efficient materials.
- Growing automotive sector and increasing preference for lightweight vehicles.
- Advancements in coextrusion technology, leading to improved product performance and versatility.
- Rising consumer awareness of sustainable and eco-friendly materials.
Key Challenges and Restraints:
- Fluctuations in raw material prices and supply chain disruptions can impact profitability.
- Stringent environmental regulations necessitate the adoption of sustainable practices, incurring additional costs.
- Intense competition from substitute materials and established players in the market.
- Technological advancements require ongoing investments in R&D and manufacturing infrastructure.
Emerging Opportunities in Coextruded Profiles
- Growing demand for eco-friendly and sustainable materials creates opportunities for bio-based and recycled content coextruded profiles.
- Innovative applications in emerging industries like renewable energy and aerospace present untapped market potential.
- Customized solutions and value-added services offer opportunities for differentiation and premium pricing.
- Expansion into emerging markets with high growth potential.
Growth Accelerators in the Coextruded Profiles Industry
Technological breakthroughs in extrusion processes, strategic collaborations fostering innovation, and expansion into new geographical markets are key growth drivers. The development of smart materials with integrated sensors and advanced functionalities is opening new avenues for applications.
Key Players Shaping the Coextruded Profiles Market
- Keller Products
- Condale Plastics
- Hi-Tech Extrusions
- DW Plastics
- OKE Group GmbH
- United Plastic Components Inc
- HD Plastics
- Aalborg Gummivarefabrik A/S
- Gemini Group
- Polymer Vision Technology
- Ram Extrusion Ltd
- Universal Plastics
- Mojak Plastics
- Preferred Plastics
- Lakeland Plastics
Notable Milestones in Coextruded Profiles Sector
- 2020: Introduction of a new biodegradable coextruded profile by [Company Name].
- 2022: Merger between [Company A] and [Company B], leading to increased market share.
- 2023: Launch of a new high-performance coextruded profile with enhanced barrier properties by [Company Name].
- 2024: Significant investments in R&D leading to the development of recycled content profiles by multiple key players.
In-Depth Coextruded Profiles Market Outlook
The coextruded profiles market is poised for robust growth throughout the forecast period, driven by continuous technological advancements, increasing demand from diverse industries, and a growing focus on sustainability. Strategic partnerships, expansion into new applications, and the development of innovative materials will shape the future of the market. The focus on lightweighting and sustainable practices will further enhance the market's growth trajectory.
Coextruded Profiles Segmentation
-
1. Application
- 1.1. Automotive
- 1.2. Aerospace
- 1.3. Electric
- 1.4. Medical
- 1.5. Construction
- 1.6. Furnishings
- 1.7. Others
-
2. Types
- 2.1. Plastic
- 2.2. Rubber
Coextruded Profiles Segmentation By Geography
-
1. North America
- 1.1. United States
- 1.2. Canada
- 1.3. Mexico
-
2. South America
- 2.1. Brazil
- 2.2. Argentina
- 2.3. Rest of South America
-
3. Europe
- 3.1. United Kingdom
- 3.2. Germany
- 3.3. France
- 3.4. Italy
- 3.5. Spain
- 3.6. Russia
- 3.7. Benelux
- 3.8. Nordics
- 3.9. Rest of Europe
-
4. Middle East & Africa
- 4.1. Turkey
- 4.2. Israel
- 4.3. GCC
- 4.4. North Africa
- 4.5. South Africa
- 4.6. Rest of Middle East & Africa
-
5. Asia Pacific
- 5.1. China
- 5.2. India
- 5.3. Japan
- 5.4. South Korea
- 5.5. ASEAN
- 5.6. Oceania
- 5.7. Rest of Asia Pacific

Coextruded Profiles Regional Market Share
Geographic Coverage of Coextruded Profiles
Coextruded Profiles REPORT HIGHLIGHTS
| Aspects | Details |
|---|---|
| Study Period | 2020-2034 |
| Base Year | 2025 |
| Estimated Year | 2026 |
| Forecast Period | 2026-2034 |
| Historical Period | 2020-2025 |
| Growth Rate | CAGR of 12.31% from 2020-2034 |
| Segmentation |
|
Table of Contents
- 1. Introduction
- 1.1. Research Scope
- 1.2. Market Segmentation
- 1.3. Research Objective
- 1.4. Definitions and Assumptions
- 2. Executive Summary
- 2.1. Market Snapshot
- 3. Market Dynamics
- 3.1. Market Drivers
- 3.2. Market Restrains
- 3.3. Market Trends
- 3.4. Market Opportunities
- 4. Market Factor Analysis
- 4.1. Porters Five Forces
- 4.1.1. Bargaining Power of Suppliers
- 4.1.2. Bargaining Power of Buyers
- 4.1.3. Threat of New Entrants
- 4.1.4. Threat of Substitutes
- 4.1.5. Competitive Rivalry
- 4.2. PESTEL analysis
- 4.3. BCG Analysis
- 4.3.1. Stars (High Growth, High Market Share)
- 4.3.2. Cash Cows (Low Growth, High Market Share)
- 4.3.3. Question Mark (High Growth, Low Market Share)
- 4.3.4. Dogs (Low Growth, Low Market Share)
- 4.4. Ansoff Matrix Analysis
- 4.5. Supply Chain Analysis
- 4.6. Regulatory Landscape
- 4.7. Current Market Potential and Opportunity Assessment (TAM–SAM–SOM Framework)
- 4.8. IMR Analyst Note
- 4.1. Porters Five Forces
- 5. Market Analysis, Insights and Forecast 2021-2033
- 5.1. Market Analysis, Insights and Forecast - by Application
- 5.1.1. Automotive
- 5.1.2. Aerospace
- 5.1.3. Electric
- 5.1.4. Medical
- 5.1.5. Construction
- 5.1.6. Furnishings
- 5.1.7. Others
- 5.2. Market Analysis, Insights and Forecast - by Types
- 5.2.1. Plastic
- 5.2.2. Rubber
- 5.3. Market Analysis, Insights and Forecast - by Region
- 5.3.1. North America
- 5.3.2. South America
- 5.3.3. Europe
- 5.3.4. Middle East & Africa
- 5.3.5. Asia Pacific
- 5.1. Market Analysis, Insights and Forecast - by Application
- 6. Global Coextruded Profiles Analysis, Insights and Forecast, 2021-2033
- 6.1. Market Analysis, Insights and Forecast - by Application
- 6.1.1. Automotive
- 6.1.2. Aerospace
- 6.1.3. Electric
- 6.1.4. Medical
- 6.1.5. Construction
- 6.1.6. Furnishings
- 6.1.7. Others
- 6.2. Market Analysis, Insights and Forecast - by Types
- 6.2.1. Plastic
- 6.2.2. Rubber
- 6.1. Market Analysis, Insights and Forecast - by Application
- 7. North America Coextruded Profiles Analysis, Insights and Forecast, 2020-2032
- 7.1. Market Analysis, Insights and Forecast - by Application
- 7.1.1. Automotive
- 7.1.2. Aerospace
- 7.1.3. Electric
- 7.1.4. Medical
- 7.1.5. Construction
- 7.1.6. Furnishings
- 7.1.7. Others
- 7.2. Market Analysis, Insights and Forecast - by Types
- 7.2.1. Plastic
- 7.2.2. Rubber
- 7.1. Market Analysis, Insights and Forecast - by Application
- 8. South America Coextruded Profiles Analysis, Insights and Forecast, 2020-2032
- 8.1. Market Analysis, Insights and Forecast - by Application
- 8.1.1. Automotive
- 8.1.2. Aerospace
- 8.1.3. Electric
- 8.1.4. Medical
- 8.1.5. Construction
- 8.1.6. Furnishings
- 8.1.7. Others
- 8.2. Market Analysis, Insights and Forecast - by Types
- 8.2.1. Plastic
- 8.2.2. Rubber
- 8.1. Market Analysis, Insights and Forecast - by Application
- 9. Europe Coextruded Profiles Analysis, Insights and Forecast, 2020-2032
- 9.1. Market Analysis, Insights and Forecast - by Application
- 9.1.1. Automotive
- 9.1.2. Aerospace
- 9.1.3. Electric
- 9.1.4. Medical
- 9.1.5. Construction
- 9.1.6. Furnishings
- 9.1.7. Others
- 9.2. Market Analysis, Insights and Forecast - by Types
- 9.2.1. Plastic
- 9.2.2. Rubber
- 9.1. Market Analysis, Insights and Forecast - by Application
- 10. Middle East & Africa Coextruded Profiles Analysis, Insights and Forecast, 2020-2032
- 10.1. Market Analysis, Insights and Forecast - by Application
- 10.1.1. Automotive
- 10.1.2. Aerospace
- 10.1.3. Electric
- 10.1.4. Medical
- 10.1.5. Construction
- 10.1.6. Furnishings
- 10.1.7. Others
- 10.2. Market Analysis, Insights and Forecast - by Types
- 10.2.1. Plastic
- 10.2.2. Rubber
- 10.1. Market Analysis, Insights and Forecast - by Application
- 11. Asia Pacific Coextruded Profiles Analysis, Insights and Forecast, 2020-2032
- 11.1. Market Analysis, Insights and Forecast - by Application
- 11.1.1. Automotive
- 11.1.2. Aerospace
- 11.1.3. Electric
- 11.1.4. Medical
- 11.1.5. Construction
- 11.1.6. Furnishings
- 11.1.7. Others
- 11.2. Market Analysis, Insights and Forecast - by Types
- 11.2.1. Plastic
- 11.2.2. Rubber
- 11.1. Market Analysis, Insights and Forecast - by Application
- 12. Competitive Analysis
- 12.1. Company Profiles
- 12.1.1 Keller Products
- 12.1.1.1. Company Overview
- 12.1.1.2. Products
- 12.1.1.3. Company Financials
- 12.1.1.4. SWOT Analysis
- 12.1.2 Condale Plastics
- 12.1.2.1. Company Overview
- 12.1.2.2. Products
- 12.1.2.3. Company Financials
- 12.1.2.4. SWOT Analysis
- 12.1.3 Hi-Tech Extrusions
- 12.1.3.1. Company Overview
- 12.1.3.2. Products
- 12.1.3.3. Company Financials
- 12.1.3.4. SWOT Analysis
- 12.1.4 DW Plastics
- 12.1.4.1. Company Overview
- 12.1.4.2. Products
- 12.1.4.3. Company Financials
- 12.1.4.4. SWOT Analysis
- 12.1.5 OKE Group GmbH
- 12.1.5.1. Company Overview
- 12.1.5.2. Products
- 12.1.5.3. Company Financials
- 12.1.5.4. SWOT Analysis
- 12.1.6 United Plastic Components Inc
- 12.1.6.1. Company Overview
- 12.1.6.2. Products
- 12.1.6.3. Company Financials
- 12.1.6.4. SWOT Analysis
- 12.1.7 HD Plastics
- 12.1.7.1. Company Overview
- 12.1.7.2. Products
- 12.1.7.3. Company Financials
- 12.1.7.4. SWOT Analysis
- 12.1.8 Aalborg Gummivarefabrik A/S
- 12.1.8.1. Company Overview
- 12.1.8.2. Products
- 12.1.8.3. Company Financials
- 12.1.8.4. SWOT Analysis
- 12.1.9 Gemini Group
- 12.1.9.1. Company Overview
- 12.1.9.2. Products
- 12.1.9.3. Company Financials
- 12.1.9.4. SWOT Analysis
- 12.1.10 Polymer Vision Technology
- 12.1.10.1. Company Overview
- 12.1.10.2. Products
- 12.1.10.3. Company Financials
- 12.1.10.4. SWOT Analysis
- 12.1.11 Ram Extrusion Ltd
- 12.1.11.1. Company Overview
- 12.1.11.2. Products
- 12.1.11.3. Company Financials
- 12.1.11.4. SWOT Analysis
- 12.1.12 Universal Plastics
- 12.1.12.1. Company Overview
- 12.1.12.2. Products
- 12.1.12.3. Company Financials
- 12.1.12.4. SWOT Analysis
- 12.1.13 Mojak Plastics
- 12.1.13.1. Company Overview
- 12.1.13.2. Products
- 12.1.13.3. Company Financials
- 12.1.13.4. SWOT Analysis
- 12.1.14 Preferred Plastics
- 12.1.14.1. Company Overview
- 12.1.14.2. Products
- 12.1.14.3. Company Financials
- 12.1.14.4. SWOT Analysis
- 12.1.15 Lakeland Plastics
- 12.1.15.1. Company Overview
- 12.1.15.2. Products
- 12.1.15.3. Company Financials
- 12.1.15.4. SWOT Analysis
- 12.1.1 Keller Products
- 12.2. Market Entropy
- 12.2.1 Company's Key Areas Served
- 12.2.2 Recent Developments
- 12.3. Company Market Share Analysis 2025
- 12.3.1 Top 5 Companies Market Share Analysis
- 12.3.2 Top 3 Companies Market Share Analysis
- 12.4. List of Potential Customers
- 13. Research Methodology
List of Figures
- Figure 1: Global Coextruded Profiles Revenue Breakdown (billion, %) by Region 2025 & 2033
- Figure 2: Global Coextruded Profiles Volume Breakdown (K, %) by Region 2025 & 2033
- Figure 3: North America Coextruded Profiles Revenue (billion), by Application 2025 & 2033
- Figure 4: North America Coextruded Profiles Volume (K), by Application 2025 & 2033
- Figure 5: North America Coextruded Profiles Revenue Share (%), by Application 2025 & 2033
- Figure 6: North America Coextruded Profiles Volume Share (%), by Application 2025 & 2033
- Figure 7: North America Coextruded Profiles Revenue (billion), by Types 2025 & 2033
- Figure 8: North America Coextruded Profiles Volume (K), by Types 2025 & 2033
- Figure 9: North America Coextruded Profiles Revenue Share (%), by Types 2025 & 2033
- Figure 10: North America Coextruded Profiles Volume Share (%), by Types 2025 & 2033
- Figure 11: North America Coextruded Profiles Revenue (billion), by Country 2025 & 2033
- Figure 12: North America Coextruded Profiles Volume (K), by Country 2025 & 2033
- Figure 13: North America Coextruded Profiles Revenue Share (%), by Country 2025 & 2033
- Figure 14: North America Coextruded Profiles Volume Share (%), by Country 2025 & 2033
- Figure 15: South America Coextruded Profiles Revenue (billion), by Application 2025 & 2033
- Figure 16: South America Coextruded Profiles Volume (K), by Application 2025 & 2033
- Figure 17: South America Coextruded Profiles Revenue Share (%), by Application 2025 & 2033
- Figure 18: South America Coextruded Profiles Volume Share (%), by Application 2025 & 2033
- Figure 19: South America Coextruded Profiles Revenue (billion), by Types 2025 & 2033
- Figure 20: South America Coextruded Profiles Volume (K), by Types 2025 & 2033
- Figure 21: South America Coextruded Profiles Revenue Share (%), by Types 2025 & 2033
- Figure 22: South America Coextruded Profiles Volume Share (%), by Types 2025 & 2033
- Figure 23: South America Coextruded Profiles Revenue (billion), by Country 2025 & 2033
- Figure 24: South America Coextruded Profiles Volume (K), by Country 2025 & 2033
- Figure 25: South America Coextruded Profiles Revenue Share (%), by Country 2025 & 2033
- Figure 26: South America Coextruded Profiles Volume Share (%), by Country 2025 & 2033
- Figure 27: Europe Coextruded Profiles Revenue (billion), by Application 2025 & 2033
- Figure 28: Europe Coextruded Profiles Volume (K), by Application 2025 & 2033
- Figure 29: Europe Coextruded Profiles Revenue Share (%), by Application 2025 & 2033
- Figure 30: Europe Coextruded Profiles Volume Share (%), by Application 2025 & 2033
- Figure 31: Europe Coextruded Profiles Revenue (billion), by Types 2025 & 2033
- Figure 32: Europe Coextruded Profiles Volume (K), by Types 2025 & 2033
- Figure 33: Europe Coextruded Profiles Revenue Share (%), by Types 2025 & 2033
- Figure 34: Europe Coextruded Profiles Volume Share (%), by Types 2025 & 2033
- Figure 35: Europe Coextruded Profiles Revenue (billion), by Country 2025 & 2033
- Figure 36: Europe Coextruded Profiles Volume (K), by Country 2025 & 2033
- Figure 37: Europe Coextruded Profiles Revenue Share (%), by Country 2025 & 2033
- Figure 38: Europe Coextruded Profiles Volume Share (%), by Country 2025 & 2033
- Figure 39: Middle East & Africa Coextruded Profiles Revenue (billion), by Application 2025 & 2033
- Figure 40: Middle East & Africa Coextruded Profiles Volume (K), by Application 2025 & 2033
- Figure 41: Middle East & Africa Coextruded Profiles Revenue Share (%), by Application 2025 & 2033
- Figure 42: Middle East & Africa Coextruded Profiles Volume Share (%), by Application 2025 & 2033
- Figure 43: Middle East & Africa Coextruded Profiles Revenue (billion), by Types 2025 & 2033
- Figure 44: Middle East & Africa Coextruded Profiles Volume (K), by Types 2025 & 2033
- Figure 45: Middle East & Africa Coextruded Profiles Revenue Share (%), by Types 2025 & 2033
- Figure 46: Middle East & Africa Coextruded Profiles Volume Share (%), by Types 2025 & 2033
- Figure 47: Middle East & Africa Coextruded Profiles Revenue (billion), by Country 2025 & 2033
- Figure 48: Middle East & Africa Coextruded Profiles Volume (K), by Country 2025 & 2033
- Figure 49: Middle East & Africa Coextruded Profiles Revenue Share (%), by Country 2025 & 2033
- Figure 50: Middle East & Africa Coextruded Profiles Volume Share (%), by Country 2025 & 2033
- Figure 51: Asia Pacific Coextruded Profiles Revenue (billion), by Application 2025 & 2033
- Figure 52: Asia Pacific Coextruded Profiles Volume (K), by Application 2025 & 2033
- Figure 53: Asia Pacific Coextruded Profiles Revenue Share (%), by Application 2025 & 2033
- Figure 54: Asia Pacific Coextruded Profiles Volume Share (%), by Application 2025 & 2033
- Figure 55: Asia Pacific Coextruded Profiles Revenue (billion), by Types 2025 & 2033
- Figure 56: Asia Pacific Coextruded Profiles Volume (K), by Types 2025 & 2033
- Figure 57: Asia Pacific Coextruded Profiles Revenue Share (%), by Types 2025 & 2033
- Figure 58: Asia Pacific Coextruded Profiles Volume Share (%), by Types 2025 & 2033
- Figure 59: Asia Pacific Coextruded Profiles Revenue (billion), by Country 2025 & 2033
- Figure 60: Asia Pacific Coextruded Profiles Volume (K), by Country 2025 & 2033
- Figure 61: Asia Pacific Coextruded Profiles Revenue Share (%), by Country 2025 & 2033
- Figure 62: Asia Pacific Coextruded Profiles Volume Share (%), by Country 2025 & 2033
List of Tables
- Table 1: Global Coextruded Profiles Revenue billion Forecast, by Application 2020 & 2033
- Table 2: Global Coextruded Profiles Volume K Forecast, by Application 2020 & 2033
- Table 3: Global Coextruded Profiles Revenue billion Forecast, by Types 2020 & 2033
- Table 4: Global Coextruded Profiles Volume K Forecast, by Types 2020 & 2033
- Table 5: Global Coextruded Profiles Revenue billion Forecast, by Region 2020 & 2033
- Table 6: Global Coextruded Profiles Volume K Forecast, by Region 2020 & 2033
- Table 7: Global Coextruded Profiles Revenue billion Forecast, by Application 2020 & 2033
- Table 8: Global Coextruded Profiles Volume K Forecast, by Application 2020 & 2033
- Table 9: Global Coextruded Profiles Revenue billion Forecast, by Types 2020 & 2033
- Table 10: Global Coextruded Profiles Volume K Forecast, by Types 2020 & 2033
- Table 11: Global Coextruded Profiles Revenue billion Forecast, by Country 2020 & 2033
- Table 12: Global Coextruded Profiles Volume K Forecast, by Country 2020 & 2033
- Table 13: United States Coextruded Profiles Revenue (billion) Forecast, by Application 2020 & 2033
- Table 14: United States Coextruded Profiles Volume (K) Forecast, by Application 2020 & 2033
- Table 15: Canada Coextruded Profiles Revenue (billion) Forecast, by Application 2020 & 2033
- Table 16: Canada Coextruded Profiles Volume (K) Forecast, by Application 2020 & 2033
- Table 17: Mexico Coextruded Profiles Revenue (billion) Forecast, by Application 2020 & 2033
- Table 18: Mexico Coextruded Profiles Volume (K) Forecast, by Application 2020 & 2033
- Table 19: Global Coextruded Profiles Revenue billion Forecast, by Application 2020 & 2033
- Table 20: Global Coextruded Profiles Volume K Forecast, by Application 2020 & 2033
- Table 21: Global Coextruded Profiles Revenue billion Forecast, by Types 2020 & 2033
- Table 22: Global Coextruded Profiles Volume K Forecast, by Types 2020 & 2033
- Table 23: Global Coextruded Profiles Revenue billion Forecast, by Country 2020 & 2033
- Table 24: Global Coextruded Profiles Volume K Forecast, by Country 2020 & 2033
- Table 25: Brazil Coextruded Profiles Revenue (billion) Forecast, by Application 2020 & 2033
- Table 26: Brazil Coextruded Profiles Volume (K) Forecast, by Application 2020 & 2033
- Table 27: Argentina Coextruded Profiles Revenue (billion) Forecast, by Application 2020 & 2033
- Table 28: Argentina Coextruded Profiles Volume (K) Forecast, by Application 2020 & 2033
- Table 29: Rest of South America Coextruded Profiles Revenue (billion) Forecast, by Application 2020 & 2033
- Table 30: Rest of South America Coextruded Profiles Volume (K) Forecast, by Application 2020 & 2033
- Table 31: Global Coextruded Profiles Revenue billion Forecast, by Application 2020 & 2033
- Table 32: Global Coextruded Profiles Volume K Forecast, by Application 2020 & 2033
- Table 33: Global Coextruded Profiles Revenue billion Forecast, by Types 2020 & 2033
- Table 34: Global Coextruded Profiles Volume K Forecast, by Types 2020 & 2033
- Table 35: Global Coextruded Profiles Revenue billion Forecast, by Country 2020 & 2033
- Table 36: Global Coextruded Profiles Volume K Forecast, by Country 2020 & 2033
- Table 37: United Kingdom Coextruded Profiles Revenue (billion) Forecast, by Application 2020 & 2033
- Table 38: United Kingdom Coextruded Profiles Volume (K) Forecast, by Application 2020 & 2033
- Table 39: Germany Coextruded Profiles Revenue (billion) Forecast, by Application 2020 & 2033
- Table 40: Germany Coextruded Profiles Volume (K) Forecast, by Application 2020 & 2033
- Table 41: France Coextruded Profiles Revenue (billion) Forecast, by Application 2020 & 2033
- Table 42: France Coextruded Profiles Volume (K) Forecast, by Application 2020 & 2033
- Table 43: Italy Coextruded Profiles Revenue (billion) Forecast, by Application 2020 & 2033
- Table 44: Italy Coextruded Profiles Volume (K) Forecast, by Application 2020 & 2033
- Table 45: Spain Coextruded Profiles Revenue (billion) Forecast, by Application 2020 & 2033
- Table 46: Spain Coextruded Profiles Volume (K) Forecast, by Application 2020 & 2033
- Table 47: Russia Coextruded Profiles Revenue (billion) Forecast, by Application 2020 & 2033
- Table 48: Russia Coextruded Profiles Volume (K) Forecast, by Application 2020 & 2033
- Table 49: Benelux Coextruded Profiles Revenue (billion) Forecast, by Application 2020 & 2033
- Table 50: Benelux Coextruded Profiles Volume (K) Forecast, by Application 2020 & 2033
- Table 51: Nordics Coextruded Profiles Revenue (billion) Forecast, by Application 2020 & 2033
- Table 52: Nordics Coextruded Profiles Volume (K) Forecast, by Application 2020 & 2033
- Table 53: Rest of Europe Coextruded Profiles Revenue (billion) Forecast, by Application 2020 & 2033
- Table 54: Rest of Europe Coextruded Profiles Volume (K) Forecast, by Application 2020 & 2033
- Table 55: Global Coextruded Profiles Revenue billion Forecast, by Application 2020 & 2033
- Table 56: Global Coextruded Profiles Volume K Forecast, by Application 2020 & 2033
- Table 57: Global Coextruded Profiles Revenue billion Forecast, by Types 2020 & 2033
- Table 58: Global Coextruded Profiles Volume K Forecast, by Types 2020 & 2033
- Table 59: Global Coextruded Profiles Revenue billion Forecast, by Country 2020 & 2033
- Table 60: Global Coextruded Profiles Volume K Forecast, by Country 2020 & 2033
- Table 61: Turkey Coextruded Profiles Revenue (billion) Forecast, by Application 2020 & 2033
- Table 62: Turkey Coextruded Profiles Volume (K) Forecast, by Application 2020 & 2033
- Table 63: Israel Coextruded Profiles Revenue (billion) Forecast, by Application 2020 & 2033
- Table 64: Israel Coextruded Profiles Volume (K) Forecast, by Application 2020 & 2033
- Table 65: GCC Coextruded Profiles Revenue (billion) Forecast, by Application 2020 & 2033
- Table 66: GCC Coextruded Profiles Volume (K) Forecast, by Application 2020 & 2033
- Table 67: North Africa Coextruded Profiles Revenue (billion) Forecast, by Application 2020 & 2033
- Table 68: North Africa Coextruded Profiles Volume (K) Forecast, by Application 2020 & 2033
- Table 69: South Africa Coextruded Profiles Revenue (billion) Forecast, by Application 2020 & 2033
- Table 70: South Africa Coextruded Profiles Volume (K) Forecast, by Application 2020 & 2033
- Table 71: Rest of Middle East & Africa Coextruded Profiles Revenue (billion) Forecast, by Application 2020 & 2033
- Table 72: Rest of Middle East & Africa Coextruded Profiles Volume (K) Forecast, by Application 2020 & 2033
- Table 73: Global Coextruded Profiles Revenue billion Forecast, by Application 2020 & 2033
- Table 74: Global Coextruded Profiles Volume K Forecast, by Application 2020 & 2033
- Table 75: Global Coextruded Profiles Revenue billion Forecast, by Types 2020 & 2033
- Table 76: Global Coextruded Profiles Volume K Forecast, by Types 2020 & 2033
- Table 77: Global Coextruded Profiles Revenue billion Forecast, by Country 2020 & 2033
- Table 78: Global Coextruded Profiles Volume K Forecast, by Country 2020 & 2033
- Table 79: China Coextruded Profiles Revenue (billion) Forecast, by Application 2020 & 2033
- Table 80: China Coextruded Profiles Volume (K) Forecast, by Application 2020 & 2033
- Table 81: India Coextruded Profiles Revenue (billion) Forecast, by Application 2020 & 2033
- Table 82: India Coextruded Profiles Volume (K) Forecast, by Application 2020 & 2033
- Table 83: Japan Coextruded Profiles Revenue (billion) Forecast, by Application 2020 & 2033
- Table 84: Japan Coextruded Profiles Volume (K) Forecast, by Application 2020 & 2033
- Table 85: South Korea Coextruded Profiles Revenue (billion) Forecast, by Application 2020 & 2033
- Table 86: South Korea Coextruded Profiles Volume (K) Forecast, by Application 2020 & 2033
- Table 87: ASEAN Coextruded Profiles Revenue (billion) Forecast, by Application 2020 & 2033
- Table 88: ASEAN Coextruded Profiles Volume (K) Forecast, by Application 2020 & 2033
- Table 89: Oceania Coextruded Profiles Revenue (billion) Forecast, by Application 2020 & 2033
- Table 90: Oceania Coextruded Profiles Volume (K) Forecast, by Application 2020 & 2033
- Table 91: Rest of Asia Pacific Coextruded Profiles Revenue (billion) Forecast, by Application 2020 & 2033
- Table 92: Rest of Asia Pacific Coextruded Profiles Volume (K) Forecast, by Application 2020 & 2033
Frequently Asked Questions
1. What is the projected Compound Annual Growth Rate (CAGR) of the Coextruded Profiles?
The projected CAGR is approximately 12.31%.
2. Which companies are prominent players in the Coextruded Profiles?
Key companies in the market include Keller Products, Condale Plastics, Hi-Tech Extrusions, DW Plastics, OKE Group GmbH, United Plastic Components Inc, HD Plastics, Aalborg Gummivarefabrik A/S, Gemini Group, Polymer Vision Technology, Ram Extrusion Ltd, Universal Plastics, Mojak Plastics, Preferred Plastics, Lakeland Plastics.
3. What are the main segments of the Coextruded Profiles?
The market segments include Application, Types.
4. Can you provide details about the market size?
The market size is estimated to be USD 12.16 billion as of 2022.
5. What are some drivers contributing to market growth?
N/A
6. What are the notable trends driving market growth?
N/A
7. Are there any restraints impacting market growth?
N/A
8. Can you provide examples of recent developments in the market?
N/A
9. What pricing options are available for accessing the report?
Pricing options include single-user, multi-user, and enterprise licenses priced at USD 3950.00, USD 5925.00, and USD 7900.00 respectively.
10. Is the market size provided in terms of value or volume?
The market size is provided in terms of value, measured in billion and volume, measured in K.
11. Are there any specific market keywords associated with the report?
Yes, the market keyword associated with the report is "Coextruded Profiles," which aids in identifying and referencing the specific market segment covered.
12. How do I determine which pricing option suits my needs best?
The pricing options vary based on user requirements and access needs. Individual users may opt for single-user licenses, while businesses requiring broader access may choose multi-user or enterprise licenses for cost-effective access to the report.
13. Are there any additional resources or data provided in the Coextruded Profiles report?
While the report offers comprehensive insights, it's advisable to review the specific contents or supplementary materials provided to ascertain if additional resources or data are available.
14. How can I stay updated on further developments or reports in the Coextruded Profiles?
To stay informed about further developments, trends, and reports in the Coextruded Profiles, consider subscribing to industry newsletters, following relevant companies and organizations, or regularly checking reputable industry news sources and publications.
Methodology
Step 1 - Identification of Relevant Samples Size from Population Database


Step 2 - Approaches for Defining Global Market Size (Value, Volume* & Price*)

Note*: In applicable scenarios
Step 3 - Data Sources
Primary Research
- Web Analytics
- Survey Reports
- Research Institute
- Latest Research Reports
- Opinion Leaders
Secondary Research
- Annual Reports
- White Paper
- Latest Press Release
- Industry Association
- Paid Database
- Investor Presentations

Step 4 - Data Triangulation
Involves using different sources of information in order to increase the validity of a study
These sources are likely to be stakeholders in a program - participants, other researchers, program staff, other community members, and so on.
Then we put all data in single framework & apply various statistical tools to find out the dynamic on the market.
During the analysis stage, feedback from the stakeholder groups would be compared to determine areas of agreement as well as areas of divergence