

Key Insights
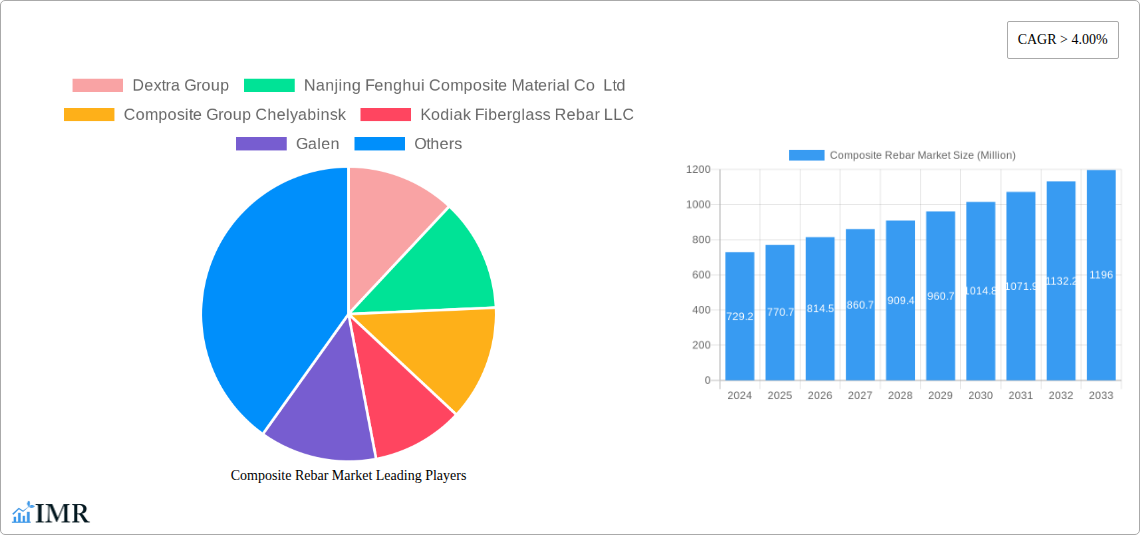
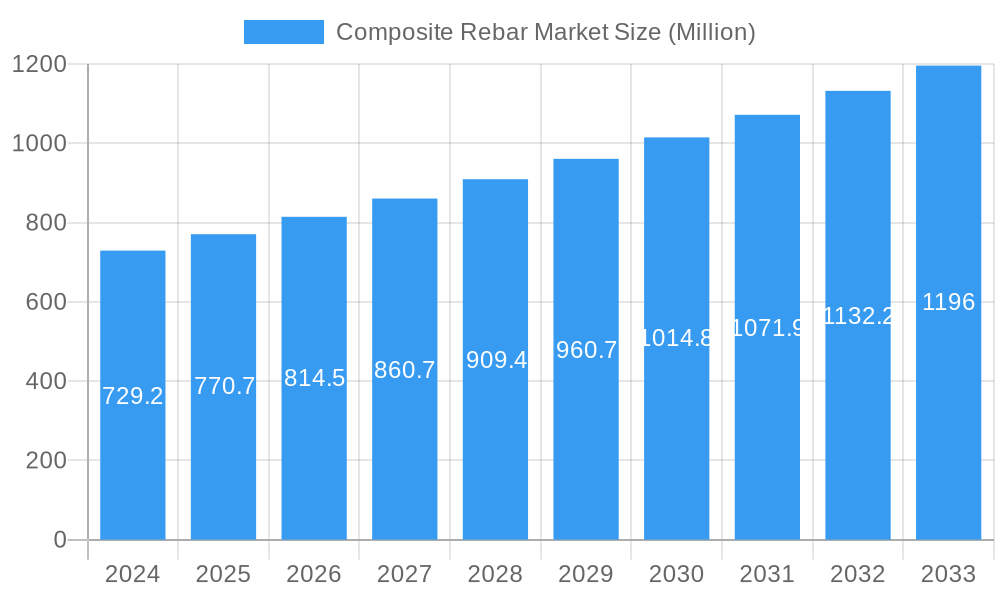
The global Composite Rebar market is projected for robust expansion, with a current estimated market size of USD 729.2 million in 2024, poised for significant growth. The market is expected to witness a Compound Annual Growth Rate (CAGR) of 5.7% over the forecast period of 2025-2033. This upward trajectory is primarily fueled by the increasing demand for corrosion-resistant and lightweight reinforcement materials in infrastructure projects. Key drivers include the growing emphasis on durable construction materials, particularly in coastal and chemically aggressive environments where traditional steel rebar rapidly degrades. The inherent advantages of composite rebars, such as their high tensile strength, electrical insulation, and reduced maintenance costs, are increasingly being recognized by engineers and developers. The market is further stimulated by government initiatives promoting sustainable construction practices and the development of advanced infrastructure.
Composite Rebar Market Market Size (In Million)
The market segmentation reveals a diverse landscape, with Glass Fiber Reinforced Polymer (GFRP) Rebar holding a dominant share due to its cost-effectiveness and widespread applicability. However, Carbon Fiber Reinforced Polymer (CFRP) Rebar and Basalt Fiber Reinforced Polymer (BFRP) Rebar are gaining traction for specialized applications demanding superior strength and performance. Applications in highways, bridges, and buildings represent the largest segment, driven by extensive construction and renovation activities worldwide. The marine structures & waterfronts, and water treatment plants segments are also experiencing substantial growth owing to the critical need for corrosion resistance in these environments. Regionally, Asia Pacific, led by China and India, is expected to be the fastest-growing market, owing to rapid urbanization and significant investments in infrastructure development.
Composite Rebar Market Company Market Share
This in-depth report provides a detailed analysis of the global composite rebar market, offering critical insights into its dynamics, growth trends, regional dominance, product landscape, key players, and future outlook. With a study period spanning from 2019 to 2033, and a base year of 2025, this research is designed to equip industry professionals with actionable intelligence for strategic decision-making. The market's evolution is meticulously tracked, from its historical trajectory (2019-2024) to its projected trajectory (2025-2033), ensuring a holistic understanding of its development.
Composite Rebar Market Dynamics & Structure
The global composite rebar market is characterized by a moderately fragmented structure, with a growing number of specialized manufacturers vying for market share. Technological innovation serves as a primary driver, fueled by the continuous pursuit of enhanced material properties such as superior strength-to-weight ratios, corrosion resistance, and electromagnetic transparency. Regulatory frameworks, particularly those focused on infrastructure development and material safety standards, are increasingly influencing product adoption. Competitive product substitutes, mainly traditional steel rebar, present a constant challenge, though the unique advantages of composite rebar are steadily gaining traction. End-user demographics are shifting towards sectors demanding durable, low-maintenance construction materials, such as infrastructure renewal and specialized industrial projects. Mergers and acquisitions (M&A) trends are emerging as key players consolidate their market positions and expand their technological capabilities. The market is projected to reach USD 3,500 million by 2033, with a Compound Annual Growth Rate (CAGR) of 6.5% from 2025.
- Market Concentration: Moderately fragmented, with increasing consolidation expected.
- Technological Innovation Drivers: Demand for corrosion resistance, lightweight materials, and electromagnetic neutrality.
- Regulatory Frameworks: Growing emphasis on sustainability and longevity in construction materials.
- Competitive Product Substitutes: Traditional steel rebar, with composite rebar offering distinct performance advantages.
- End-User Demographics: Infrastructure, marine, and specialized industrial construction sectors.
- M&A Trends: Strategic partnerships and acquisitions aimed at expanding product portfolios and global reach.
Composite Rebar Market Growth Trends & Insights
The global composite rebar market is experiencing robust growth, driven by increasing awareness of its superior performance characteristics compared to traditional steel rebar. The market size is projected to expand from an estimated USD 2,100 million in 2025 to USD 3,500 million by 2033, exhibiting a healthy CAGR of 6.5%. Adoption rates are steadily rising as construction projects increasingly prioritize longevity, reduced maintenance costs, and resistance to harsh environments. Technological disruptions, such as advancements in fiber manufacturing and polymer matrixes, are leading to the development of more efficient and cost-effective composite rebar solutions. Consumer behavior is shifting towards a preference for sustainable and durable building materials, making composite rebar a compelling choice for modern infrastructure. The market penetration of composite rebar is expected to grow significantly, particularly in regions with aggressive infrastructure development plans and stringent anti-corrosion requirements. The growing demand for lightweight yet strong materials in construction is a significant factor influencing market expansion.
Dominant Regions, Countries, or Segments in Composite Rebar Market
The Glass Fiber Reinforced Polymer (GFRP) Rebar segment is currently the dominant force in the composite rebar market, driven by its favorable cost-performance ratio and widespread adoption across various applications. North America and Europe are leading regions in terms of market value and consumption, attributed to substantial investments in infrastructure upgrades and a strong emphasis on durable construction materials.
- Product Type Dominance: GFRP Rebar dominates due to its balance of strength, corrosion resistance, and cost-effectiveness, holding an estimated 75% of the market share in 2025.
- High-Traffic Keywords: GFRP Rebar, Fiberglass Rebar, Corrosion Resistant Rebar, Durable Construction Materials.
- Application Dominance: Highways, Bridges & Buildings represent the largest application segment, accounting for approximately 60% of the market share in 2025. The need for long-lasting and low-maintenance infrastructure in these areas fuels demand.
- High-Traffic Keywords: Infrastructure Development, Bridge Construction, Building Materials, Road Reinforcement, Civil Engineering.
- Regional Dominance: North America, driven by the United States and Canada, is a key growth engine, with an estimated 30% market share in 2025. This is bolstered by government initiatives for infrastructure modernization and stringent building codes.
- High-Traffic Keywords: North America Composite Rebar, US Construction Market, Canadian Infrastructure, Market Growth.
- Key Drivers:
- Economic Policies: Government spending on infrastructure projects globally.
- Infrastructure Development: Urgent need for new and renovated transportation networks, utility systems, and public buildings.
- Corrosion Resistance: Essential for structures exposed to de-icing salts, coastal environments, and aggressive chemicals.
- Lightweight Properties: Facilitating easier handling and installation, reducing labor costs.
- Electromagnetic Transparency: Critical for sensitive facilities like hospitals and data centers.
The Carbon Fiber Reinforced Polymer (CFRP) Rebar segment, while smaller, is poised for significant growth due to its exceptional strength and stiffness, making it ideal for high-performance applications. Basalt Fiber Reinforced Polymer (BFRP) Rebar is emerging as a sustainable and cost-effective alternative, gaining traction in specific regions and applications.
Composite Rebar Market Product Landscape
The composite rebar market is characterized by continuous innovation in material science and manufacturing processes. Manufacturers are focusing on developing composite rebars with enhanced mechanical properties, improved fire resistance, and greater sustainability profiles. Key product innovations include the development of advanced resin systems and optimized fiber orientations to maximize tensile strength and durability. Performance metrics such as tensile strength exceeding 600 MPa for GFRP, and even higher for CFRP, coupled with excellent fatigue resistance and near-zero creep, are setting new benchmarks. The unique selling proposition of composite rebars lies in their complete immunity to corrosion, a significant advantage over traditional steel rebar, leading to extended service life and reduced life-cycle costs for infrastructure projects.
Key Drivers, Barriers & Challenges in Composite Rebar Market
Key Drivers:
- Superior Corrosion Resistance: The primary driver, preventing rust and structural degradation in aggressive environments.
- Lightweight Properties: Easier handling, transportation, and installation, leading to reduced labor costs.
- High Strength-to-Weight Ratio: Enables thinner concrete sections and innovative structural designs.
- Electromagnetic Transparency: Essential for sensitive infrastructure where electromagnetic interference is a concern.
- Sustainability: Longer lifespan and reduced maintenance contribute to a lower environmental footprint.
Barriers & Challenges:
- Higher Initial Cost: Compared to traditional steel rebar, composite rebar can have a higher upfront price, though life-cycle cost analysis often favors composites.
- Lack of Widespread Standardization: Evolving industry standards and building codes can create adoption hurdles.
- Limited Awareness and Education: A gap in knowledge among engineers, architects, and contractors regarding the benefits and proper application of composite rebar.
- Supply Chain Maturity: While growing, the global supply chain for composite rebar is still developing, potentially leading to lead time issues for large projects.
- Perception as a Niche Product: Overcoming the long-standing reliance on steel rebar requires a shift in industry mindset.
Emerging Opportunities in Composite Rebar Market
Emerging opportunities in the composite rebar market lie in the increasing demand for sustainable and resilient construction solutions in the face of climate change and aging infrastructure. Untapped markets in developing economies with ambitious infrastructure projects present significant growth potential. Innovative applications such as precast concrete elements, pedestrian bridges, and seismic-resistant structures are gaining traction. Evolving consumer preferences for green building materials and a focus on minimizing maintenance costs are further driving market expansion. The development of bio-based composite rebars and advancements in additive manufacturing for rebar production also represent exciting future avenues.
Growth Accelerators in the Composite Rebar Market Industry
Long-term growth in the composite rebar industry is being significantly accelerated by continuous technological breakthroughs in material science, leading to stronger, lighter, and more cost-effective products. Strategic partnerships between rebar manufacturers, raw material suppliers, and construction companies are fostering innovation and facilitating wider market penetration. Market expansion strategies, particularly in regions with high infrastructure investment and a growing awareness of the benefits of composite materials, are crucial growth catalysts. The increasing acceptance and integration of composite rebars into mainstream building codes and specifications are also powerful accelerators, normalizing their use and expanding their accessibility.
Key Players Shaping the Composite Rebar Market Market
- Dextra Group
- Nanjing Fenghui Composite Material Co Ltd
- Composite Group Chelyabinsk
- Kodiak Fiberglass Rebar LLC
- Galen
- Tribeni Fibres Pvt Ltd
- Marshall Composite Technologies LLC
- Captrad
- Pultron Composites
- Armastek
- Schock Bauteile GmbH
- Technobasalt-Invest LLC
Notable Milestones in Composite Rebar Market Sector
- June 2022: Pultron Composites and Owens Corning signed a joint venture to manufacture industry-leading fiberglass rebar, enhancing their global market access and facilitating expansion into the United States.
- July 2020: Pultron Composites formed a partnership with Geosynthetic Partners Ltd. to serve as the New Zealand and Pacific Islands distributor of Mateenbar, supporting the company's expansion in the APAC region.
In-Depth Composite Rebar Market Market Outlook
The future outlook for the composite rebar market is exceptionally promising, driven by the confluence of several growth accelerators. Continued technological advancements will lead to even more competitive pricing and enhanced performance characteristics, broadening their appeal across a wider range of construction projects. Strategic partnerships and collaborations will foster greater market penetration and innovation in application development. The increasing global focus on sustainable infrastructure and the urgent need to replace aging, corroded steel structures will create sustained demand. Market expansion into emerging economies, coupled with the ongoing development of supportive industry standards and regulations, will solidify composite rebar's position as a vital material in the future of construction. The market is well-positioned for significant and sustained growth over the forecast period.
Composite Rebar Market Segmentation
-
1. Product Type
- 1.1. Glass Fiber Reinforced Polymer Rebar (GFRP Rebar)
- 1.2. Carbon Fiber Reinforced Polymer Rebar (CFRP Rebar)
- 1.3. Basalt Fiber Reinforced Polymer Rebar (BFRP Rebar)
-
2. Application
- 2.1. Highways, Bridges & Buildings
- 2.2. Marine Structures & Waterfronts
- 2.3. Water Treatment Plants
- 2.4. Other Applications
Composite Rebar Market Segmentation By Geography
-
1. Asia Pacific
- 1.1. China
- 1.2. India
- 1.3. Japan
- 1.4. South Korea
- 1.5. Australia
- 1.6. Rest of Asia Pacific
-
2. North America
- 2.1. United States
- 2.2. Canada
- 2.3. Mexico
-
3. Europe
- 3.1. Germany
- 3.2. United Kingdom
- 3.3. Italy
- 3.4. France
- 3.5. Rest of Europe
-
4. South America
- 4.1. Brazil
- 4.2. Argentina
- 4.3. Rest of South America
-
5. Middle East and Africa
- 5.1. Saudi Arabia
- 5.2. South Africa
- 5.3. Rest of Middle East and Africa
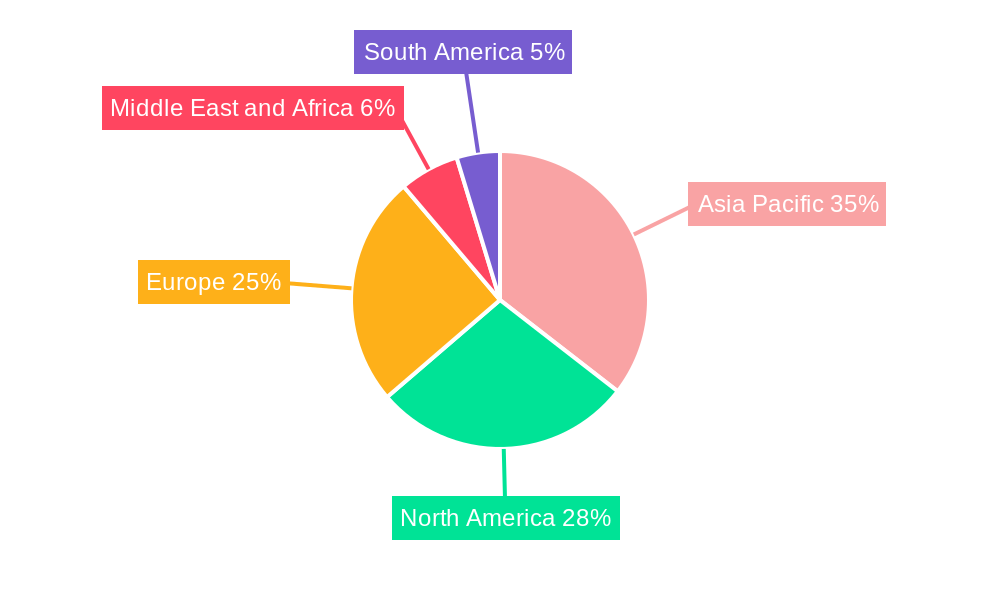
Composite Rebar Market Regional Market Share
Geographic Coverage of Composite Rebar Market
Composite Rebar Market REPORT HIGHLIGHTS
| Aspects | Details |
|---|---|
| Study Period | 2020-2034 |
| Base Year | 2025 |
| Estimated Year | 2026 |
| Forecast Period | 2026-2034 |
| Historical Period | 2020-2025 |
| Growth Rate | CAGR of 9.8% from 2020-2034 |
| Segmentation |
|
Table of Contents
- 1. Introduction
- 1.1. Research Scope
- 1.2. Market Segmentation
- 1.3. Research Objective
- 1.4. Definitions and Assumptions
- 2. Executive Summary
- 2.1. Market Snapshot
- 3. Market Dynamics
- 3.1. Market Drivers
- 3.2. Market Restrains
- 3.3. Market Trends
- 3.4. Market Opportunities
- 4. Market Factor Analysis
- 4.1. Porters Five Forces
- 4.1.1. Bargaining Power of Suppliers
- 4.1.2. Bargaining Power of Buyers
- 4.1.3. Threat of New Entrants
- 4.1.4. Threat of Substitutes
- 4.1.5. Competitive Rivalry
- 4.2. PESTEL analysis
- 4.3. BCG Analysis
- 4.3.1. Stars (High Growth, High Market Share)
- 4.3.2. Cash Cows (Low Growth, High Market Share)
- 4.3.3. Question Mark (High Growth, Low Market Share)
- 4.3.4. Dogs (Low Growth, Low Market Share)
- 4.4. Ansoff Matrix Analysis
- 4.5. Supply Chain Analysis
- 4.6. Regulatory Landscape
- 4.7. Current Market Potential and Opportunity Assessment (TAM–SAM–SOM Framework)
- 4.8. IMR Analyst Note
- 4.1. Porters Five Forces
- 5. Market Analysis, Insights and Forecast 2021-2033
- 5.1. Market Analysis, Insights and Forecast - by Product Type
- 5.1.1. Glass Fiber Reinforced Polymer Rebar (GFRP Rebar)
- 5.1.2. Carbon Fiber Reinforced Polymer Rebar (CFRP Rebar)
- 5.1.3. Basalt Fiber Reinforced Polymer Rebar (BFRP Rebar)
- 5.2. Market Analysis, Insights and Forecast - by Application
- 5.2.1. Highways, Bridges & Buildings
- 5.2.2. Marine Structures & Waterfronts
- 5.2.3. Water Treatment Plants
- 5.2.4. Other Applications
- 5.3. Market Analysis, Insights and Forecast - by Region
- 5.3.1. Asia Pacific
- 5.3.2. North America
- 5.3.3. Europe
- 5.3.4. South America
- 5.3.5. Middle East and Africa
- 5.1. Market Analysis, Insights and Forecast - by Product Type
- 6. Global Composite Rebar Market Analysis, Insights and Forecast, 2021-2033
- 6.1. Market Analysis, Insights and Forecast - by Product Type
- 6.1.1. Glass Fiber Reinforced Polymer Rebar (GFRP Rebar)
- 6.1.2. Carbon Fiber Reinforced Polymer Rebar (CFRP Rebar)
- 6.1.3. Basalt Fiber Reinforced Polymer Rebar (BFRP Rebar)
- 6.2. Market Analysis, Insights and Forecast - by Application
- 6.2.1. Highways, Bridges & Buildings
- 6.2.2. Marine Structures & Waterfronts
- 6.2.3. Water Treatment Plants
- 6.2.4. Other Applications
- 6.1. Market Analysis, Insights and Forecast - by Product Type
- 7. Asia Pacific Composite Rebar Market Analysis, Insights and Forecast, 2020-2032
- 7.1. Market Analysis, Insights and Forecast - by Product Type
- 7.1.1. Glass Fiber Reinforced Polymer Rebar (GFRP Rebar)
- 7.1.2. Carbon Fiber Reinforced Polymer Rebar (CFRP Rebar)
- 7.1.3. Basalt Fiber Reinforced Polymer Rebar (BFRP Rebar)
- 7.2. Market Analysis, Insights and Forecast - by Application
- 7.2.1. Highways, Bridges & Buildings
- 7.2.2. Marine Structures & Waterfronts
- 7.2.3. Water Treatment Plants
- 7.2.4. Other Applications
- 7.1. Market Analysis, Insights and Forecast - by Product Type
- 8. North America Composite Rebar Market Analysis, Insights and Forecast, 2020-2032
- 8.1. Market Analysis, Insights and Forecast - by Product Type
- 8.1.1. Glass Fiber Reinforced Polymer Rebar (GFRP Rebar)
- 8.1.2. Carbon Fiber Reinforced Polymer Rebar (CFRP Rebar)
- 8.1.3. Basalt Fiber Reinforced Polymer Rebar (BFRP Rebar)
- 8.2. Market Analysis, Insights and Forecast - by Application
- 8.2.1. Highways, Bridges & Buildings
- 8.2.2. Marine Structures & Waterfronts
- 8.2.3. Water Treatment Plants
- 8.2.4. Other Applications
- 8.1. Market Analysis, Insights and Forecast - by Product Type
- 9. Europe Composite Rebar Market Analysis, Insights and Forecast, 2020-2032
- 9.1. Market Analysis, Insights and Forecast - by Product Type
- 9.1.1. Glass Fiber Reinforced Polymer Rebar (GFRP Rebar)
- 9.1.2. Carbon Fiber Reinforced Polymer Rebar (CFRP Rebar)
- 9.1.3. Basalt Fiber Reinforced Polymer Rebar (BFRP Rebar)
- 9.2. Market Analysis, Insights and Forecast - by Application
- 9.2.1. Highways, Bridges & Buildings
- 9.2.2. Marine Structures & Waterfronts
- 9.2.3. Water Treatment Plants
- 9.2.4. Other Applications
- 9.1. Market Analysis, Insights and Forecast - by Product Type
- 10. South America Composite Rebar Market Analysis, Insights and Forecast, 2020-2032
- 10.1. Market Analysis, Insights and Forecast - by Product Type
- 10.1.1. Glass Fiber Reinforced Polymer Rebar (GFRP Rebar)
- 10.1.2. Carbon Fiber Reinforced Polymer Rebar (CFRP Rebar)
- 10.1.3. Basalt Fiber Reinforced Polymer Rebar (BFRP Rebar)
- 10.2. Market Analysis, Insights and Forecast - by Application
- 10.2.1. Highways, Bridges & Buildings
- 10.2.2. Marine Structures & Waterfronts
- 10.2.3. Water Treatment Plants
- 10.2.4. Other Applications
- 10.1. Market Analysis, Insights and Forecast - by Product Type
- 11. Middle East and Africa Composite Rebar Market Analysis, Insights and Forecast, 2020-2032
- 11.1. Market Analysis, Insights and Forecast - by Product Type
- 11.1.1. Glass Fiber Reinforced Polymer Rebar (GFRP Rebar)
- 11.1.2. Carbon Fiber Reinforced Polymer Rebar (CFRP Rebar)
- 11.1.3. Basalt Fiber Reinforced Polymer Rebar (BFRP Rebar)
- 11.2. Market Analysis, Insights and Forecast - by Application
- 11.2.1. Highways, Bridges & Buildings
- 11.2.2. Marine Structures & Waterfronts
- 11.2.3. Water Treatment Plants
- 11.2.4. Other Applications
- 11.1. Market Analysis, Insights and Forecast - by Product Type
- 12. Competitive Analysis
- 12.1. Company Profiles
- 12.1.1 Dextra Group
- 12.1.1.1. Company Overview
- 12.1.1.2. Products
- 12.1.1.3. Company Financials
- 12.1.1.4. SWOT Analysis
- 12.1.2 Nanjing Fenghui Composite Material Co Ltd
- 12.1.2.1. Company Overview
- 12.1.2.2. Products
- 12.1.2.3. Company Financials
- 12.1.2.4. SWOT Analysis
- 12.1.3 Composite Group Chelyabinsk
- 12.1.3.1. Company Overview
- 12.1.3.2. Products
- 12.1.3.3. Company Financials
- 12.1.3.4. SWOT Analysis
- 12.1.4 Kodiak Fiberglass Rebar LLC
- 12.1.4.1. Company Overview
- 12.1.4.2. Products
- 12.1.4.3. Company Financials
- 12.1.4.4. SWOT Analysis
- 12.1.5 Galen
- 12.1.5.1. Company Overview
- 12.1.5.2. Products
- 12.1.5.3. Company Financials
- 12.1.5.4. SWOT Analysis
- 12.1.6 Tribeni Fibres Pvt Ltd
- 12.1.6.1. Company Overview
- 12.1.6.2. Products
- 12.1.6.3. Company Financials
- 12.1.6.4. SWOT Analysis
- 12.1.7 Marshall Composite Technologies LLC
- 12.1.7.1. Company Overview
- 12.1.7.2. Products
- 12.1.7.3. Company Financials
- 12.1.7.4. SWOT Analysis
- 12.1.8 Captrad
- 12.1.8.1. Company Overview
- 12.1.8.2. Products
- 12.1.8.3. Company Financials
- 12.1.8.4. SWOT Analysis
- 12.1.9 Pultron Composites
- 12.1.9.1. Company Overview
- 12.1.9.2. Products
- 12.1.9.3. Company Financials
- 12.1.9.4. SWOT Analysis
- 12.1.10 Armastek
- 12.1.10.1. Company Overview
- 12.1.10.2. Products
- 12.1.10.3. Company Financials
- 12.1.10.4. SWOT Analysis
- 12.1.11 Schock Bauteile GmbH
- 12.1.11.1. Company Overview
- 12.1.11.2. Products
- 12.1.11.3. Company Financials
- 12.1.11.4. SWOT Analysis
- 12.1.12 Technobasalt-Invest LLC
- 12.1.12.1. Company Overview
- 12.1.12.2. Products
- 12.1.12.3. Company Financials
- 12.1.12.4. SWOT Analysis
- 12.1.1 Dextra Group
- 12.2. Market Entropy
- 12.2.1 Company's Key Areas Served
- 12.2.2 Recent Developments
- 12.3. Company Market Share Analysis 2025
- 12.3.1 Top 5 Companies Market Share Analysis
- 12.3.2 Top 3 Companies Market Share Analysis
- 12.4. List of Potential Customers
- 13. Research Methodology
List of Figures
- Figure 1: Global Composite Rebar Market Revenue Breakdown (million, %) by Region 2025 & 2033
- Figure 2: Global Composite Rebar Market Volume Breakdown (K Tons, %) by Region 2025 & 2033
- Figure 3: Asia Pacific Composite Rebar Market Revenue (million), by Product Type 2025 & 2033
- Figure 4: Asia Pacific Composite Rebar Market Volume (K Tons), by Product Type 2025 & 2033
- Figure 5: Asia Pacific Composite Rebar Market Revenue Share (%), by Product Type 2025 & 2033
- Figure 6: Asia Pacific Composite Rebar Market Volume Share (%), by Product Type 2025 & 2033
- Figure 7: Asia Pacific Composite Rebar Market Revenue (million), by Application 2025 & 2033
- Figure 8: Asia Pacific Composite Rebar Market Volume (K Tons), by Application 2025 & 2033
- Figure 9: Asia Pacific Composite Rebar Market Revenue Share (%), by Application 2025 & 2033
- Figure 10: Asia Pacific Composite Rebar Market Volume Share (%), by Application 2025 & 2033
- Figure 11: Asia Pacific Composite Rebar Market Revenue (million), by Country 2025 & 2033
- Figure 12: Asia Pacific Composite Rebar Market Volume (K Tons), by Country 2025 & 2033
- Figure 13: Asia Pacific Composite Rebar Market Revenue Share (%), by Country 2025 & 2033
- Figure 14: Asia Pacific Composite Rebar Market Volume Share (%), by Country 2025 & 2033
- Figure 15: North America Composite Rebar Market Revenue (million), by Product Type 2025 & 2033
- Figure 16: North America Composite Rebar Market Volume (K Tons), by Product Type 2025 & 2033
- Figure 17: North America Composite Rebar Market Revenue Share (%), by Product Type 2025 & 2033
- Figure 18: North America Composite Rebar Market Volume Share (%), by Product Type 2025 & 2033
- Figure 19: North America Composite Rebar Market Revenue (million), by Application 2025 & 2033
- Figure 20: North America Composite Rebar Market Volume (K Tons), by Application 2025 & 2033
- Figure 21: North America Composite Rebar Market Revenue Share (%), by Application 2025 & 2033
- Figure 22: North America Composite Rebar Market Volume Share (%), by Application 2025 & 2033
- Figure 23: North America Composite Rebar Market Revenue (million), by Country 2025 & 2033
- Figure 24: North America Composite Rebar Market Volume (K Tons), by Country 2025 & 2033
- Figure 25: North America Composite Rebar Market Revenue Share (%), by Country 2025 & 2033
- Figure 26: North America Composite Rebar Market Volume Share (%), by Country 2025 & 2033
- Figure 27: Europe Composite Rebar Market Revenue (million), by Product Type 2025 & 2033
- Figure 28: Europe Composite Rebar Market Volume (K Tons), by Product Type 2025 & 2033
- Figure 29: Europe Composite Rebar Market Revenue Share (%), by Product Type 2025 & 2033
- Figure 30: Europe Composite Rebar Market Volume Share (%), by Product Type 2025 & 2033
- Figure 31: Europe Composite Rebar Market Revenue (million), by Application 2025 & 2033
- Figure 32: Europe Composite Rebar Market Volume (K Tons), by Application 2025 & 2033
- Figure 33: Europe Composite Rebar Market Revenue Share (%), by Application 2025 & 2033
- Figure 34: Europe Composite Rebar Market Volume Share (%), by Application 2025 & 2033
- Figure 35: Europe Composite Rebar Market Revenue (million), by Country 2025 & 2033
- Figure 36: Europe Composite Rebar Market Volume (K Tons), by Country 2025 & 2033
- Figure 37: Europe Composite Rebar Market Revenue Share (%), by Country 2025 & 2033
- Figure 38: Europe Composite Rebar Market Volume Share (%), by Country 2025 & 2033
- Figure 39: South America Composite Rebar Market Revenue (million), by Product Type 2025 & 2033
- Figure 40: South America Composite Rebar Market Volume (K Tons), by Product Type 2025 & 2033
- Figure 41: South America Composite Rebar Market Revenue Share (%), by Product Type 2025 & 2033
- Figure 42: South America Composite Rebar Market Volume Share (%), by Product Type 2025 & 2033
- Figure 43: South America Composite Rebar Market Revenue (million), by Application 2025 & 2033
- Figure 44: South America Composite Rebar Market Volume (K Tons), by Application 2025 & 2033
- Figure 45: South America Composite Rebar Market Revenue Share (%), by Application 2025 & 2033
- Figure 46: South America Composite Rebar Market Volume Share (%), by Application 2025 & 2033
- Figure 47: South America Composite Rebar Market Revenue (million), by Country 2025 & 2033
- Figure 48: South America Composite Rebar Market Volume (K Tons), by Country 2025 & 2033
- Figure 49: South America Composite Rebar Market Revenue Share (%), by Country 2025 & 2033
- Figure 50: South America Composite Rebar Market Volume Share (%), by Country 2025 & 2033
- Figure 51: Middle East and Africa Composite Rebar Market Revenue (million), by Product Type 2025 & 2033
- Figure 52: Middle East and Africa Composite Rebar Market Volume (K Tons), by Product Type 2025 & 2033
- Figure 53: Middle East and Africa Composite Rebar Market Revenue Share (%), by Product Type 2025 & 2033
- Figure 54: Middle East and Africa Composite Rebar Market Volume Share (%), by Product Type 2025 & 2033
- Figure 55: Middle East and Africa Composite Rebar Market Revenue (million), by Application 2025 & 2033
- Figure 56: Middle East and Africa Composite Rebar Market Volume (K Tons), by Application 2025 & 2033
- Figure 57: Middle East and Africa Composite Rebar Market Revenue Share (%), by Application 2025 & 2033
- Figure 58: Middle East and Africa Composite Rebar Market Volume Share (%), by Application 2025 & 2033
- Figure 59: Middle East and Africa Composite Rebar Market Revenue (million), by Country 2025 & 2033
- Figure 60: Middle East and Africa Composite Rebar Market Volume (K Tons), by Country 2025 & 2033
- Figure 61: Middle East and Africa Composite Rebar Market Revenue Share (%), by Country 2025 & 2033
- Figure 62: Middle East and Africa Composite Rebar Market Volume Share (%), by Country 2025 & 2033
List of Tables
- Table 1: Global Composite Rebar Market Revenue million Forecast, by Product Type 2020 & 2033
- Table 2: Global Composite Rebar Market Volume K Tons Forecast, by Product Type 2020 & 2033
- Table 3: Global Composite Rebar Market Revenue million Forecast, by Application 2020 & 2033
- Table 4: Global Composite Rebar Market Volume K Tons Forecast, by Application 2020 & 2033
- Table 5: Global Composite Rebar Market Revenue million Forecast, by Region 2020 & 2033
- Table 6: Global Composite Rebar Market Volume K Tons Forecast, by Region 2020 & 2033
- Table 7: Global Composite Rebar Market Revenue million Forecast, by Product Type 2020 & 2033
- Table 8: Global Composite Rebar Market Volume K Tons Forecast, by Product Type 2020 & 2033
- Table 9: Global Composite Rebar Market Revenue million Forecast, by Application 2020 & 2033
- Table 10: Global Composite Rebar Market Volume K Tons Forecast, by Application 2020 & 2033
- Table 11: Global Composite Rebar Market Revenue million Forecast, by Country 2020 & 2033
- Table 12: Global Composite Rebar Market Volume K Tons Forecast, by Country 2020 & 2033
- Table 13: China Composite Rebar Market Revenue (million) Forecast, by Application 2020 & 2033
- Table 14: China Composite Rebar Market Volume (K Tons) Forecast, by Application 2020 & 2033
- Table 15: India Composite Rebar Market Revenue (million) Forecast, by Application 2020 & 2033
- Table 16: India Composite Rebar Market Volume (K Tons) Forecast, by Application 2020 & 2033
- Table 17: Japan Composite Rebar Market Revenue (million) Forecast, by Application 2020 & 2033
- Table 18: Japan Composite Rebar Market Volume (K Tons) Forecast, by Application 2020 & 2033
- Table 19: South Korea Composite Rebar Market Revenue (million) Forecast, by Application 2020 & 2033
- Table 20: South Korea Composite Rebar Market Volume (K Tons) Forecast, by Application 2020 & 2033
- Table 21: Australia Composite Rebar Market Revenue (million) Forecast, by Application 2020 & 2033
- Table 22: Australia Composite Rebar Market Volume (K Tons) Forecast, by Application 2020 & 2033
- Table 23: Rest of Asia Pacific Composite Rebar Market Revenue (million) Forecast, by Application 2020 & 2033
- Table 24: Rest of Asia Pacific Composite Rebar Market Volume (K Tons) Forecast, by Application 2020 & 2033
- Table 25: Global Composite Rebar Market Revenue million Forecast, by Product Type 2020 & 2033
- Table 26: Global Composite Rebar Market Volume K Tons Forecast, by Product Type 2020 & 2033
- Table 27: Global Composite Rebar Market Revenue million Forecast, by Application 2020 & 2033
- Table 28: Global Composite Rebar Market Volume K Tons Forecast, by Application 2020 & 2033
- Table 29: Global Composite Rebar Market Revenue million Forecast, by Country 2020 & 2033
- Table 30: Global Composite Rebar Market Volume K Tons Forecast, by Country 2020 & 2033
- Table 31: United States Composite Rebar Market Revenue (million) Forecast, by Application 2020 & 2033
- Table 32: United States Composite Rebar Market Volume (K Tons) Forecast, by Application 2020 & 2033
- Table 33: Canada Composite Rebar Market Revenue (million) Forecast, by Application 2020 & 2033
- Table 34: Canada Composite Rebar Market Volume (K Tons) Forecast, by Application 2020 & 2033
- Table 35: Mexico Composite Rebar Market Revenue (million) Forecast, by Application 2020 & 2033
- Table 36: Mexico Composite Rebar Market Volume (K Tons) Forecast, by Application 2020 & 2033
- Table 37: Global Composite Rebar Market Revenue million Forecast, by Product Type 2020 & 2033
- Table 38: Global Composite Rebar Market Volume K Tons Forecast, by Product Type 2020 & 2033
- Table 39: Global Composite Rebar Market Revenue million Forecast, by Application 2020 & 2033
- Table 40: Global Composite Rebar Market Volume K Tons Forecast, by Application 2020 & 2033
- Table 41: Global Composite Rebar Market Revenue million Forecast, by Country 2020 & 2033
- Table 42: Global Composite Rebar Market Volume K Tons Forecast, by Country 2020 & 2033
- Table 43: Germany Composite Rebar Market Revenue (million) Forecast, by Application 2020 & 2033
- Table 44: Germany Composite Rebar Market Volume (K Tons) Forecast, by Application 2020 & 2033
- Table 45: United Kingdom Composite Rebar Market Revenue (million) Forecast, by Application 2020 & 2033
- Table 46: United Kingdom Composite Rebar Market Volume (K Tons) Forecast, by Application 2020 & 2033
- Table 47: Italy Composite Rebar Market Revenue (million) Forecast, by Application 2020 & 2033
- Table 48: Italy Composite Rebar Market Volume (K Tons) Forecast, by Application 2020 & 2033
- Table 49: France Composite Rebar Market Revenue (million) Forecast, by Application 2020 & 2033
- Table 50: France Composite Rebar Market Volume (K Tons) Forecast, by Application 2020 & 2033
- Table 51: Rest of Europe Composite Rebar Market Revenue (million) Forecast, by Application 2020 & 2033
- Table 52: Rest of Europe Composite Rebar Market Volume (K Tons) Forecast, by Application 2020 & 2033
- Table 53: Global Composite Rebar Market Revenue million Forecast, by Product Type 2020 & 2033
- Table 54: Global Composite Rebar Market Volume K Tons Forecast, by Product Type 2020 & 2033
- Table 55: Global Composite Rebar Market Revenue million Forecast, by Application 2020 & 2033
- Table 56: Global Composite Rebar Market Volume K Tons Forecast, by Application 2020 & 2033
- Table 57: Global Composite Rebar Market Revenue million Forecast, by Country 2020 & 2033
- Table 58: Global Composite Rebar Market Volume K Tons Forecast, by Country 2020 & 2033
- Table 59: Brazil Composite Rebar Market Revenue (million) Forecast, by Application 2020 & 2033
- Table 60: Brazil Composite Rebar Market Volume (K Tons) Forecast, by Application 2020 & 2033
- Table 61: Argentina Composite Rebar Market Revenue (million) Forecast, by Application 2020 & 2033
- Table 62: Argentina Composite Rebar Market Volume (K Tons) Forecast, by Application 2020 & 2033
- Table 63: Rest of South America Composite Rebar Market Revenue (million) Forecast, by Application 2020 & 2033
- Table 64: Rest of South America Composite Rebar Market Volume (K Tons) Forecast, by Application 2020 & 2033
- Table 65: Global Composite Rebar Market Revenue million Forecast, by Product Type 2020 & 2033
- Table 66: Global Composite Rebar Market Volume K Tons Forecast, by Product Type 2020 & 2033
- Table 67: Global Composite Rebar Market Revenue million Forecast, by Application 2020 & 2033
- Table 68: Global Composite Rebar Market Volume K Tons Forecast, by Application 2020 & 2033
- Table 69: Global Composite Rebar Market Revenue million Forecast, by Country 2020 & 2033
- Table 70: Global Composite Rebar Market Volume K Tons Forecast, by Country 2020 & 2033
- Table 71: Saudi Arabia Composite Rebar Market Revenue (million) Forecast, by Application 2020 & 2033
- Table 72: Saudi Arabia Composite Rebar Market Volume (K Tons) Forecast, by Application 2020 & 2033
- Table 73: South Africa Composite Rebar Market Revenue (million) Forecast, by Application 2020 & 2033
- Table 74: South Africa Composite Rebar Market Volume (K Tons) Forecast, by Application 2020 & 2033
- Table 75: Rest of Middle East and Africa Composite Rebar Market Revenue (million) Forecast, by Application 2020 & 2033
- Table 76: Rest of Middle East and Africa Composite Rebar Market Volume (K Tons) Forecast, by Application 2020 & 2033
Frequently Asked Questions
1. What is the projected Compound Annual Growth Rate (CAGR) of the Composite Rebar Market?
The projected CAGR is approximately 9.8%.
2. Which companies are prominent players in the Composite Rebar Market?
Key companies in the market include Dextra Group, Nanjing Fenghui Composite Material Co Ltd, Composite Group Chelyabinsk, Kodiak Fiberglass Rebar LLC, Galen, Tribeni Fibres Pvt Ltd, Marshall Composite Technologies LLC, Captrad, Pultron Composites, Armastek, Schock Bauteile GmbH, Technobasalt-Invest LLC.
3. What are the main segments of the Composite Rebar Market?
The market segments include Product Type, Application.
4. Can you provide details about the market size?
The market size is estimated to be USD 744 million as of 2022.
5. What are some drivers contributing to market growth?
Increasing Usage in Highways. Bridges. and Buildings; Increasing Demand in Marine Structures.
6. What are the notable trends driving market growth?
Highways. Bridges & Buildings segment to Dominate the Market.
7. Are there any restraints impacting market growth?
Low Acceptance of FRP Rebars Among Construction Professionals; Other Restraints.
8. Can you provide examples of recent developments in the market?
In June 2022, Pultron Composites and Owens Corning signed a joint venture to manufacture industry-leading fiberglass rebar. This helps the company to obtain greater access to the global market, including expansion in the United States.
9. What pricing options are available for accessing the report?
Pricing options include single-user, multi-user, and enterprise licenses priced at USD 4750, USD 5250, and USD 8750 respectively.
10. Is the market size provided in terms of value or volume?
The market size is provided in terms of value, measured in million and volume, measured in K Tons.
11. Are there any specific market keywords associated with the report?
Yes, the market keyword associated with the report is "Composite Rebar Market," which aids in identifying and referencing the specific market segment covered.
12. How do I determine which pricing option suits my needs best?
The pricing options vary based on user requirements and access needs. Individual users may opt for single-user licenses, while businesses requiring broader access may choose multi-user or enterprise licenses for cost-effective access to the report.
13. Are there any additional resources or data provided in the Composite Rebar Market report?
While the report offers comprehensive insights, it's advisable to review the specific contents or supplementary materials provided to ascertain if additional resources or data are available.
14. How can I stay updated on further developments or reports in the Composite Rebar Market?
To stay informed about further developments, trends, and reports in the Composite Rebar Market, consider subscribing to industry newsletters, following relevant companies and organizations, or regularly checking reputable industry news sources and publications.
Methodology
Step 1 - Identification of Relevant Samples Size from Population Database


Step 2 - Approaches for Defining Global Market Size (Value, Volume* & Price*)

Note*: In applicable scenarios
Step 3 - Data Sources
Primary Research
- Web Analytics
- Survey Reports
- Research Institute
- Latest Research Reports
- Opinion Leaders
Secondary Research
- Annual Reports
- White Paper
- Latest Press Release
- Industry Association
- Paid Database
- Investor Presentations

Step 4 - Data Triangulation
Involves using different sources of information in order to increase the validity of a study
These sources are likely to be stakeholders in a program - participants, other researchers, program staff, other community members, and so on.
Then we put all data in single framework & apply various statistical tools to find out the dynamic on the market.
During the analysis stage, feedback from the stakeholder groups would be compared to determine areas of agreement as well as areas of divergence