

Key Insights
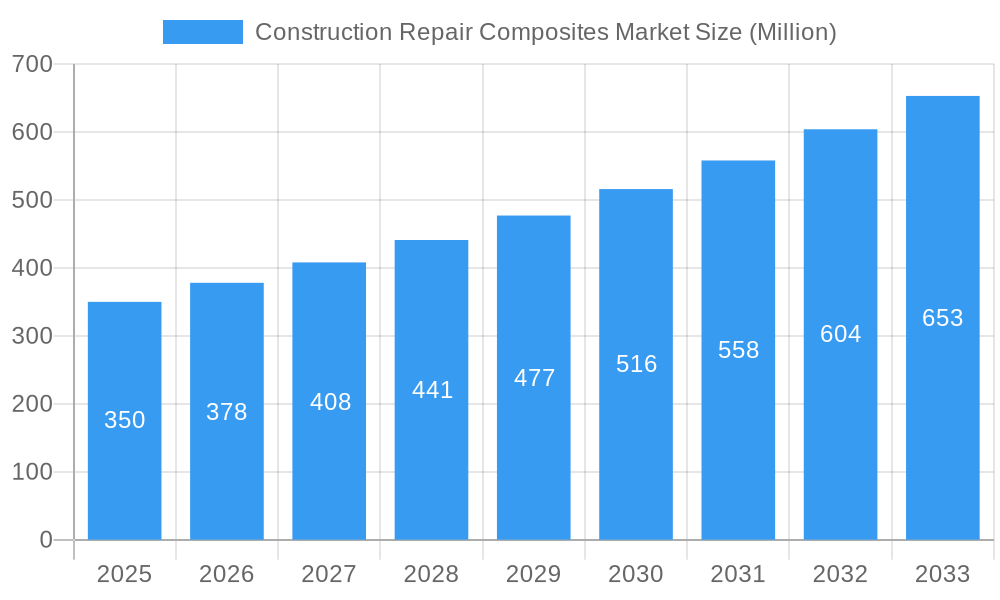
The Construction Repair Composites market, valued at $350 million in 2025, is experiencing robust growth, projected to expand at a Compound Annual Growth Rate (CAGR) exceeding 8% from 2025 to 2033. This expansion is driven by several key factors. Increasing infrastructure development globally necessitates frequent repairs and maintenance, creating a significant demand for durable and efficient repair materials. Composite materials offer superior strength-to-weight ratios, enhanced durability, and resistance to corrosion compared to traditional repair methods, making them increasingly attractive. Furthermore, advancements in composite manufacturing technologies, like automated fiber placement and improved resin systems, are leading to cost reductions and improved performance, fueling market growth. The adoption of sustainable and eco-friendly composite materials is also gaining momentum, aligning with the growing global focus on environmental sustainability within the construction industry. Specific application areas like bridge deck repair, strengthening of aging structures, and the rehabilitation of deteriorated concrete are major drivers within the segment.
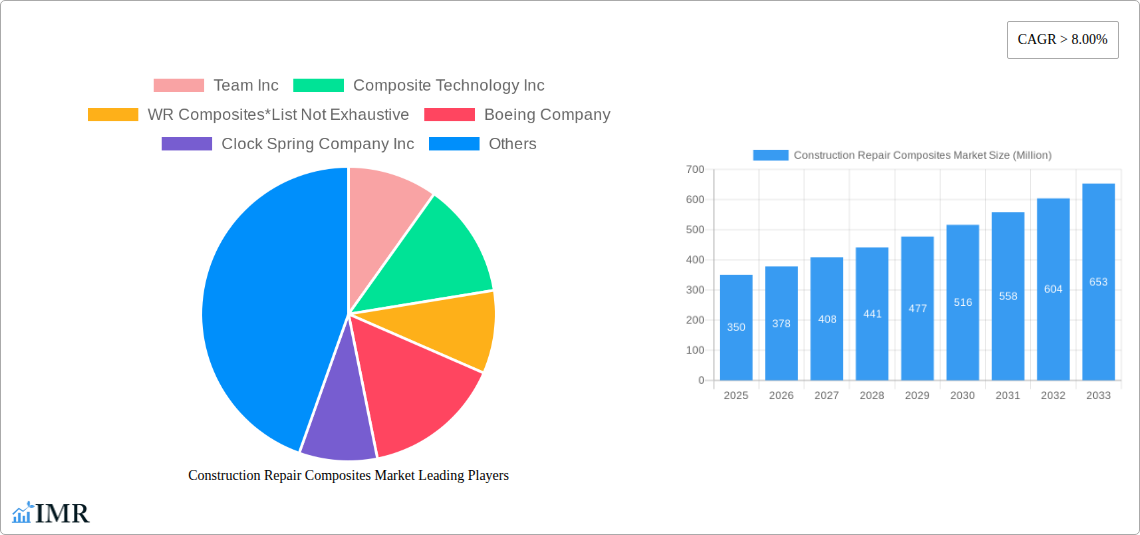
Construction Repair Composites Market Market Size (In Million)
Market segmentation reveals strong growth across various product types, with structural composites leading the way due to their high strength and load-bearing capabilities. Vacuum infusion and autoclave processes dominate the processing segment due to their ability to create high-quality, consistent composite components. The aerospace and defense industries, known for their stringent quality requirements and demand for lightweight, high-strength materials, are significant consumers. However, the automotive and marine sectors are also contributing significantly to market growth, driven by the need for lightweight vehicles and corrosion-resistant marine structures. Geographical analysis suggests that the Asia-Pacific region, particularly China and India, will likely dominate market share due to substantial infrastructure projects and government initiatives promoting the use of advanced construction materials. North America and Europe are also expected to witness considerable growth, fueled by existing infrastructure rehabilitation needs and ongoing investments in construction projects. Competitive analysis reveals a landscape comprising both large established players and specialized composite material manufacturers, fostering innovation and ensuring a steady supply of high-quality products.
Construction Repair Composites Market Company Market Share
Construction Repair Composites Market: A Comprehensive Report (2019-2033)
This comprehensive report provides a detailed analysis of the Construction Repair Composites Market, encompassing market dynamics, growth trends, regional segmentation, product landscape, and key players. The report covers the period from 2019 to 2033, with a focus on the forecast period of 2025-2033 and a base year of 2025. The parent market is the broader Composites Market, while the child market is specifically focused on construction repair applications. The total market size in 2025 is estimated at xx Million.
Construction Repair Composites Market Market Dynamics & Structure
The Construction Repair Composites Market is characterized by moderate concentration, with a few major players holding significant market share. Technological innovation, particularly in advanced materials and manufacturing processes, is a key driver. Stringent regulatory frameworks concerning safety and environmental impact influence market growth. Competitive pressures from traditional repair materials and the emergence of innovative substitutes are also noteworthy. The market exhibits significant regional variations influenced by construction activity, infrastructure development, and economic conditions. M&A activity has been relatively moderate in recent years, with approximately xx deals recorded between 2019 and 2024, resulting in a market share shift of approximately xx%.
- Market Concentration: Moderately concentrated, with top 5 players holding xx% market share in 2024.
- Technological Innovation: Focus on lightweight, high-strength materials and efficient processing techniques. Barriers include high R&D costs and the need for specialized skills.
- Regulatory Framework: Stringent building codes and environmental regulations influence material selection and disposal.
- Competitive Substitutes: Traditional repair materials (e.g., concrete, steel) pose competition.
- End-User Demographics: Predominantly construction companies, infrastructure developers, and government agencies.
- M&A Trends: Consolidation expected to increase in the forecast period.
Construction Repair Composites Market Growth Trends & Insights
The Construction Repair Composites Market has witnessed steady growth in the historical period (2019-2024), expanding at a CAGR of xx%. This growth is driven by increasing demand for durable, lightweight, and cost-effective repair solutions in various construction applications. The adoption rate of composite materials in construction repair is gradually increasing, particularly in developed economies. Technological disruptions, such as the development of self-healing composites and 3D-printed repair solutions, are expected to further accelerate market growth. Consumer behavior is shifting towards environmentally friendly and sustainable repair options, favoring the adoption of composite materials. The market size is projected to reach xx Million by 2033, exhibiting a CAGR of xx% during the forecast period. Market penetration is currently at xx% and is expected to rise to xx% by 2033.
Dominant Regions, Countries, or Segments in Construction Repair Composites Market
North America, particularly the United States, currently dominates the Construction Repair Composites Market, accounting for approximately xx% of the global market share in 2024. This dominance is primarily attributed to robust infrastructure development, high construction activity, and early adoption of composite repair technologies. Europe is another significant market, with strong growth potential driven by government initiatives promoting sustainable construction practices. Within the product type segment, structural composites hold the largest market share due to their high strength and durability. Vacuum infusion is the dominant processing method due to its cost-effectiveness and scalability. The construction end-user industry holds the largest share followed by the infrastructure industry.
- Key Drivers in North America: High construction spending, advanced infrastructure development, early adoption of composite technology.
- Key Drivers in Europe: Government incentives for sustainable construction, strong focus on infrastructure renewal.
- Dominant Product Type: Structural composites (xx% market share in 2024)
- Dominant Process: Vacuum Infusion (xx% market share in 2024)
- Dominant End-user: Construction (xx% market share in 2024)
Construction Repair Composites Market Product Landscape
Construction repair composites encompass a range of materials and formulations, tailored to specific application needs. These materials offer superior strength-to-weight ratios, improved durability, and enhanced corrosion resistance compared to traditional repair materials. Recent innovations include self-healing composites, which can repair minor damage autonomously, extending the lifespan of repaired structures. Advanced manufacturing processes like 3D printing are enabling the creation of customized repair components with intricate geometries. The unique selling proposition of these composites lies in their ability to provide long-term performance and reduced maintenance costs.
Key Drivers, Barriers & Challenges in Construction Repair Composites Market
Key Drivers: Increasing infrastructure investment globally, the demand for sustainable and environmentally friendly materials, and technological advancements in composite materials and manufacturing processes are key drivers for this market. Government regulations promoting sustainable construction also contribute to the market's growth.
Key Challenges: High initial cost compared to traditional materials, lack of skilled labor for composite material handling and installation, and supply chain disruptions can hinder market expansion.
Emerging Opportunities in Construction Repair Composites Market
Emerging opportunities exist in developing economies with substantial infrastructure development plans. The use of composites in repairing aging infrastructure and historical buildings presents a significant market opportunity. The development of innovative applications, such as prefabricated composite repair components, and the integration of smart sensors for structural health monitoring are also areas of growth. Further research and development of bio-based composites will offer additional market opportunities.
Growth Accelerators in the Construction Repair Composites Market Industry
Technological breakthroughs in composite materials science, coupled with advancements in manufacturing processes, are driving long-term growth. Strategic partnerships between material suppliers, manufacturers, and construction companies are fostering innovation and market penetration. Expanding into new markets and exploring new applications for composite repair materials, such as in the maintenance of renewable energy infrastructure, are key growth strategies.
Key Players Shaping the Construction Repair Composites Market Market
- Team Inc
- Composite Technology Inc
- WR Composites
- Boeing Company
- Clock Spring Company Inc
- The IKM Group
- TD Williamson Inc
- Air France KLM Group
- Milliken Infrastructure Solutions LLC
- Lufthansa Technik AG
- Hong Kong Aircraft Engineering Company Limited (HAECO)
- Crawford Composites LLC
Notable Milestones in Construction Repair Composites Market Sector
- 2022 Q3: Team Inc launched a new line of self-healing composite repair materials.
- 2023 Q1: A major merger occurred between two key players in the European market, leading to increased market share.
- 2024 Q2: Introduction of a new 3D printing technique for customized composite repair components by Composite Technology Inc.
In-Depth Construction Repair Composites Market Market Outlook
The Construction Repair Composites Market is poised for continued expansion, driven by strong growth in the construction and infrastructure sectors globally. The increasing demand for sustainable and high-performance repair solutions will further propel market growth. Strategic investments in R&D, expansion into new markets, and strategic partnerships will be crucial for companies to capitalize on the market's future potential. The market is expected to continue its steady growth trajectory, presenting significant opportunities for industry players.
Construction Repair Composites Market Segmentation
-
1. Product Type
- 1.1. Structural
- 1.2. Semi-structural
- 1.3. Cosmetic
-
2. Process
- 2.1. Hand Lay-up
- 2.2. Vacuum Infusion
- 2.3. Autoclave
- 2.4. Other Processes
-
3. End-user Industry
- 3.1. Aerospace and Defense
- 3.2. Wind Energy
- 3.3. Automotive
- 3.4. Marine
- 3.5. Construction
- 3.6. Other End-user Industries
Construction Repair Composites Market Segmentation By Geography
-
1. Asia Pacific
- 1.1. China
- 1.2. India
- 1.3. Japan
- 1.4. South Korea
- 1.5. Rest of Asia Pacific
-
2. North America
- 2.1. United States
- 2.2. Canada
- 2.3. Mexico
-
3. Europe
- 3.1. Germany
- 3.2. United Kingdom
- 3.3. France
- 3.4. Italy
- 3.5. Rest of Europe
-
4. South America
- 4.1. Brazil
- 4.2. Argentina
- 4.3. Rest of South America
-
5. Middle East and Africa
- 5.1. Saudi Arabia
- 5.2. South Africa
- 5.3. Rest of Middle East and Africa
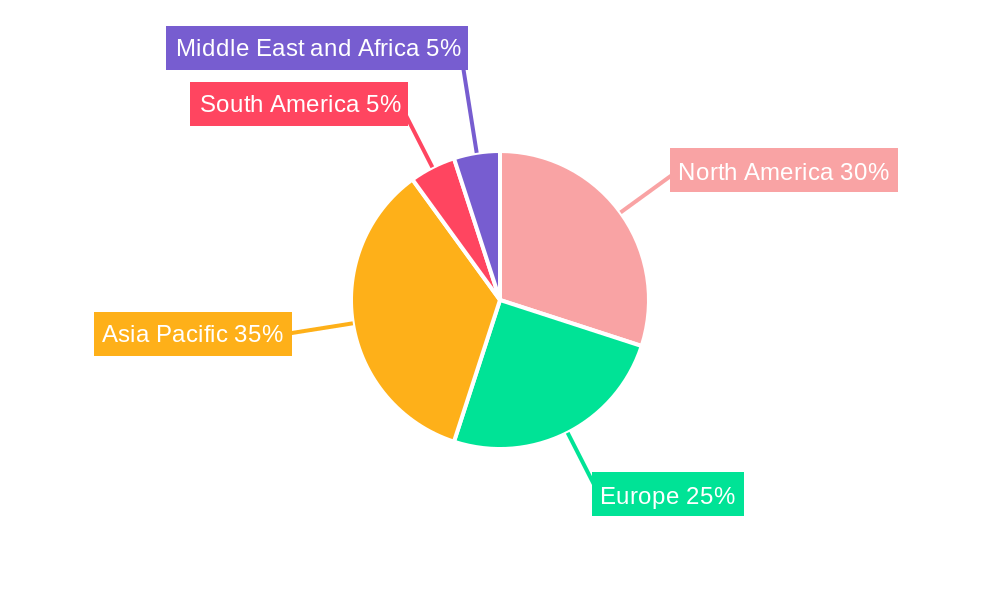
Construction Repair Composites Market Regional Market Share
Geographic Coverage of Construction Repair Composites Market
Construction Repair Composites Market REPORT HIGHLIGHTS
| Aspects | Details |
|---|---|
| Study Period | 2020-2034 |
| Base Year | 2025 |
| Estimated Year | 2026 |
| Forecast Period | 2026-2034 |
| Historical Period | 2020-2025 |
| Growth Rate | CAGR of > 8.00% from 2020-2034 |
| Segmentation |
|
Table of Contents
- 1. Introduction
- 1.1. Research Scope
- 1.2. Market Segmentation
- 1.3. Research Objective
- 1.4. Definitions and Assumptions
- 2. Executive Summary
- 2.1. Market Snapshot
- 3. Market Dynamics
- 3.1. Market Drivers
- 3.2. Market Restrains
- 3.3. Market Trends
- 3.4. Market Opportunities
- 4. Market Factor Analysis
- 4.1. Porters Five Forces
- 4.1.1. Bargaining Power of Suppliers
- 4.1.2. Bargaining Power of Buyers
- 4.1.3. Threat of New Entrants
- 4.1.4. Threat of Substitutes
- 4.1.5. Competitive Rivalry
- 4.2. PESTEL analysis
- 4.3. BCG Analysis
- 4.3.1. Stars (High Growth, High Market Share)
- 4.3.2. Cash Cows (Low Growth, High Market Share)
- 4.3.3. Question Mark (High Growth, Low Market Share)
- 4.3.4. Dogs (Low Growth, Low Market Share)
- 4.4. Ansoff Matrix Analysis
- 4.5. Supply Chain Analysis
- 4.6. Regulatory Landscape
- 4.7. Current Market Potential and Opportunity Assessment (TAM–SAM–SOM Framework)
- 4.8. IMR Analyst Note
- 4.1. Porters Five Forces
- 5. Market Analysis, Insights and Forecast 2021-2033
- 5.1. Market Analysis, Insights and Forecast - by Product Type
- 5.1.1. Structural
- 5.1.2. Semi-structural
- 5.1.3. Cosmetic
- 5.2. Market Analysis, Insights and Forecast - by Process
- 5.2.1. Hand Lay-up
- 5.2.2. Vacuum Infusion
- 5.2.3. Autoclave
- 5.2.4. Other Processes
- 5.3. Market Analysis, Insights and Forecast - by End-user Industry
- 5.3.1. Aerospace and Defense
- 5.3.2. Wind Energy
- 5.3.3. Automotive
- 5.3.4. Marine
- 5.3.5. Construction
- 5.3.6. Other End-user Industries
- 5.4. Market Analysis, Insights and Forecast - by Region
- 5.4.1. Asia Pacific
- 5.4.2. North America
- 5.4.3. Europe
- 5.4.4. South America
- 5.4.5. Middle East and Africa
- 5.1. Market Analysis, Insights and Forecast - by Product Type
- 6. Global Construction Repair Composites Market Analysis, Insights and Forecast, 2021-2033
- 6.1. Market Analysis, Insights and Forecast - by Product Type
- 6.1.1. Structural
- 6.1.2. Semi-structural
- 6.1.3. Cosmetic
- 6.2. Market Analysis, Insights and Forecast - by Process
- 6.2.1. Hand Lay-up
- 6.2.2. Vacuum Infusion
- 6.2.3. Autoclave
- 6.2.4. Other Processes
- 6.3. Market Analysis, Insights and Forecast - by End-user Industry
- 6.3.1. Aerospace and Defense
- 6.3.2. Wind Energy
- 6.3.3. Automotive
- 6.3.4. Marine
- 6.3.5. Construction
- 6.3.6. Other End-user Industries
- 6.1. Market Analysis, Insights and Forecast - by Product Type
- 7. Asia Pacific Construction Repair Composites Market Analysis, Insights and Forecast, 2020-2032
- 7.1. Market Analysis, Insights and Forecast - by Product Type
- 7.1.1. Structural
- 7.1.2. Semi-structural
- 7.1.3. Cosmetic
- 7.2. Market Analysis, Insights and Forecast - by Process
- 7.2.1. Hand Lay-up
- 7.2.2. Vacuum Infusion
- 7.2.3. Autoclave
- 7.2.4. Other Processes
- 7.3. Market Analysis, Insights and Forecast - by End-user Industry
- 7.3.1. Aerospace and Defense
- 7.3.2. Wind Energy
- 7.3.3. Automotive
- 7.3.4. Marine
- 7.3.5. Construction
- 7.3.6. Other End-user Industries
- 7.1. Market Analysis, Insights and Forecast - by Product Type
- 8. North America Construction Repair Composites Market Analysis, Insights and Forecast, 2020-2032
- 8.1. Market Analysis, Insights and Forecast - by Product Type
- 8.1.1. Structural
- 8.1.2. Semi-structural
- 8.1.3. Cosmetic
- 8.2. Market Analysis, Insights and Forecast - by Process
- 8.2.1. Hand Lay-up
- 8.2.2. Vacuum Infusion
- 8.2.3. Autoclave
- 8.2.4. Other Processes
- 8.3. Market Analysis, Insights and Forecast - by End-user Industry
- 8.3.1. Aerospace and Defense
- 8.3.2. Wind Energy
- 8.3.3. Automotive
- 8.3.4. Marine
- 8.3.5. Construction
- 8.3.6. Other End-user Industries
- 8.1. Market Analysis, Insights and Forecast - by Product Type
- 9. Europe Construction Repair Composites Market Analysis, Insights and Forecast, 2020-2032
- 9.1. Market Analysis, Insights and Forecast - by Product Type
- 9.1.1. Structural
- 9.1.2. Semi-structural
- 9.1.3. Cosmetic
- 9.2. Market Analysis, Insights and Forecast - by Process
- 9.2.1. Hand Lay-up
- 9.2.2. Vacuum Infusion
- 9.2.3. Autoclave
- 9.2.4. Other Processes
- 9.3. Market Analysis, Insights and Forecast - by End-user Industry
- 9.3.1. Aerospace and Defense
- 9.3.2. Wind Energy
- 9.3.3. Automotive
- 9.3.4. Marine
- 9.3.5. Construction
- 9.3.6. Other End-user Industries
- 9.1. Market Analysis, Insights and Forecast - by Product Type
- 10. South America Construction Repair Composites Market Analysis, Insights and Forecast, 2020-2032
- 10.1. Market Analysis, Insights and Forecast - by Product Type
- 10.1.1. Structural
- 10.1.2. Semi-structural
- 10.1.3. Cosmetic
- 10.2. Market Analysis, Insights and Forecast - by Process
- 10.2.1. Hand Lay-up
- 10.2.2. Vacuum Infusion
- 10.2.3. Autoclave
- 10.2.4. Other Processes
- 10.3. Market Analysis, Insights and Forecast - by End-user Industry
- 10.3.1. Aerospace and Defense
- 10.3.2. Wind Energy
- 10.3.3. Automotive
- 10.3.4. Marine
- 10.3.5. Construction
- 10.3.6. Other End-user Industries
- 10.1. Market Analysis, Insights and Forecast - by Product Type
- 11. Middle East and Africa Construction Repair Composites Market Analysis, Insights and Forecast, 2020-2032
- 11.1. Market Analysis, Insights and Forecast - by Product Type
- 11.1.1. Structural
- 11.1.2. Semi-structural
- 11.1.3. Cosmetic
- 11.2. Market Analysis, Insights and Forecast - by Process
- 11.2.1. Hand Lay-up
- 11.2.2. Vacuum Infusion
- 11.2.3. Autoclave
- 11.2.4. Other Processes
- 11.3. Market Analysis, Insights and Forecast - by End-user Industry
- 11.3.1. Aerospace and Defense
- 11.3.2. Wind Energy
- 11.3.3. Automotive
- 11.3.4. Marine
- 11.3.5. Construction
- 11.3.6. Other End-user Industries
- 11.1. Market Analysis, Insights and Forecast - by Product Type
- 12. Competitive Analysis
- 12.1. Company Profiles
- 12.1.1 Team Inc
- 12.1.1.1. Company Overview
- 12.1.1.2. Products
- 12.1.1.3. Company Financials
- 12.1.1.4. SWOT Analysis
- 12.1.2 Composite Technology Inc
- 12.1.2.1. Company Overview
- 12.1.2.2. Products
- 12.1.2.3. Company Financials
- 12.1.2.4. SWOT Analysis
- 12.1.3 WR Composites*List Not Exhaustive
- 12.1.3.1. Company Overview
- 12.1.3.2. Products
- 12.1.3.3. Company Financials
- 12.1.3.4. SWOT Analysis
- 12.1.4 Boeing Company
- 12.1.4.1. Company Overview
- 12.1.4.2. Products
- 12.1.4.3. Company Financials
- 12.1.4.4. SWOT Analysis
- 12.1.5 Clock Spring Company Inc
- 12.1.5.1. Company Overview
- 12.1.5.2. Products
- 12.1.5.3. Company Financials
- 12.1.5.4. SWOT Analysis
- 12.1.6 The IKM Group
- 12.1.6.1. Company Overview
- 12.1.6.2. Products
- 12.1.6.3. Company Financials
- 12.1.6.4. SWOT Analysis
- 12.1.7 TD Williamson Inc
- 12.1.7.1. Company Overview
- 12.1.7.2. Products
- 12.1.7.3. Company Financials
- 12.1.7.4. SWOT Analysis
- 12.1.8 Air France KLM Group
- 12.1.8.1. Company Overview
- 12.1.8.2. Products
- 12.1.8.3. Company Financials
- 12.1.8.4. SWOT Analysis
- 12.1.9 Milliken Infrastructure Solutions LLC
- 12.1.9.1. Company Overview
- 12.1.9.2. Products
- 12.1.9.3. Company Financials
- 12.1.9.4. SWOT Analysis
- 12.1.10 Lufthansa Technik AG
- 12.1.10.1. Company Overview
- 12.1.10.2. Products
- 12.1.10.3. Company Financials
- 12.1.10.4. SWOT Analysis
- 12.1.11 Hong Kong Aircraft Engineering Company Limited (HAECO)
- 12.1.11.1. Company Overview
- 12.1.11.2. Products
- 12.1.11.3. Company Financials
- 12.1.11.4. SWOT Analysis
- 12.1.12 Crawford Composites LLC
- 12.1.12.1. Company Overview
- 12.1.12.2. Products
- 12.1.12.3. Company Financials
- 12.1.12.4. SWOT Analysis
- 12.1.1 Team Inc
- 12.2. Market Entropy
- 12.2.1 Company's Key Areas Served
- 12.2.2 Recent Developments
- 12.3. Company Market Share Analysis 2025
- 12.3.1 Top 5 Companies Market Share Analysis
- 12.3.2 Top 3 Companies Market Share Analysis
- 12.4. List of Potential Customers
- 13. Research Methodology
List of Figures
- Figure 1: Global Construction Repair Composites Market Revenue Breakdown (Million, %) by Region 2025 & 2033
- Figure 2: Global Construction Repair Composites Market Volume Breakdown (K Tons, %) by Region 2025 & 2033
- Figure 3: Asia Pacific Construction Repair Composites Market Revenue (Million), by Product Type 2025 & 2033
- Figure 4: Asia Pacific Construction Repair Composites Market Volume (K Tons), by Product Type 2025 & 2033
- Figure 5: Asia Pacific Construction Repair Composites Market Revenue Share (%), by Product Type 2025 & 2033
- Figure 6: Asia Pacific Construction Repair Composites Market Volume Share (%), by Product Type 2025 & 2033
- Figure 7: Asia Pacific Construction Repair Composites Market Revenue (Million), by Process 2025 & 2033
- Figure 8: Asia Pacific Construction Repair Composites Market Volume (K Tons), by Process 2025 & 2033
- Figure 9: Asia Pacific Construction Repair Composites Market Revenue Share (%), by Process 2025 & 2033
- Figure 10: Asia Pacific Construction Repair Composites Market Volume Share (%), by Process 2025 & 2033
- Figure 11: Asia Pacific Construction Repair Composites Market Revenue (Million), by End-user Industry 2025 & 2033
- Figure 12: Asia Pacific Construction Repair Composites Market Volume (K Tons), by End-user Industry 2025 & 2033
- Figure 13: Asia Pacific Construction Repair Composites Market Revenue Share (%), by End-user Industry 2025 & 2033
- Figure 14: Asia Pacific Construction Repair Composites Market Volume Share (%), by End-user Industry 2025 & 2033
- Figure 15: Asia Pacific Construction Repair Composites Market Revenue (Million), by Country 2025 & 2033
- Figure 16: Asia Pacific Construction Repair Composites Market Volume (K Tons), by Country 2025 & 2033
- Figure 17: Asia Pacific Construction Repair Composites Market Revenue Share (%), by Country 2025 & 2033
- Figure 18: Asia Pacific Construction Repair Composites Market Volume Share (%), by Country 2025 & 2033
- Figure 19: North America Construction Repair Composites Market Revenue (Million), by Product Type 2025 & 2033
- Figure 20: North America Construction Repair Composites Market Volume (K Tons), by Product Type 2025 & 2033
- Figure 21: North America Construction Repair Composites Market Revenue Share (%), by Product Type 2025 & 2033
- Figure 22: North America Construction Repair Composites Market Volume Share (%), by Product Type 2025 & 2033
- Figure 23: North America Construction Repair Composites Market Revenue (Million), by Process 2025 & 2033
- Figure 24: North America Construction Repair Composites Market Volume (K Tons), by Process 2025 & 2033
- Figure 25: North America Construction Repair Composites Market Revenue Share (%), by Process 2025 & 2033
- Figure 26: North America Construction Repair Composites Market Volume Share (%), by Process 2025 & 2033
- Figure 27: North America Construction Repair Composites Market Revenue (Million), by End-user Industry 2025 & 2033
- Figure 28: North America Construction Repair Composites Market Volume (K Tons), by End-user Industry 2025 & 2033
- Figure 29: North America Construction Repair Composites Market Revenue Share (%), by End-user Industry 2025 & 2033
- Figure 30: North America Construction Repair Composites Market Volume Share (%), by End-user Industry 2025 & 2033
- Figure 31: North America Construction Repair Composites Market Revenue (Million), by Country 2025 & 2033
- Figure 32: North America Construction Repair Composites Market Volume (K Tons), by Country 2025 & 2033
- Figure 33: North America Construction Repair Composites Market Revenue Share (%), by Country 2025 & 2033
- Figure 34: North America Construction Repair Composites Market Volume Share (%), by Country 2025 & 2033
- Figure 35: Europe Construction Repair Composites Market Revenue (Million), by Product Type 2025 & 2033
- Figure 36: Europe Construction Repair Composites Market Volume (K Tons), by Product Type 2025 & 2033
- Figure 37: Europe Construction Repair Composites Market Revenue Share (%), by Product Type 2025 & 2033
- Figure 38: Europe Construction Repair Composites Market Volume Share (%), by Product Type 2025 & 2033
- Figure 39: Europe Construction Repair Composites Market Revenue (Million), by Process 2025 & 2033
- Figure 40: Europe Construction Repair Composites Market Volume (K Tons), by Process 2025 & 2033
- Figure 41: Europe Construction Repair Composites Market Revenue Share (%), by Process 2025 & 2033
- Figure 42: Europe Construction Repair Composites Market Volume Share (%), by Process 2025 & 2033
- Figure 43: Europe Construction Repair Composites Market Revenue (Million), by End-user Industry 2025 & 2033
- Figure 44: Europe Construction Repair Composites Market Volume (K Tons), by End-user Industry 2025 & 2033
- Figure 45: Europe Construction Repair Composites Market Revenue Share (%), by End-user Industry 2025 & 2033
- Figure 46: Europe Construction Repair Composites Market Volume Share (%), by End-user Industry 2025 & 2033
- Figure 47: Europe Construction Repair Composites Market Revenue (Million), by Country 2025 & 2033
- Figure 48: Europe Construction Repair Composites Market Volume (K Tons), by Country 2025 & 2033
- Figure 49: Europe Construction Repair Composites Market Revenue Share (%), by Country 2025 & 2033
- Figure 50: Europe Construction Repair Composites Market Volume Share (%), by Country 2025 & 2033
- Figure 51: South America Construction Repair Composites Market Revenue (Million), by Product Type 2025 & 2033
- Figure 52: South America Construction Repair Composites Market Volume (K Tons), by Product Type 2025 & 2033
- Figure 53: South America Construction Repair Composites Market Revenue Share (%), by Product Type 2025 & 2033
- Figure 54: South America Construction Repair Composites Market Volume Share (%), by Product Type 2025 & 2033
- Figure 55: South America Construction Repair Composites Market Revenue (Million), by Process 2025 & 2033
- Figure 56: South America Construction Repair Composites Market Volume (K Tons), by Process 2025 & 2033
- Figure 57: South America Construction Repair Composites Market Revenue Share (%), by Process 2025 & 2033
- Figure 58: South America Construction Repair Composites Market Volume Share (%), by Process 2025 & 2033
- Figure 59: South America Construction Repair Composites Market Revenue (Million), by End-user Industry 2025 & 2033
- Figure 60: South America Construction Repair Composites Market Volume (K Tons), by End-user Industry 2025 & 2033
- Figure 61: South America Construction Repair Composites Market Revenue Share (%), by End-user Industry 2025 & 2033
- Figure 62: South America Construction Repair Composites Market Volume Share (%), by End-user Industry 2025 & 2033
- Figure 63: South America Construction Repair Composites Market Revenue (Million), by Country 2025 & 2033
- Figure 64: South America Construction Repair Composites Market Volume (K Tons), by Country 2025 & 2033
- Figure 65: South America Construction Repair Composites Market Revenue Share (%), by Country 2025 & 2033
- Figure 66: South America Construction Repair Composites Market Volume Share (%), by Country 2025 & 2033
- Figure 67: Middle East and Africa Construction Repair Composites Market Revenue (Million), by Product Type 2025 & 2033
- Figure 68: Middle East and Africa Construction Repair Composites Market Volume (K Tons), by Product Type 2025 & 2033
- Figure 69: Middle East and Africa Construction Repair Composites Market Revenue Share (%), by Product Type 2025 & 2033
- Figure 70: Middle East and Africa Construction Repair Composites Market Volume Share (%), by Product Type 2025 & 2033
- Figure 71: Middle East and Africa Construction Repair Composites Market Revenue (Million), by Process 2025 & 2033
- Figure 72: Middle East and Africa Construction Repair Composites Market Volume (K Tons), by Process 2025 & 2033
- Figure 73: Middle East and Africa Construction Repair Composites Market Revenue Share (%), by Process 2025 & 2033
- Figure 74: Middle East and Africa Construction Repair Composites Market Volume Share (%), by Process 2025 & 2033
- Figure 75: Middle East and Africa Construction Repair Composites Market Revenue (Million), by End-user Industry 2025 & 2033
- Figure 76: Middle East and Africa Construction Repair Composites Market Volume (K Tons), by End-user Industry 2025 & 2033
- Figure 77: Middle East and Africa Construction Repair Composites Market Revenue Share (%), by End-user Industry 2025 & 2033
- Figure 78: Middle East and Africa Construction Repair Composites Market Volume Share (%), by End-user Industry 2025 & 2033
- Figure 79: Middle East and Africa Construction Repair Composites Market Revenue (Million), by Country 2025 & 2033
- Figure 80: Middle East and Africa Construction Repair Composites Market Volume (K Tons), by Country 2025 & 2033
- Figure 81: Middle East and Africa Construction Repair Composites Market Revenue Share (%), by Country 2025 & 2033
- Figure 82: Middle East and Africa Construction Repair Composites Market Volume Share (%), by Country 2025 & 2033
List of Tables
- Table 1: Global Construction Repair Composites Market Revenue Million Forecast, by Product Type 2020 & 2033
- Table 2: Global Construction Repair Composites Market Volume K Tons Forecast, by Product Type 2020 & 2033
- Table 3: Global Construction Repair Composites Market Revenue Million Forecast, by Process 2020 & 2033
- Table 4: Global Construction Repair Composites Market Volume K Tons Forecast, by Process 2020 & 2033
- Table 5: Global Construction Repair Composites Market Revenue Million Forecast, by End-user Industry 2020 & 2033
- Table 6: Global Construction Repair Composites Market Volume K Tons Forecast, by End-user Industry 2020 & 2033
- Table 7: Global Construction Repair Composites Market Revenue Million Forecast, by Region 2020 & 2033
- Table 8: Global Construction Repair Composites Market Volume K Tons Forecast, by Region 2020 & 2033
- Table 9: Global Construction Repair Composites Market Revenue Million Forecast, by Product Type 2020 & 2033
- Table 10: Global Construction Repair Composites Market Volume K Tons Forecast, by Product Type 2020 & 2033
- Table 11: Global Construction Repair Composites Market Revenue Million Forecast, by Process 2020 & 2033
- Table 12: Global Construction Repair Composites Market Volume K Tons Forecast, by Process 2020 & 2033
- Table 13: Global Construction Repair Composites Market Revenue Million Forecast, by End-user Industry 2020 & 2033
- Table 14: Global Construction Repair Composites Market Volume K Tons Forecast, by End-user Industry 2020 & 2033
- Table 15: Global Construction Repair Composites Market Revenue Million Forecast, by Country 2020 & 2033
- Table 16: Global Construction Repair Composites Market Volume K Tons Forecast, by Country 2020 & 2033
- Table 17: China Construction Repair Composites Market Revenue (Million) Forecast, by Application 2020 & 2033
- Table 18: China Construction Repair Composites Market Volume (K Tons) Forecast, by Application 2020 & 2033
- Table 19: India Construction Repair Composites Market Revenue (Million) Forecast, by Application 2020 & 2033
- Table 20: India Construction Repair Composites Market Volume (K Tons) Forecast, by Application 2020 & 2033
- Table 21: Japan Construction Repair Composites Market Revenue (Million) Forecast, by Application 2020 & 2033
- Table 22: Japan Construction Repair Composites Market Volume (K Tons) Forecast, by Application 2020 & 2033
- Table 23: South Korea Construction Repair Composites Market Revenue (Million) Forecast, by Application 2020 & 2033
- Table 24: South Korea Construction Repair Composites Market Volume (K Tons) Forecast, by Application 2020 & 2033
- Table 25: Rest of Asia Pacific Construction Repair Composites Market Revenue (Million) Forecast, by Application 2020 & 2033
- Table 26: Rest of Asia Pacific Construction Repair Composites Market Volume (K Tons) Forecast, by Application 2020 & 2033
- Table 27: Global Construction Repair Composites Market Revenue Million Forecast, by Product Type 2020 & 2033
- Table 28: Global Construction Repair Composites Market Volume K Tons Forecast, by Product Type 2020 & 2033
- Table 29: Global Construction Repair Composites Market Revenue Million Forecast, by Process 2020 & 2033
- Table 30: Global Construction Repair Composites Market Volume K Tons Forecast, by Process 2020 & 2033
- Table 31: Global Construction Repair Composites Market Revenue Million Forecast, by End-user Industry 2020 & 2033
- Table 32: Global Construction Repair Composites Market Volume K Tons Forecast, by End-user Industry 2020 & 2033
- Table 33: Global Construction Repair Composites Market Revenue Million Forecast, by Country 2020 & 2033
- Table 34: Global Construction Repair Composites Market Volume K Tons Forecast, by Country 2020 & 2033
- Table 35: United States Construction Repair Composites Market Revenue (Million) Forecast, by Application 2020 & 2033
- Table 36: United States Construction Repair Composites Market Volume (K Tons) Forecast, by Application 2020 & 2033
- Table 37: Canada Construction Repair Composites Market Revenue (Million) Forecast, by Application 2020 & 2033
- Table 38: Canada Construction Repair Composites Market Volume (K Tons) Forecast, by Application 2020 & 2033
- Table 39: Mexico Construction Repair Composites Market Revenue (Million) Forecast, by Application 2020 & 2033
- Table 40: Mexico Construction Repair Composites Market Volume (K Tons) Forecast, by Application 2020 & 2033
- Table 41: Global Construction Repair Composites Market Revenue Million Forecast, by Product Type 2020 & 2033
- Table 42: Global Construction Repair Composites Market Volume K Tons Forecast, by Product Type 2020 & 2033
- Table 43: Global Construction Repair Composites Market Revenue Million Forecast, by Process 2020 & 2033
- Table 44: Global Construction Repair Composites Market Volume K Tons Forecast, by Process 2020 & 2033
- Table 45: Global Construction Repair Composites Market Revenue Million Forecast, by End-user Industry 2020 & 2033
- Table 46: Global Construction Repair Composites Market Volume K Tons Forecast, by End-user Industry 2020 & 2033
- Table 47: Global Construction Repair Composites Market Revenue Million Forecast, by Country 2020 & 2033
- Table 48: Global Construction Repair Composites Market Volume K Tons Forecast, by Country 2020 & 2033
- Table 49: Germany Construction Repair Composites Market Revenue (Million) Forecast, by Application 2020 & 2033
- Table 50: Germany Construction Repair Composites Market Volume (K Tons) Forecast, by Application 2020 & 2033
- Table 51: United Kingdom Construction Repair Composites Market Revenue (Million) Forecast, by Application 2020 & 2033
- Table 52: United Kingdom Construction Repair Composites Market Volume (K Tons) Forecast, by Application 2020 & 2033
- Table 53: France Construction Repair Composites Market Revenue (Million) Forecast, by Application 2020 & 2033
- Table 54: France Construction Repair Composites Market Volume (K Tons) Forecast, by Application 2020 & 2033
- Table 55: Italy Construction Repair Composites Market Revenue (Million) Forecast, by Application 2020 & 2033
- Table 56: Italy Construction Repair Composites Market Volume (K Tons) Forecast, by Application 2020 & 2033
- Table 57: Rest of Europe Construction Repair Composites Market Revenue (Million) Forecast, by Application 2020 & 2033
- Table 58: Rest of Europe Construction Repair Composites Market Volume (K Tons) Forecast, by Application 2020 & 2033
- Table 59: Global Construction Repair Composites Market Revenue Million Forecast, by Product Type 2020 & 2033
- Table 60: Global Construction Repair Composites Market Volume K Tons Forecast, by Product Type 2020 & 2033
- Table 61: Global Construction Repair Composites Market Revenue Million Forecast, by Process 2020 & 2033
- Table 62: Global Construction Repair Composites Market Volume K Tons Forecast, by Process 2020 & 2033
- Table 63: Global Construction Repair Composites Market Revenue Million Forecast, by End-user Industry 2020 & 2033
- Table 64: Global Construction Repair Composites Market Volume K Tons Forecast, by End-user Industry 2020 & 2033
- Table 65: Global Construction Repair Composites Market Revenue Million Forecast, by Country 2020 & 2033
- Table 66: Global Construction Repair Composites Market Volume K Tons Forecast, by Country 2020 & 2033
- Table 67: Brazil Construction Repair Composites Market Revenue (Million) Forecast, by Application 2020 & 2033
- Table 68: Brazil Construction Repair Composites Market Volume (K Tons) Forecast, by Application 2020 & 2033
- Table 69: Argentina Construction Repair Composites Market Revenue (Million) Forecast, by Application 2020 & 2033
- Table 70: Argentina Construction Repair Composites Market Volume (K Tons) Forecast, by Application 2020 & 2033
- Table 71: Rest of South America Construction Repair Composites Market Revenue (Million) Forecast, by Application 2020 & 2033
- Table 72: Rest of South America Construction Repair Composites Market Volume (K Tons) Forecast, by Application 2020 & 2033
- Table 73: Global Construction Repair Composites Market Revenue Million Forecast, by Product Type 2020 & 2033
- Table 74: Global Construction Repair Composites Market Volume K Tons Forecast, by Product Type 2020 & 2033
- Table 75: Global Construction Repair Composites Market Revenue Million Forecast, by Process 2020 & 2033
- Table 76: Global Construction Repair Composites Market Volume K Tons Forecast, by Process 2020 & 2033
- Table 77: Global Construction Repair Composites Market Revenue Million Forecast, by End-user Industry 2020 & 2033
- Table 78: Global Construction Repair Composites Market Volume K Tons Forecast, by End-user Industry 2020 & 2033
- Table 79: Global Construction Repair Composites Market Revenue Million Forecast, by Country 2020 & 2033
- Table 80: Global Construction Repair Composites Market Volume K Tons Forecast, by Country 2020 & 2033
- Table 81: Saudi Arabia Construction Repair Composites Market Revenue (Million) Forecast, by Application 2020 & 2033
- Table 82: Saudi Arabia Construction Repair Composites Market Volume (K Tons) Forecast, by Application 2020 & 2033
- Table 83: South Africa Construction Repair Composites Market Revenue (Million) Forecast, by Application 2020 & 2033
- Table 84: South Africa Construction Repair Composites Market Volume (K Tons) Forecast, by Application 2020 & 2033
- Table 85: Rest of Middle East and Africa Construction Repair Composites Market Revenue (Million) Forecast, by Application 2020 & 2033
- Table 86: Rest of Middle East and Africa Construction Repair Composites Market Volume (K Tons) Forecast, by Application 2020 & 2033
Frequently Asked Questions
1. What is the projected Compound Annual Growth Rate (CAGR) of the Construction Repair Composites Market?
The projected CAGR is approximately > 8.00%.
2. Which companies are prominent players in the Construction Repair Composites Market?
Key companies in the market include Team Inc, Composite Technology Inc, WR Composites*List Not Exhaustive, Boeing Company, Clock Spring Company Inc, The IKM Group, TD Williamson Inc, Air France KLM Group, Milliken Infrastructure Solutions LLC, Lufthansa Technik AG, Hong Kong Aircraft Engineering Company Limited (HAECO), Crawford Composites LLC.
3. What are the main segments of the Construction Repair Composites Market?
The market segments include Product Type, Process, End-user Industry.
4. Can you provide details about the market size?
The market size is estimated to be USD 350 Million as of 2022.
5. What are some drivers contributing to market growth?
; Rising Investment in Rehabilitation of Old Structures; Cost Saving Associated with Composite Structure Repair; Increasing Use of Composites in the Aerospace and Defense Industry.
6. What are the notable trends driving market growth?
Aerospace and Defense to Lead the Growth of the Composite Repair Market.
7. Are there any restraints impacting market growth?
; Introduction of Self-healing Composites; Other Restraints.
8. Can you provide examples of recent developments in the market?
N/A
9. What pricing options are available for accessing the report?
Pricing options include single-user, multi-user, and enterprise licenses priced at USD 4750, USD 5250, and USD 8750 respectively.
10. Is the market size provided in terms of value or volume?
The market size is provided in terms of value, measured in Million and volume, measured in K Tons.
11. Are there any specific market keywords associated with the report?
Yes, the market keyword associated with the report is "Construction Repair Composites Market," which aids in identifying and referencing the specific market segment covered.
12. How do I determine which pricing option suits my needs best?
The pricing options vary based on user requirements and access needs. Individual users may opt for single-user licenses, while businesses requiring broader access may choose multi-user or enterprise licenses for cost-effective access to the report.
13. Are there any additional resources or data provided in the Construction Repair Composites Market report?
While the report offers comprehensive insights, it's advisable to review the specific contents or supplementary materials provided to ascertain if additional resources or data are available.
14. How can I stay updated on further developments or reports in the Construction Repair Composites Market?
To stay informed about further developments, trends, and reports in the Construction Repair Composites Market, consider subscribing to industry newsletters, following relevant companies and organizations, or regularly checking reputable industry news sources and publications.
Methodology
Step 1 - Identification of Relevant Samples Size from Population Database


Step 2 - Approaches for Defining Global Market Size (Value, Volume* & Price*)

Note*: In applicable scenarios
Step 3 - Data Sources
Primary Research
- Web Analytics
- Survey Reports
- Research Institute
- Latest Research Reports
- Opinion Leaders
Secondary Research
- Annual Reports
- White Paper
- Latest Press Release
- Industry Association
- Paid Database
- Investor Presentations

Step 4 - Data Triangulation
Involves using different sources of information in order to increase the validity of a study
These sources are likely to be stakeholders in a program - participants, other researchers, program staff, other community members, and so on.
Then we put all data in single framework & apply various statistical tools to find out the dynamic on the market.
During the analysis stage, feedback from the stakeholder groups would be compared to determine areas of agreement as well as areas of divergence