

Key Insights
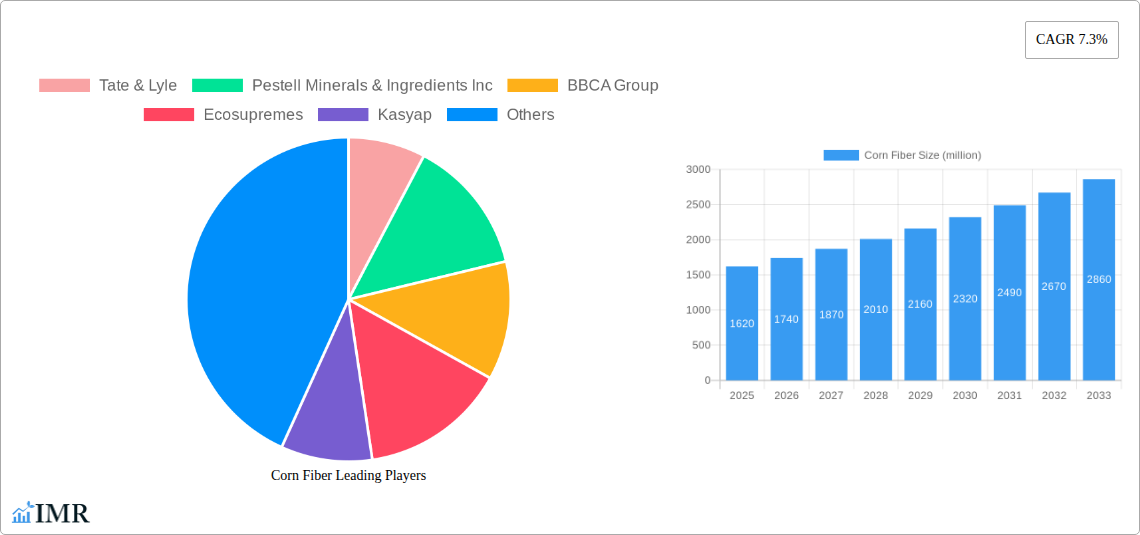
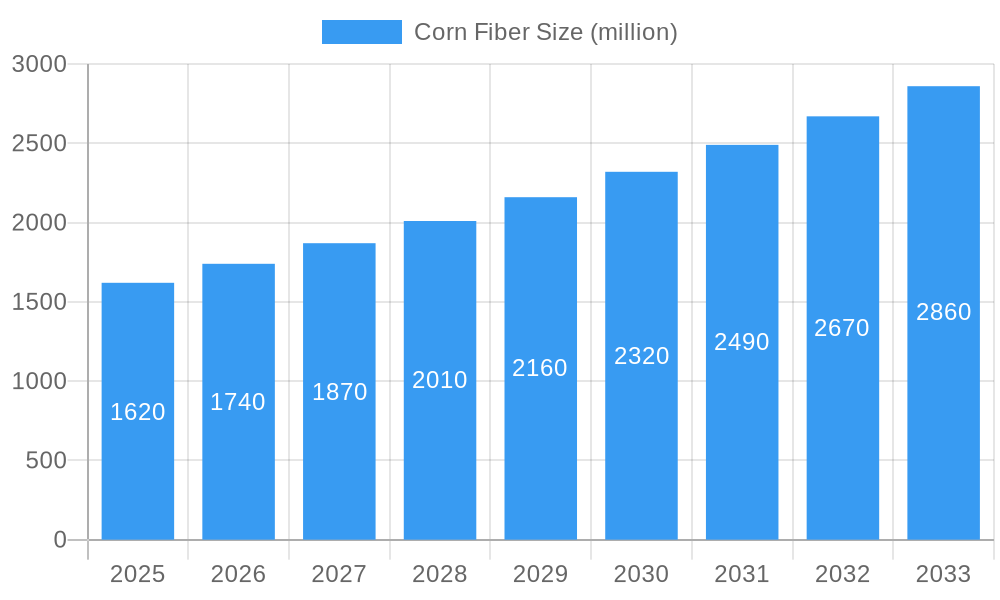
The corn fiber market, currently valued at $1620 million in 2025, is projected to experience robust growth, driven by increasing demand for natural and functional food ingredients. The market's Compound Annual Growth Rate (CAGR) of 7.3% from 2019 to 2033 indicates a significant expansion over the forecast period (2025-2033). This growth is fueled by several factors. The rising awareness of health and wellness among consumers is driving demand for food products with high fiber content, boosting the use of corn fiber as a dietary supplement and ingredient in various food applications. Furthermore, the increasing adoption of corn fiber in the food and beverage industry as a cost-effective alternative to other fiber sources, coupled with its versatility in texture modification and improved nutritional profile, is contributing to market expansion. The versatility of corn fiber, allowing its use in various products ranging from bakery items and confectionery to pet food and pharmaceuticals, broadens its market appeal. While challenges like fluctuating raw material prices and competition from other fiber sources exist, the overall market outlook remains positive, projecting substantial growth throughout the forecast period. Key players like Tate & Lyle, Pestell Minerals & Ingredients Inc, BBCA Group, Ecosupremes, and Kasyap are actively shaping market dynamics through innovation and strategic partnerships.
Corn Fiber Market Size (In Billion)
The competitive landscape is marked by both established players and emerging companies vying for market share. Strategic collaborations, acquisitions, and product innovations are shaping the competitive dynamics. While precise regional breakdowns are unavailable, it's likely that regions with high consumption of processed foods and a rising health-conscious population will show higher market penetration. Expansion into emerging markets, particularly in Asia and Latin America, presents significant growth opportunities for corn fiber manufacturers. Future market growth will hinge on continued innovation in product applications, the development of sustainable and efficient production methods, and effective marketing strategies that highlight the health benefits and versatility of corn fiber. Industry advancements focusing on improved functionalities and cost-effectiveness of corn fiber are expected to further drive market expansion.
Corn Fiber Company Market Share
Corn Fiber Market Report: A Comprehensive Analysis (2019-2033)
This in-depth report provides a comprehensive analysis of the global corn fiber market, offering invaluable insights for industry professionals, investors, and strategic decision-makers. Covering the period from 2019 to 2033, with a focus on 2025, this report meticulously examines market dynamics, growth trends, regional dominance, product landscape, and key players, illuminating both current realities and future potential within the food ingredients and animal feed parent markets. The report leverages proprietary data and industry expertise to deliver actionable intelligence, facilitating informed strategic planning and investment decisions.
Corn Fiber Market Dynamics & Structure
This section analyzes the competitive landscape of the corn fiber market, examining market concentration, technological advancements, regulatory influences, and prevailing market trends. The global corn fiber market size in 2025 is estimated at $XX million, expected to reach $YY million by 2033, exhibiting a CAGR of X%.
- Market Concentration: The market is characterized by a moderate level of concentration, with key players like Tate & Lyle, Pestell Minerals & Ingredients Inc, BBCA Group, Ecosupremes, and Kasyap holding significant market shares, though precise figures are proprietary to this report.
- Technological Innovation: Advancements in corn processing technologies, particularly in fiber extraction and purification, are driving increased efficiency and cost-effectiveness. However, barriers to entry include high capital expenditure requirements for specialized equipment.
- Regulatory Framework: Government regulations concerning food additives and labeling significantly impact the market. Compliance costs represent a considerable factor for smaller players.
- Competitive Substitutes: Other dietary fibers, like wheat fiber and cellulose, pose competitive pressure, necessitating continuous innovation and value-added product development.
- End-User Demographics: The increasing demand for healthier food products and functional food ingredients is a primary growth driver, particularly across the health-conscious consumer segments within the food and beverage industry and animal feed industry.
- M&A Trends: The number of M&A deals within the corn fiber industry during the historical period (2019-2024) averaged approximately XX per year, reflecting consolidation and expansion strategies within the sector.
Corn Fiber Growth Trends & Insights
Leveraging proprietary data analysis, this section details the evolution of the corn fiber market size, adoption rates, technological disruptions, and shifts in consumer preferences. The historical period (2019-2024) saw a steady growth trajectory, with fluctuations influenced by factors such as raw material prices and global economic conditions. The forecast period (2025-2033) projects a robust growth rate driven by increasing consumer awareness of health benefits and the growing demand for natural food ingredients. Specifically, the market experienced a CAGR of X% during the historical period, and is projected to experience a CAGR of Y% during the forecast period. Market penetration in key regions has also shown significant increase. Technological advancements in extraction and purification processes are further accelerating market growth. A notable shift in consumer preference towards clean-label and sustainable products is observed.
Dominant Regions, Countries, or Segments in Corn Fiber
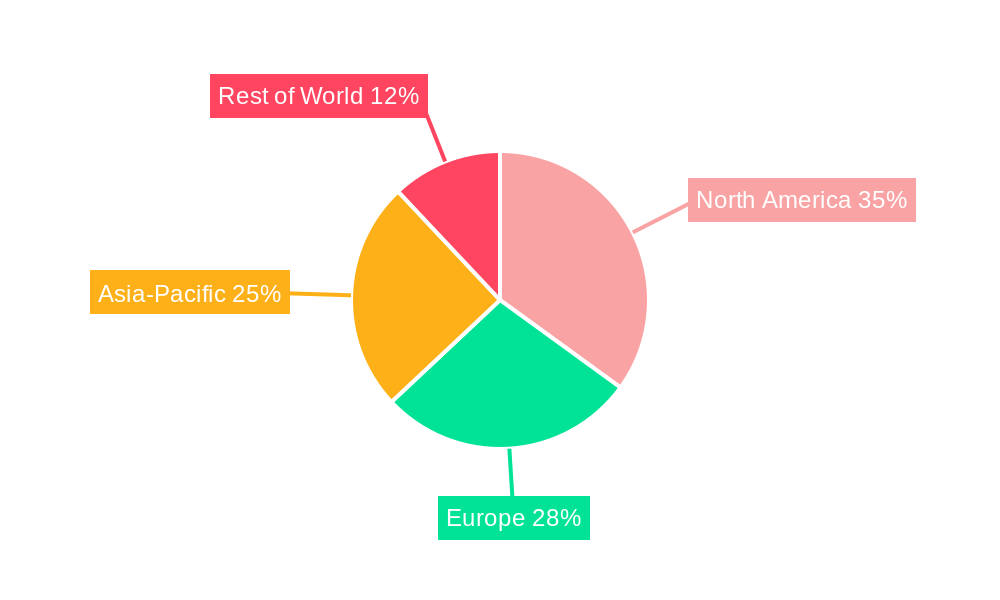
North America currently holds the largest market share in the corn fiber sector, driven by robust demand from the food and beverage industry and well-established processing infrastructure. However, Asia-Pacific is poised for substantial growth, fueled by rising disposable incomes, increasing health awareness, and expanding food processing capabilities.
- Key Drivers in North America: Strong consumer demand for health-focused food products, established food processing infrastructure, and substantial investments in research and development.
- Key Drivers in Asia-Pacific: Rapidly expanding food and beverage industry, rising disposable incomes, increasing health awareness, and supportive government policies promoting the use of functional foods and ingredients.
- Market Share and Growth Potential: While precise market share data is proprietary, North America retains a commanding lead, followed by Europe and Asia-Pacific. Asia-Pacific demonstrates the highest growth potential during the forecast period.
Corn Fiber Product Landscape
Corn fiber products are broadly categorized into various forms, including soluble and insoluble fibers, tailored to meet specific applications in food, feed, and other industries. Recent innovations focus on enhancing functional properties, such as improved texture, viscosity, and water-holding capacity. These advancements cater to the growing demand for natural and functional ingredients within the broader food technology industry, driving the need for new applications across a wider variety of food and beverage products.
Key Drivers, Barriers & Challenges in Corn Fiber
Key Drivers: The rising consumer preference for healthier and functional foods fuels the demand for corn fiber, while the increasing adoption of corn fiber in the animal feed sector further boosts market growth. Technological advancements in production and purification methods enhance efficiency and product quality.
Key Challenges: Fluctuations in corn prices and the global supply chain pose significant challenges to market stability. Stringent regulatory requirements regarding food additives and labeling add complexity and cost to product development and launch. Intense competition among established players and the emergence of new entrants create a dynamic and challenging market landscape.
Emerging Opportunities in Corn Fiber
Untapped markets in developing economies, coupled with growing demand for natural food ingredients, presents substantial growth opportunities. The expansion of corn fiber applications into novel food products, such as plant-based alternatives and functional beverages, opens new avenues for market expansion. Innovative product formulations emphasizing sustained release capabilities and enhanced digestive benefits are further increasing market potential.
Growth Accelerators in the Corn Fiber Industry
Strategic collaborations between corn processors and food manufacturers are crucial drivers of market growth. Technological breakthroughs in extraction processes, resulting in higher yields and improved fiber quality, further enhance the competitiveness of corn fiber. Expansion into new geographical markets and diversification of product offerings contribute to sustained market expansion.
Key Players Shaping the Corn Fiber Market
- Tate & Lyle
- Pestell Minerals & Ingredients Inc
- BBCA Group
- Ecosupremes
- Kasyap
Notable Milestones in Corn Fiber Sector
- 2021: Launch of a novel high-fiber corn product by Tate & Lyle.
- 2022: Acquisition of a smaller corn fiber producer by BBCA Group, expanding its market share.
- 2023: Introduction of a new sustainable corn fiber processing technology by a leading player. (Specific details are proprietary.)
- 2024: Increased regulatory scrutiny on labeling claims related to dietary fiber content.
In-Depth Corn Fiber Market Outlook
The global corn fiber market is poised for continued strong growth over the forecast period, driven by robust demand from food, animal feed and other industrial applications. Strategic opportunities exist for players to capitalize on technological innovation, expand into emerging markets, and develop value-added products that cater to evolving consumer preferences for healthy and sustainable food solutions. The market's trajectory indicates a promising future for corn fiber, presenting a significant opportunity for players who can adapt to market dynamics and seize strategic growth opportunities.
Corn Fiber Segmentation
-
1. Application
- 1.1. Food
- 1.2. Feed
- 1.3. Supplements
- 1.4. Other
-
2. Type
- 2.1. Organic Corn Fiber
- 2.2. Normal Corn Fiber
Corn Fiber Segmentation By Geography
-
1. North America
- 1.1. United States
- 1.2. Canada
- 1.3. Mexico
-
2. South America
- 2.1. Brazil
- 2.2. Argentina
- 2.3. Rest of South America
-
3. Europe
- 3.1. United Kingdom
- 3.2. Germany
- 3.3. France
- 3.4. Italy
- 3.5. Spain
- 3.6. Russia
- 3.7. Benelux
- 3.8. Nordics
- 3.9. Rest of Europe
-
4. Middle East & Africa
- 4.1. Turkey
- 4.2. Israel
- 4.3. GCC
- 4.4. North Africa
- 4.5. South Africa
- 4.6. Rest of Middle East & Africa
-
5. Asia Pacific
- 5.1. China
- 5.2. India
- 5.3. Japan
- 5.4. South Korea
- 5.5. ASEAN
- 5.6. Oceania
- 5.7. Rest of Asia Pacific
Corn Fiber Regional Market Share
Geographic Coverage of Corn Fiber
Corn Fiber REPORT HIGHLIGHTS
| Aspects | Details |
|---|---|
| Study Period | 2020-2034 |
| Base Year | 2025 |
| Estimated Year | 2026 |
| Forecast Period | 2026-2034 |
| Historical Period | 2020-2025 |
| Growth Rate | CAGR of 7.3% from 2020-2034 |
| Segmentation |
|
Table of Contents
- 1. Introduction
- 1.1. Research Scope
- 1.2. Market Segmentation
- 1.3. Research Objective
- 1.4. Definitions and Assumptions
- 2. Executive Summary
- 2.1. Market Snapshot
- 3. Market Dynamics
- 3.1. Market Drivers
- 3.2. Market Restrains
- 3.3. Market Trends
- 3.4. Market Opportunities
- 4. Market Factor Analysis
- 4.1. Porters Five Forces
- 4.1.1. Bargaining Power of Suppliers
- 4.1.2. Bargaining Power of Buyers
- 4.1.3. Threat of New Entrants
- 4.1.4. Threat of Substitutes
- 4.1.5. Competitive Rivalry
- 4.2. PESTEL analysis
- 4.3. BCG Analysis
- 4.3.1. Stars (High Growth, High Market Share)
- 4.3.2. Cash Cows (Low Growth, High Market Share)
- 4.3.3. Question Mark (High Growth, Low Market Share)
- 4.3.4. Dogs (Low Growth, Low Market Share)
- 4.4. Ansoff Matrix Analysis
- 4.5. Supply Chain Analysis
- 4.6. Regulatory Landscape
- 4.7. Current Market Potential and Opportunity Assessment (TAM–SAM–SOM Framework)
- 4.8. IMR Analyst Note
- 4.1. Porters Five Forces
- 5. Market Analysis, Insights and Forecast 2021-2033
- 5.1. Market Analysis, Insights and Forecast - by Application
- 5.1.1. Food
- 5.1.2. Feed
- 5.1.3. Supplements
- 5.1.4. Other
- 5.2. Market Analysis, Insights and Forecast - by Type
- 5.2.1. Organic Corn Fiber
- 5.2.2. Normal Corn Fiber
- 5.3. Market Analysis, Insights and Forecast - by Region
- 5.3.1. North America
- 5.3.2. South America
- 5.3.3. Europe
- 5.3.4. Middle East & Africa
- 5.3.5. Asia Pacific
- 5.1. Market Analysis, Insights and Forecast - by Application
- 6. Global Corn Fiber Analysis, Insights and Forecast, 2021-2033
- 6.1. Market Analysis, Insights and Forecast - by Application
- 6.1.1. Food
- 6.1.2. Feed
- 6.1.3. Supplements
- 6.1.4. Other
- 6.2. Market Analysis, Insights and Forecast - by Type
- 6.2.1. Organic Corn Fiber
- 6.2.2. Normal Corn Fiber
- 6.1. Market Analysis, Insights and Forecast - by Application
- 7. North America Corn Fiber Analysis, Insights and Forecast, 2020-2032
- 7.1. Market Analysis, Insights and Forecast - by Application
- 7.1.1. Food
- 7.1.2. Feed
- 7.1.3. Supplements
- 7.1.4. Other
- 7.2. Market Analysis, Insights and Forecast - by Type
- 7.2.1. Organic Corn Fiber
- 7.2.2. Normal Corn Fiber
- 7.1. Market Analysis, Insights and Forecast - by Application
- 8. South America Corn Fiber Analysis, Insights and Forecast, 2020-2032
- 8.1. Market Analysis, Insights and Forecast - by Application
- 8.1.1. Food
- 8.1.2. Feed
- 8.1.3. Supplements
- 8.1.4. Other
- 8.2. Market Analysis, Insights and Forecast - by Type
- 8.2.1. Organic Corn Fiber
- 8.2.2. Normal Corn Fiber
- 8.1. Market Analysis, Insights and Forecast - by Application
- 9. Europe Corn Fiber Analysis, Insights and Forecast, 2020-2032
- 9.1. Market Analysis, Insights and Forecast - by Application
- 9.1.1. Food
- 9.1.2. Feed
- 9.1.3. Supplements
- 9.1.4. Other
- 9.2. Market Analysis, Insights and Forecast - by Type
- 9.2.1. Organic Corn Fiber
- 9.2.2. Normal Corn Fiber
- 9.1. Market Analysis, Insights and Forecast - by Application
- 10. Middle East & Africa Corn Fiber Analysis, Insights and Forecast, 2020-2032
- 10.1. Market Analysis, Insights and Forecast - by Application
- 10.1.1. Food
- 10.1.2. Feed
- 10.1.3. Supplements
- 10.1.4. Other
- 10.2. Market Analysis, Insights and Forecast - by Type
- 10.2.1. Organic Corn Fiber
- 10.2.2. Normal Corn Fiber
- 10.1. Market Analysis, Insights and Forecast - by Application
- 11. Asia Pacific Corn Fiber Analysis, Insights and Forecast, 2020-2032
- 11.1. Market Analysis, Insights and Forecast - by Application
- 11.1.1. Food
- 11.1.2. Feed
- 11.1.3. Supplements
- 11.1.4. Other
- 11.2. Market Analysis, Insights and Forecast - by Type
- 11.2.1. Organic Corn Fiber
- 11.2.2. Normal Corn Fiber
- 11.1. Market Analysis, Insights and Forecast - by Application
- 12. Competitive Analysis
- 12.1. Company Profiles
- 12.1.1 Tate & Lyle
- 12.1.1.1. Company Overview
- 12.1.1.2. Products
- 12.1.1.3. Company Financials
- 12.1.1.4. SWOT Analysis
- 12.1.2 Pestell Minerals & Ingredients Inc
- 12.1.2.1. Company Overview
- 12.1.2.2. Products
- 12.1.2.3. Company Financials
- 12.1.2.4. SWOT Analysis
- 12.1.3 BBCA Group
- 12.1.3.1. Company Overview
- 12.1.3.2. Products
- 12.1.3.3. Company Financials
- 12.1.3.4. SWOT Analysis
- 12.1.4 Ecosupremes
- 12.1.4.1. Company Overview
- 12.1.4.2. Products
- 12.1.4.3. Company Financials
- 12.1.4.4. SWOT Analysis
- 12.1.5 Kasyap
- 12.1.5.1. Company Overview
- 12.1.5.2. Products
- 12.1.5.3. Company Financials
- 12.1.5.4. SWOT Analysis
- 12.1.1 Tate & Lyle
- 12.2. Market Entropy
- 12.2.1 Company's Key Areas Served
- 12.2.2 Recent Developments
- 12.3. Company Market Share Analysis 2025
- 12.3.1 Top 5 Companies Market Share Analysis
- 12.3.2 Top 3 Companies Market Share Analysis
- 12.4. List of Potential Customers
- 13. Research Methodology
List of Figures
- Figure 1: Global Corn Fiber Revenue Breakdown (million, %) by Region 2025 & 2033
- Figure 2: Global Corn Fiber Volume Breakdown (K, %) by Region 2025 & 2033
- Figure 3: North America Corn Fiber Revenue (million), by Application 2025 & 2033
- Figure 4: North America Corn Fiber Volume (K), by Application 2025 & 2033
- Figure 5: North America Corn Fiber Revenue Share (%), by Application 2025 & 2033
- Figure 6: North America Corn Fiber Volume Share (%), by Application 2025 & 2033
- Figure 7: North America Corn Fiber Revenue (million), by Type 2025 & 2033
- Figure 8: North America Corn Fiber Volume (K), by Type 2025 & 2033
- Figure 9: North America Corn Fiber Revenue Share (%), by Type 2025 & 2033
- Figure 10: North America Corn Fiber Volume Share (%), by Type 2025 & 2033
- Figure 11: North America Corn Fiber Revenue (million), by Country 2025 & 2033
- Figure 12: North America Corn Fiber Volume (K), by Country 2025 & 2033
- Figure 13: North America Corn Fiber Revenue Share (%), by Country 2025 & 2033
- Figure 14: North America Corn Fiber Volume Share (%), by Country 2025 & 2033
- Figure 15: South America Corn Fiber Revenue (million), by Application 2025 & 2033
- Figure 16: South America Corn Fiber Volume (K), by Application 2025 & 2033
- Figure 17: South America Corn Fiber Revenue Share (%), by Application 2025 & 2033
- Figure 18: South America Corn Fiber Volume Share (%), by Application 2025 & 2033
- Figure 19: South America Corn Fiber Revenue (million), by Type 2025 & 2033
- Figure 20: South America Corn Fiber Volume (K), by Type 2025 & 2033
- Figure 21: South America Corn Fiber Revenue Share (%), by Type 2025 & 2033
- Figure 22: South America Corn Fiber Volume Share (%), by Type 2025 & 2033
- Figure 23: South America Corn Fiber Revenue (million), by Country 2025 & 2033
- Figure 24: South America Corn Fiber Volume (K), by Country 2025 & 2033
- Figure 25: South America Corn Fiber Revenue Share (%), by Country 2025 & 2033
- Figure 26: South America Corn Fiber Volume Share (%), by Country 2025 & 2033
- Figure 27: Europe Corn Fiber Revenue (million), by Application 2025 & 2033
- Figure 28: Europe Corn Fiber Volume (K), by Application 2025 & 2033
- Figure 29: Europe Corn Fiber Revenue Share (%), by Application 2025 & 2033
- Figure 30: Europe Corn Fiber Volume Share (%), by Application 2025 & 2033
- Figure 31: Europe Corn Fiber Revenue (million), by Type 2025 & 2033
- Figure 32: Europe Corn Fiber Volume (K), by Type 2025 & 2033
- Figure 33: Europe Corn Fiber Revenue Share (%), by Type 2025 & 2033
- Figure 34: Europe Corn Fiber Volume Share (%), by Type 2025 & 2033
- Figure 35: Europe Corn Fiber Revenue (million), by Country 2025 & 2033
- Figure 36: Europe Corn Fiber Volume (K), by Country 2025 & 2033
- Figure 37: Europe Corn Fiber Revenue Share (%), by Country 2025 & 2033
- Figure 38: Europe Corn Fiber Volume Share (%), by Country 2025 & 2033
- Figure 39: Middle East & Africa Corn Fiber Revenue (million), by Application 2025 & 2033
- Figure 40: Middle East & Africa Corn Fiber Volume (K), by Application 2025 & 2033
- Figure 41: Middle East & Africa Corn Fiber Revenue Share (%), by Application 2025 & 2033
- Figure 42: Middle East & Africa Corn Fiber Volume Share (%), by Application 2025 & 2033
- Figure 43: Middle East & Africa Corn Fiber Revenue (million), by Type 2025 & 2033
- Figure 44: Middle East & Africa Corn Fiber Volume (K), by Type 2025 & 2033
- Figure 45: Middle East & Africa Corn Fiber Revenue Share (%), by Type 2025 & 2033
- Figure 46: Middle East & Africa Corn Fiber Volume Share (%), by Type 2025 & 2033
- Figure 47: Middle East & Africa Corn Fiber Revenue (million), by Country 2025 & 2033
- Figure 48: Middle East & Africa Corn Fiber Volume (K), by Country 2025 & 2033
- Figure 49: Middle East & Africa Corn Fiber Revenue Share (%), by Country 2025 & 2033
- Figure 50: Middle East & Africa Corn Fiber Volume Share (%), by Country 2025 & 2033
- Figure 51: Asia Pacific Corn Fiber Revenue (million), by Application 2025 & 2033
- Figure 52: Asia Pacific Corn Fiber Volume (K), by Application 2025 & 2033
- Figure 53: Asia Pacific Corn Fiber Revenue Share (%), by Application 2025 & 2033
- Figure 54: Asia Pacific Corn Fiber Volume Share (%), by Application 2025 & 2033
- Figure 55: Asia Pacific Corn Fiber Revenue (million), by Type 2025 & 2033
- Figure 56: Asia Pacific Corn Fiber Volume (K), by Type 2025 & 2033
- Figure 57: Asia Pacific Corn Fiber Revenue Share (%), by Type 2025 & 2033
- Figure 58: Asia Pacific Corn Fiber Volume Share (%), by Type 2025 & 2033
- Figure 59: Asia Pacific Corn Fiber Revenue (million), by Country 2025 & 2033
- Figure 60: Asia Pacific Corn Fiber Volume (K), by Country 2025 & 2033
- Figure 61: Asia Pacific Corn Fiber Revenue Share (%), by Country 2025 & 2033
- Figure 62: Asia Pacific Corn Fiber Volume Share (%), by Country 2025 & 2033
List of Tables
- Table 1: Global Corn Fiber Revenue million Forecast, by Application 2020 & 2033
- Table 2: Global Corn Fiber Volume K Forecast, by Application 2020 & 2033
- Table 3: Global Corn Fiber Revenue million Forecast, by Type 2020 & 2033
- Table 4: Global Corn Fiber Volume K Forecast, by Type 2020 & 2033
- Table 5: Global Corn Fiber Revenue million Forecast, by Region 2020 & 2033
- Table 6: Global Corn Fiber Volume K Forecast, by Region 2020 & 2033
- Table 7: Global Corn Fiber Revenue million Forecast, by Application 2020 & 2033
- Table 8: Global Corn Fiber Volume K Forecast, by Application 2020 & 2033
- Table 9: Global Corn Fiber Revenue million Forecast, by Type 2020 & 2033
- Table 10: Global Corn Fiber Volume K Forecast, by Type 2020 & 2033
- Table 11: Global Corn Fiber Revenue million Forecast, by Country 2020 & 2033
- Table 12: Global Corn Fiber Volume K Forecast, by Country 2020 & 2033
- Table 13: United States Corn Fiber Revenue (million) Forecast, by Application 2020 & 2033
- Table 14: United States Corn Fiber Volume (K) Forecast, by Application 2020 & 2033
- Table 15: Canada Corn Fiber Revenue (million) Forecast, by Application 2020 & 2033
- Table 16: Canada Corn Fiber Volume (K) Forecast, by Application 2020 & 2033
- Table 17: Mexico Corn Fiber Revenue (million) Forecast, by Application 2020 & 2033
- Table 18: Mexico Corn Fiber Volume (K) Forecast, by Application 2020 & 2033
- Table 19: Global Corn Fiber Revenue million Forecast, by Application 2020 & 2033
- Table 20: Global Corn Fiber Volume K Forecast, by Application 2020 & 2033
- Table 21: Global Corn Fiber Revenue million Forecast, by Type 2020 & 2033
- Table 22: Global Corn Fiber Volume K Forecast, by Type 2020 & 2033
- Table 23: Global Corn Fiber Revenue million Forecast, by Country 2020 & 2033
- Table 24: Global Corn Fiber Volume K Forecast, by Country 2020 & 2033
- Table 25: Brazil Corn Fiber Revenue (million) Forecast, by Application 2020 & 2033
- Table 26: Brazil Corn Fiber Volume (K) Forecast, by Application 2020 & 2033
- Table 27: Argentina Corn Fiber Revenue (million) Forecast, by Application 2020 & 2033
- Table 28: Argentina Corn Fiber Volume (K) Forecast, by Application 2020 & 2033
- Table 29: Rest of South America Corn Fiber Revenue (million) Forecast, by Application 2020 & 2033
- Table 30: Rest of South America Corn Fiber Volume (K) Forecast, by Application 2020 & 2033
- Table 31: Global Corn Fiber Revenue million Forecast, by Application 2020 & 2033
- Table 32: Global Corn Fiber Volume K Forecast, by Application 2020 & 2033
- Table 33: Global Corn Fiber Revenue million Forecast, by Type 2020 & 2033
- Table 34: Global Corn Fiber Volume K Forecast, by Type 2020 & 2033
- Table 35: Global Corn Fiber Revenue million Forecast, by Country 2020 & 2033
- Table 36: Global Corn Fiber Volume K Forecast, by Country 2020 & 2033
- Table 37: United Kingdom Corn Fiber Revenue (million) Forecast, by Application 2020 & 2033
- Table 38: United Kingdom Corn Fiber Volume (K) Forecast, by Application 2020 & 2033
- Table 39: Germany Corn Fiber Revenue (million) Forecast, by Application 2020 & 2033
- Table 40: Germany Corn Fiber Volume (K) Forecast, by Application 2020 & 2033
- Table 41: France Corn Fiber Revenue (million) Forecast, by Application 2020 & 2033
- Table 42: France Corn Fiber Volume (K) Forecast, by Application 2020 & 2033
- Table 43: Italy Corn Fiber Revenue (million) Forecast, by Application 2020 & 2033
- Table 44: Italy Corn Fiber Volume (K) Forecast, by Application 2020 & 2033
- Table 45: Spain Corn Fiber Revenue (million) Forecast, by Application 2020 & 2033
- Table 46: Spain Corn Fiber Volume (K) Forecast, by Application 2020 & 2033
- Table 47: Russia Corn Fiber Revenue (million) Forecast, by Application 2020 & 2033
- Table 48: Russia Corn Fiber Volume (K) Forecast, by Application 2020 & 2033
- Table 49: Benelux Corn Fiber Revenue (million) Forecast, by Application 2020 & 2033
- Table 50: Benelux Corn Fiber Volume (K) Forecast, by Application 2020 & 2033
- Table 51: Nordics Corn Fiber Revenue (million) Forecast, by Application 2020 & 2033
- Table 52: Nordics Corn Fiber Volume (K) Forecast, by Application 2020 & 2033
- Table 53: Rest of Europe Corn Fiber Revenue (million) Forecast, by Application 2020 & 2033
- Table 54: Rest of Europe Corn Fiber Volume (K) Forecast, by Application 2020 & 2033
- Table 55: Global Corn Fiber Revenue million Forecast, by Application 2020 & 2033
- Table 56: Global Corn Fiber Volume K Forecast, by Application 2020 & 2033
- Table 57: Global Corn Fiber Revenue million Forecast, by Type 2020 & 2033
- Table 58: Global Corn Fiber Volume K Forecast, by Type 2020 & 2033
- Table 59: Global Corn Fiber Revenue million Forecast, by Country 2020 & 2033
- Table 60: Global Corn Fiber Volume K Forecast, by Country 2020 & 2033
- Table 61: Turkey Corn Fiber Revenue (million) Forecast, by Application 2020 & 2033
- Table 62: Turkey Corn Fiber Volume (K) Forecast, by Application 2020 & 2033
- Table 63: Israel Corn Fiber Revenue (million) Forecast, by Application 2020 & 2033
- Table 64: Israel Corn Fiber Volume (K) Forecast, by Application 2020 & 2033
- Table 65: GCC Corn Fiber Revenue (million) Forecast, by Application 2020 & 2033
- Table 66: GCC Corn Fiber Volume (K) Forecast, by Application 2020 & 2033
- Table 67: North Africa Corn Fiber Revenue (million) Forecast, by Application 2020 & 2033
- Table 68: North Africa Corn Fiber Volume (K) Forecast, by Application 2020 & 2033
- Table 69: South Africa Corn Fiber Revenue (million) Forecast, by Application 2020 & 2033
- Table 70: South Africa Corn Fiber Volume (K) Forecast, by Application 2020 & 2033
- Table 71: Rest of Middle East & Africa Corn Fiber Revenue (million) Forecast, by Application 2020 & 2033
- Table 72: Rest of Middle East & Africa Corn Fiber Volume (K) Forecast, by Application 2020 & 2033
- Table 73: Global Corn Fiber Revenue million Forecast, by Application 2020 & 2033
- Table 74: Global Corn Fiber Volume K Forecast, by Application 2020 & 2033
- Table 75: Global Corn Fiber Revenue million Forecast, by Type 2020 & 2033
- Table 76: Global Corn Fiber Volume K Forecast, by Type 2020 & 2033
- Table 77: Global Corn Fiber Revenue million Forecast, by Country 2020 & 2033
- Table 78: Global Corn Fiber Volume K Forecast, by Country 2020 & 2033
- Table 79: China Corn Fiber Revenue (million) Forecast, by Application 2020 & 2033
- Table 80: China Corn Fiber Volume (K) Forecast, by Application 2020 & 2033
- Table 81: India Corn Fiber Revenue (million) Forecast, by Application 2020 & 2033
- Table 82: India Corn Fiber Volume (K) Forecast, by Application 2020 & 2033
- Table 83: Japan Corn Fiber Revenue (million) Forecast, by Application 2020 & 2033
- Table 84: Japan Corn Fiber Volume (K) Forecast, by Application 2020 & 2033
- Table 85: South Korea Corn Fiber Revenue (million) Forecast, by Application 2020 & 2033
- Table 86: South Korea Corn Fiber Volume (K) Forecast, by Application 2020 & 2033
- Table 87: ASEAN Corn Fiber Revenue (million) Forecast, by Application 2020 & 2033
- Table 88: ASEAN Corn Fiber Volume (K) Forecast, by Application 2020 & 2033
- Table 89: Oceania Corn Fiber Revenue (million) Forecast, by Application 2020 & 2033
- Table 90: Oceania Corn Fiber Volume (K) Forecast, by Application 2020 & 2033
- Table 91: Rest of Asia Pacific Corn Fiber Revenue (million) Forecast, by Application 2020 & 2033
- Table 92: Rest of Asia Pacific Corn Fiber Volume (K) Forecast, by Application 2020 & 2033
Frequently Asked Questions
1. What is the projected Compound Annual Growth Rate (CAGR) of the Corn Fiber?
The projected CAGR is approximately 7.3%.
2. Which companies are prominent players in the Corn Fiber?
Key companies in the market include Tate & Lyle, Pestell Minerals & Ingredients Inc, BBCA Group, Ecosupremes, Kasyap.
3. What are the main segments of the Corn Fiber?
The market segments include Application, Type.
4. Can you provide details about the market size?
The market size is estimated to be USD 1620 million as of 2022.
5. What are some drivers contributing to market growth?
N/A
6. What are the notable trends driving market growth?
N/A
7. Are there any restraints impacting market growth?
N/A
8. Can you provide examples of recent developments in the market?
N/A
9. What pricing options are available for accessing the report?
Pricing options include single-user, multi-user, and enterprise licenses priced at USD 3950.00, USD 5925.00, and USD 7900.00 respectively.
10. Is the market size provided in terms of value or volume?
The market size is provided in terms of value, measured in million and volume, measured in K.
11. Are there any specific market keywords associated with the report?
Yes, the market keyword associated with the report is "Corn Fiber," which aids in identifying and referencing the specific market segment covered.
12. How do I determine which pricing option suits my needs best?
The pricing options vary based on user requirements and access needs. Individual users may opt for single-user licenses, while businesses requiring broader access may choose multi-user or enterprise licenses for cost-effective access to the report.
13. Are there any additional resources or data provided in the Corn Fiber report?
While the report offers comprehensive insights, it's advisable to review the specific contents or supplementary materials provided to ascertain if additional resources or data are available.
14. How can I stay updated on further developments or reports in the Corn Fiber?
To stay informed about further developments, trends, and reports in the Corn Fiber, consider subscribing to industry newsletters, following relevant companies and organizations, or regularly checking reputable industry news sources and publications.
Methodology
Step 1 - Identification of Relevant Samples Size from Population Database


Step 2 - Approaches for Defining Global Market Size (Value, Volume* & Price*)

Note*: In applicable scenarios
Step 3 - Data Sources
Primary Research
- Web Analytics
- Survey Reports
- Research Institute
- Latest Research Reports
- Opinion Leaders
Secondary Research
- Annual Reports
- White Paper
- Latest Press Release
- Industry Association
- Paid Database
- Investor Presentations

Step 4 - Data Triangulation
Involves using different sources of information in order to increase the validity of a study
These sources are likely to be stakeholders in a program - participants, other researchers, program staff, other community members, and so on.
Then we put all data in single framework & apply various statistical tools to find out the dynamic on the market.
During the analysis stage, feedback from the stakeholder groups would be compared to determine areas of agreement as well as areas of divergence