

Key Insights
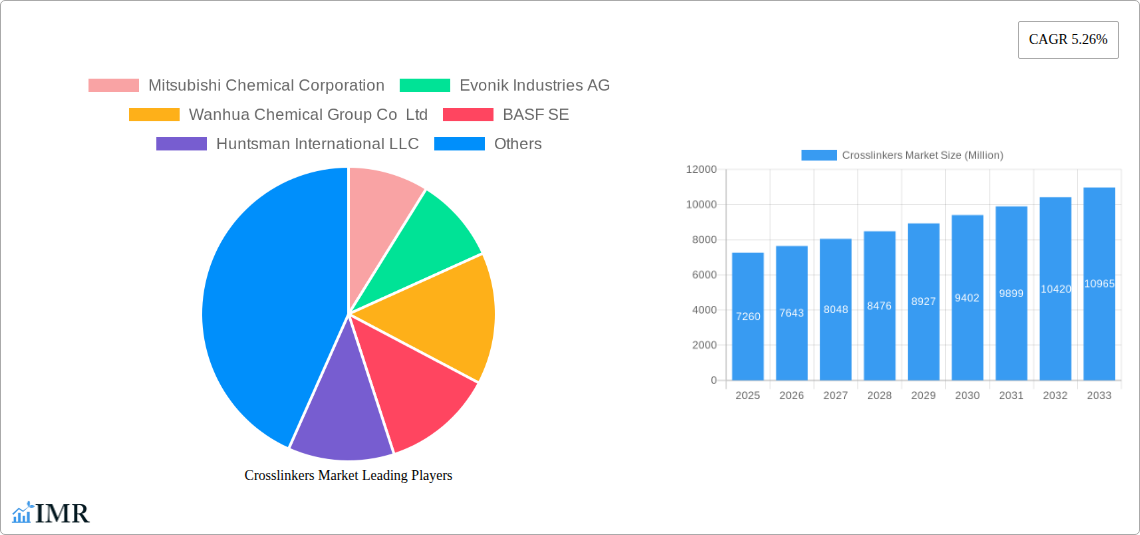
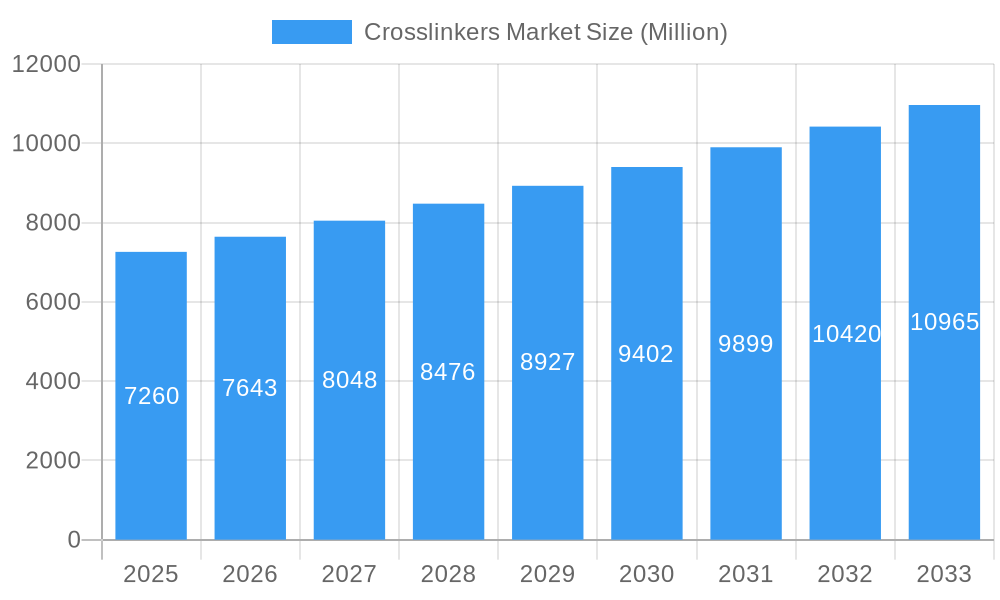
The global crosslinkers market, valued at $7.26 billion in 2025, is projected to experience robust growth, driven by increasing demand across diverse applications. The automotive coatings segment is a significant contributor, fueled by the rising production of vehicles and the need for durable, high-performance finishes. Similarly, the burgeoning construction and infrastructure sectors are boosting demand for decorative and industrial coatings, further propelling market expansion. Technological advancements leading to the development of eco-friendly and high-performance crosslinkers are key trends shaping the market. The shift towards sustainable manufacturing practices is influencing the adoption of water-borne and UV-curable crosslinkers, which are expected to gain significant traction in the coming years. While the market faces potential restraints from fluctuating raw material prices and stringent environmental regulations, the overall growth trajectory remains positive. The Asia-Pacific region, particularly China and India, is anticipated to be a major growth engine, driven by rapid industrialization and infrastructure development. The diversity of crosslinker types, including amides, amines, amino, carbodiimides, isocyanates, and others, caters to the specific requirements of various applications, contributing to the market's dynamism. Competition among major players such as Mitsubishi Chemical Corporation, Evonik Industries AG, and BASF SE is intense, leading to innovation and improved product offerings.
Crosslinkers Market Market Size (In Billion)
The forecast period (2025-2033) anticipates a continuation of this positive growth trend, with the CAGR of 5.26% indicating a steady expansion of the market. This growth will be fueled by ongoing investments in research and development, leading to the development of more specialized and efficient crosslinkers for emerging applications such as electronics and renewable energy. Regional variations will be influenced by economic growth patterns, governmental policies promoting sustainable development, and the evolving regulatory landscape. However, potential challenges including supply chain disruptions and the impact of global economic fluctuations need to be considered when evaluating the market's long-term prospects. The market is expected to witness further consolidation as larger players acquire smaller companies to expand their product portfolios and geographic reach.
Crosslinkers Market Company Market Share
Crosslinkers Market: A Comprehensive Report (2019-2033)
This in-depth report provides a comprehensive analysis of the Crosslinkers Market, encompassing market dynamics, growth trends, regional segmentation, product landscape, key players, and future outlook. The study period covers 2019-2033, with 2025 as the base and estimated year. The report segments the market by application (Automotive Coatings, Decorative Coatings, Industrial Coatings, Packaging Coatings, Other Applications) and type (Amide, Amine, Amino, Carbodiimide, Isocyanate, Other Types), offering granular insights into this crucial chemical industry sector.
Parent Market: Chemical Additives Market Child Market: Specialty Chemicals Market
Crosslinkers Market Market Dynamics & Structure
The Crosslinkers Market is characterized by moderate concentration, with key players like Mitsubishi Chemical Corporation, Evonik Industries AG, Wanhua Chemical Group Co Ltd, BASF SE, and Huntsman International LLC holding significant market share. Technological innovation, particularly in developing sustainable and high-performance crosslinkers, is a major driver. Stringent environmental regulations are shaping product development, pushing companies towards greener alternatives. The market also faces competition from alternative bonding technologies. M&A activity has been significant, with notable transactions including Hexion's sale of its epoxy businesses in 2022 and Allnex's acquisition by PTT Global Chemical in 2021. These deals reshape the competitive landscape and influence market consolidation.
- Market Concentration: Moderately concentrated, with top 5 players holding xx% market share (2024).
- Technological Innovation: Focus on sustainable, high-performance crosslinkers; significant R&D investment.
- Regulatory Framework: Stringent environmental regulations driving demand for eco-friendly products.
- Competitive Substitutes: Competition from alternative bonding and adhesion technologies.
- M&A Activity: Significant consolidation through acquisitions and mergers (e.g., Hexion and Allnex deals). xx M&A deals recorded between 2019-2024.
- Innovation Barriers: High R&D costs, stringent regulatory approvals, and competition for intellectual property.
Crosslinkers Market Growth Trends & Insights
The global Crosslinkers Market witnessed robust growth during the historical period (2019-2024), driven by the increasing demand from automotive, construction, and packaging industries. The market size expanded from xx Million units in 2019 to xx Million units in 2024, registering a CAGR of xx%. This growth is anticipated to continue throughout the forecast period (2025-2033), with the market size projected to reach xx Million units by 2033, exhibiting a CAGR of xx%. This growth is primarily attributed to the rising adoption of advanced coatings and adhesives in various end-use industries. Technological advancements leading to enhanced product performance and sustainability are further contributing to market expansion. Shifting consumer preferences towards high-quality and durable products also fuel demand.
Dominant Regions, Countries, or Segments in Crosslinkers Market
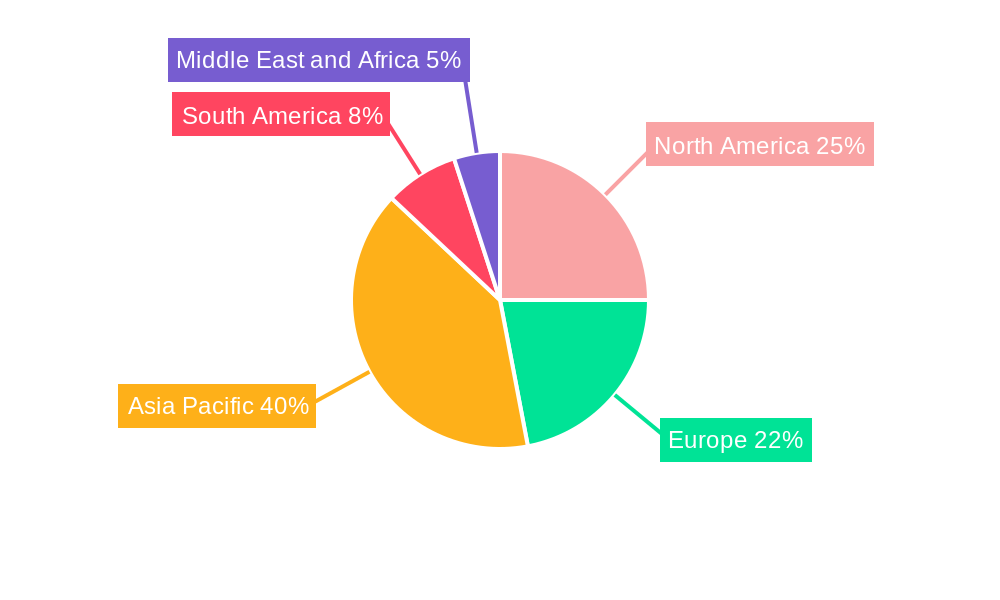
The Asia-Pacific region dominated the Crosslinkers Market in 2024, holding approximately xx% market share, followed by North America and Europe. Within applications, Automotive Coatings held the largest share due to the high volume of vehicle production and stringent quality standards. Among types, Isocyanates and Amides were the leading segments owing to their widespread use in various applications.
- Leading Region: Asia-Pacific (xx% market share in 2024) driven by rapid industrialization and automotive production.
- Leading Application: Automotive Coatings (xx% market share in 2024) due to high demand and stringent quality requirements.
- Leading Type: Isocyanates & Amides (combined xx% market share in 2024) due to superior performance and diverse applications.
- Key Drivers: Rapid industrialization in emerging economies, growing construction activities, and increasing demand for high-performance coatings.
Crosslinkers Market Product Landscape
The Crosslinkers Market offers a wide range of products tailored to specific applications. Innovations focus on improving crosslinking efficiency, enhancing durability, and reducing environmental impact. Products are differentiated based on their chemical structure, functionality, and performance characteristics. Key innovations include the development of bio-based crosslinkers and those with improved adhesion and UV resistance.
Key Drivers, Barriers & Challenges in Crosslinkers Market
Key Drivers:
- Rising demand from the automotive and construction industries.
- Growing adoption of advanced coatings and adhesives.
- Technological advancements leading to improved product performance.
Key Challenges:
- Fluctuations in raw material prices.
- Stringent environmental regulations.
- Intense competition among market players.
- Supply chain disruptions impacting production and delivery timelines.
Emerging Opportunities in Crosslinkers Market
- Growing demand for sustainable and eco-friendly crosslinkers.
- Expansion into new applications, such as renewable energy and biomedical devices.
- Development of customized crosslinkers to meet specific customer needs.
Growth Accelerators in the Crosslinkers Market Industry
Strategic partnerships, technological innovations driving improved product efficiency and sustainability, and expansion into emerging markets are key growth accelerators for the Crosslinkers market. The focus on eco-friendly products and solutions opens new avenues for market expansion and long-term growth.
Key Players Shaping the Crosslinkers Market Market
- Mitsubishi Chemical Corporation
- Evonik Industries AG
- Wanhua Chemical Group Co Ltd
- BASF SE
- Huntsman International LLC
- Dow
- Aditya Birla Chemicals
- KUMHO P&B CHEMICALS INC
- Allnex GMBH
- Hexion
- NIPPON SHOKUBAI CO LTD
- Covestro AG
- Nisshinbo Chemical Inc
Notable Milestones in Crosslinkers Market Sector
- February 2022: Hexion sold its epoxy-based Coatings and Composite businesses for USD 1.2 billion to Westlake Chemical Corporation. This significantly altered the market share dynamics within the epoxy resin segment.
- December 2021: Allnex was acquired by PTT Global Chemical for approximately USD 4.25 billion, resulting in a major shift in the market's competitive landscape.
In-Depth Crosslinkers Market Market Outlook
The Crosslinkers Market is poised for significant growth, driven by technological advancements, increasing demand from key industries, and the expansion into new applications. Strategic partnerships and investments in sustainable technologies will further fuel market expansion. Companies focusing on innovation and adapting to evolving regulatory landscapes are best positioned to capitalize on future opportunities.
Crosslinkers Market Segmentation
-
1. Type
- 1.1. Amide
- 1.2. Amine
- 1.3. Amino
- 1.4. Carbodiimide
- 1.5. Isocyanate
- 1.6. Other Types
-
2. Application
- 2.1. Automotive Coatings
- 2.2. Decorative Coatings
- 2.3. Industrial Coatings
- 2.4. Packaging Coatings
- 2.5. Other Applications
Crosslinkers Market Segmentation By Geography
-
1. Asia Pacific
- 1.1. China
- 1.2. India
- 1.3. Japan
- 1.4. South Korea
- 1.5. Rest of Asia Pacific
-
2. North America
- 2.1. United States
- 2.2. Canada
- 2.3. Mexico
-
3. Europe
- 3.1. Germany
- 3.2. United Kingdom
- 3.3. France
- 3.4. Italy
- 3.5. Rest of Europe
-
4. South America
- 4.1. Brazil
- 4.2. Argentina
- 4.3. Rest of South America
-
5. Middle East and Africa
- 5.1. Saudi Arabia
- 5.2. South Africa
- 5.3. Rest of Middle East and Africa
Crosslinkers Market Regional Market Share
Geographic Coverage of Crosslinkers Market
Crosslinkers Market REPORT HIGHLIGHTS
| Aspects | Details |
|---|---|
| Study Period | 2020-2034 |
| Base Year | 2025 |
| Estimated Year | 2026 |
| Forecast Period | 2026-2034 |
| Historical Period | 2020-2025 |
| Growth Rate | CAGR of 5.26% from 2020-2034 |
| Segmentation |
|
Table of Contents
- 1. Introduction
- 1.1. Research Scope
- 1.2. Market Segmentation
- 1.3. Research Objective
- 1.4. Definitions and Assumptions
- 2. Executive Summary
- 2.1. Market Snapshot
- 3. Market Dynamics
- 3.1. Market Drivers
- 3.2. Market Restrains
- 3.3. Market Trends
- 3.4. Market Opportunities
- 4. Market Factor Analysis
- 4.1. Porters Five Forces
- 4.1.1. Bargaining Power of Suppliers
- 4.1.2. Bargaining Power of Buyers
- 4.1.3. Threat of New Entrants
- 4.1.4. Threat of Substitutes
- 4.1.5. Competitive Rivalry
- 4.2. PESTEL analysis
- 4.3. BCG Analysis
- 4.3.1. Stars (High Growth, High Market Share)
- 4.3.2. Cash Cows (Low Growth, High Market Share)
- 4.3.3. Question Mark (High Growth, Low Market Share)
- 4.3.4. Dogs (Low Growth, Low Market Share)
- 4.4. Ansoff Matrix Analysis
- 4.5. Supply Chain Analysis
- 4.6. Regulatory Landscape
- 4.7. Current Market Potential and Opportunity Assessment (TAM–SAM–SOM Framework)
- 4.8. IMR Analyst Note
- 4.1. Porters Five Forces
- 5. Market Analysis, Insights and Forecast 2021-2033
- 5.1. Market Analysis, Insights and Forecast - by Type
- 5.1.1. Amide
- 5.1.2. Amine
- 5.1.3. Amino
- 5.1.4. Carbodiimide
- 5.1.5. Isocyanate
- 5.1.6. Other Types
- 5.2. Market Analysis, Insights and Forecast - by Application
- 5.2.1. Automotive Coatings
- 5.2.2. Decorative Coatings
- 5.2.3. Industrial Coatings
- 5.2.4. Packaging Coatings
- 5.2.5. Other Applications
- 5.3. Market Analysis, Insights and Forecast - by Region
- 5.3.1. Asia Pacific
- 5.3.2. North America
- 5.3.3. Europe
- 5.3.4. South America
- 5.3.5. Middle East and Africa
- 5.1. Market Analysis, Insights and Forecast - by Type
- 6. Global Crosslinkers Market Analysis, Insights and Forecast, 2021-2033
- 6.1. Market Analysis, Insights and Forecast - by Type
- 6.1.1. Amide
- 6.1.2. Amine
- 6.1.3. Amino
- 6.1.4. Carbodiimide
- 6.1.5. Isocyanate
- 6.1.6. Other Types
- 6.2. Market Analysis, Insights and Forecast - by Application
- 6.2.1. Automotive Coatings
- 6.2.2. Decorative Coatings
- 6.2.3. Industrial Coatings
- 6.2.4. Packaging Coatings
- 6.2.5. Other Applications
- 6.1. Market Analysis, Insights and Forecast - by Type
- 7. Asia Pacific Crosslinkers Market Analysis, Insights and Forecast, 2020-2032
- 7.1. Market Analysis, Insights and Forecast - by Type
- 7.1.1. Amide
- 7.1.2. Amine
- 7.1.3. Amino
- 7.1.4. Carbodiimide
- 7.1.5. Isocyanate
- 7.1.6. Other Types
- 7.2. Market Analysis, Insights and Forecast - by Application
- 7.2.1. Automotive Coatings
- 7.2.2. Decorative Coatings
- 7.2.3. Industrial Coatings
- 7.2.4. Packaging Coatings
- 7.2.5. Other Applications
- 7.1. Market Analysis, Insights and Forecast - by Type
- 8. North America Crosslinkers Market Analysis, Insights and Forecast, 2020-2032
- 8.1. Market Analysis, Insights and Forecast - by Type
- 8.1.1. Amide
- 8.1.2. Amine
- 8.1.3. Amino
- 8.1.4. Carbodiimide
- 8.1.5. Isocyanate
- 8.1.6. Other Types
- 8.2. Market Analysis, Insights and Forecast - by Application
- 8.2.1. Automotive Coatings
- 8.2.2. Decorative Coatings
- 8.2.3. Industrial Coatings
- 8.2.4. Packaging Coatings
- 8.2.5. Other Applications
- 8.1. Market Analysis, Insights and Forecast - by Type
- 9. Europe Crosslinkers Market Analysis, Insights and Forecast, 2020-2032
- 9.1. Market Analysis, Insights and Forecast - by Type
- 9.1.1. Amide
- 9.1.2. Amine
- 9.1.3. Amino
- 9.1.4. Carbodiimide
- 9.1.5. Isocyanate
- 9.1.6. Other Types
- 9.2. Market Analysis, Insights and Forecast - by Application
- 9.2.1. Automotive Coatings
- 9.2.2. Decorative Coatings
- 9.2.3. Industrial Coatings
- 9.2.4. Packaging Coatings
- 9.2.5. Other Applications
- 9.1. Market Analysis, Insights and Forecast - by Type
- 10. South America Crosslinkers Market Analysis, Insights and Forecast, 2020-2032
- 10.1. Market Analysis, Insights and Forecast - by Type
- 10.1.1. Amide
- 10.1.2. Amine
- 10.1.3. Amino
- 10.1.4. Carbodiimide
- 10.1.5. Isocyanate
- 10.1.6. Other Types
- 10.2. Market Analysis, Insights and Forecast - by Application
- 10.2.1. Automotive Coatings
- 10.2.2. Decorative Coatings
- 10.2.3. Industrial Coatings
- 10.2.4. Packaging Coatings
- 10.2.5. Other Applications
- 10.1. Market Analysis, Insights and Forecast - by Type
- 11. Middle East and Africa Crosslinkers Market Analysis, Insights and Forecast, 2020-2032
- 11.1. Market Analysis, Insights and Forecast - by Type
- 11.1.1. Amide
- 11.1.2. Amine
- 11.1.3. Amino
- 11.1.4. Carbodiimide
- 11.1.5. Isocyanate
- 11.1.6. Other Types
- 11.2. Market Analysis, Insights and Forecast - by Application
- 11.2.1. Automotive Coatings
- 11.2.2. Decorative Coatings
- 11.2.3. Industrial Coatings
- 11.2.4. Packaging Coatings
- 11.2.5. Other Applications
- 11.1. Market Analysis, Insights and Forecast - by Type
- 12. Competitive Analysis
- 12.1. Company Profiles
- 12.1.1 Mitsubishi Chemical Corporation
- 12.1.1.1. Company Overview
- 12.1.1.2. Products
- 12.1.1.3. Company Financials
- 12.1.1.4. SWOT Analysis
- 12.1.2 Evonik Industries AG
- 12.1.2.1. Company Overview
- 12.1.2.2. Products
- 12.1.2.3. Company Financials
- 12.1.2.4. SWOT Analysis
- 12.1.3 Wanhua Chemical Group Co Ltd
- 12.1.3.1. Company Overview
- 12.1.3.2. Products
- 12.1.3.3. Company Financials
- 12.1.3.4. SWOT Analysis
- 12.1.4 BASF SE
- 12.1.4.1. Company Overview
- 12.1.4.2. Products
- 12.1.4.3. Company Financials
- 12.1.4.4. SWOT Analysis
- 12.1.5 Huntsman International LLC
- 12.1.5.1. Company Overview
- 12.1.5.2. Products
- 12.1.5.3. Company Financials
- 12.1.5.4. SWOT Analysis
- 12.1.6 Dow
- 12.1.6.1. Company Overview
- 12.1.6.2. Products
- 12.1.6.3. Company Financials
- 12.1.6.4. SWOT Analysis
- 12.1.7 Aditya Birla Chemicals
- 12.1.7.1. Company Overview
- 12.1.7.2. Products
- 12.1.7.3. Company Financials
- 12.1.7.4. SWOT Analysis
- 12.1.8 KUMHO P&B CHEMICALS INC *List Not Exhaustive
- 12.1.8.1. Company Overview
- 12.1.8.2. Products
- 12.1.8.3. Company Financials
- 12.1.8.4. SWOT Analysis
- 12.1.9 Allnex GMBH
- 12.1.9.1. Company Overview
- 12.1.9.2. Products
- 12.1.9.3. Company Financials
- 12.1.9.4. SWOT Analysis
- 12.1.10 Hexion
- 12.1.10.1. Company Overview
- 12.1.10.2. Products
- 12.1.10.3. Company Financials
- 12.1.10.4. SWOT Analysis
- 12.1.11 NIPPON SHOKUBAI CO LTD
- 12.1.11.1. Company Overview
- 12.1.11.2. Products
- 12.1.11.3. Company Financials
- 12.1.11.4. SWOT Analysis
- 12.1.12 Covestro AG
- 12.1.12.1. Company Overview
- 12.1.12.2. Products
- 12.1.12.3. Company Financials
- 12.1.12.4. SWOT Analysis
- 12.1.13 Nisshinbo Chemical Inc
- 12.1.13.1. Company Overview
- 12.1.13.2. Products
- 12.1.13.3. Company Financials
- 12.1.13.4. SWOT Analysis
- 12.1.1 Mitsubishi Chemical Corporation
- 12.2. Market Entropy
- 12.2.1 Company's Key Areas Served
- 12.2.2 Recent Developments
- 12.3. Company Market Share Analysis 2025
- 12.3.1 Top 5 Companies Market Share Analysis
- 12.3.2 Top 3 Companies Market Share Analysis
- 12.4. List of Potential Customers
- 13. Research Methodology
List of Figures
- Figure 1: Global Crosslinkers Market Revenue Breakdown (Million, %) by Region 2025 & 2033
- Figure 2: Asia Pacific Crosslinkers Market Revenue (Million), by Type 2025 & 2033
- Figure 3: Asia Pacific Crosslinkers Market Revenue Share (%), by Type 2025 & 2033
- Figure 4: Asia Pacific Crosslinkers Market Revenue (Million), by Application 2025 & 2033
- Figure 5: Asia Pacific Crosslinkers Market Revenue Share (%), by Application 2025 & 2033
- Figure 6: Asia Pacific Crosslinkers Market Revenue (Million), by Country 2025 & 2033
- Figure 7: Asia Pacific Crosslinkers Market Revenue Share (%), by Country 2025 & 2033
- Figure 8: North America Crosslinkers Market Revenue (Million), by Type 2025 & 2033
- Figure 9: North America Crosslinkers Market Revenue Share (%), by Type 2025 & 2033
- Figure 10: North America Crosslinkers Market Revenue (Million), by Application 2025 & 2033
- Figure 11: North America Crosslinkers Market Revenue Share (%), by Application 2025 & 2033
- Figure 12: North America Crosslinkers Market Revenue (Million), by Country 2025 & 2033
- Figure 13: North America Crosslinkers Market Revenue Share (%), by Country 2025 & 2033
- Figure 14: Europe Crosslinkers Market Revenue (Million), by Type 2025 & 2033
- Figure 15: Europe Crosslinkers Market Revenue Share (%), by Type 2025 & 2033
- Figure 16: Europe Crosslinkers Market Revenue (Million), by Application 2025 & 2033
- Figure 17: Europe Crosslinkers Market Revenue Share (%), by Application 2025 & 2033
- Figure 18: Europe Crosslinkers Market Revenue (Million), by Country 2025 & 2033
- Figure 19: Europe Crosslinkers Market Revenue Share (%), by Country 2025 & 2033
- Figure 20: South America Crosslinkers Market Revenue (Million), by Type 2025 & 2033
- Figure 21: South America Crosslinkers Market Revenue Share (%), by Type 2025 & 2033
- Figure 22: South America Crosslinkers Market Revenue (Million), by Application 2025 & 2033
- Figure 23: South America Crosslinkers Market Revenue Share (%), by Application 2025 & 2033
- Figure 24: South America Crosslinkers Market Revenue (Million), by Country 2025 & 2033
- Figure 25: South America Crosslinkers Market Revenue Share (%), by Country 2025 & 2033
- Figure 26: Middle East and Africa Crosslinkers Market Revenue (Million), by Type 2025 & 2033
- Figure 27: Middle East and Africa Crosslinkers Market Revenue Share (%), by Type 2025 & 2033
- Figure 28: Middle East and Africa Crosslinkers Market Revenue (Million), by Application 2025 & 2033
- Figure 29: Middle East and Africa Crosslinkers Market Revenue Share (%), by Application 2025 & 2033
- Figure 30: Middle East and Africa Crosslinkers Market Revenue (Million), by Country 2025 & 2033
- Figure 31: Middle East and Africa Crosslinkers Market Revenue Share (%), by Country 2025 & 2033
List of Tables
- Table 1: Global Crosslinkers Market Revenue Million Forecast, by Type 2020 & 2033
- Table 2: Global Crosslinkers Market Revenue Million Forecast, by Application 2020 & 2033
- Table 3: Global Crosslinkers Market Revenue Million Forecast, by Region 2020 & 2033
- Table 4: Global Crosslinkers Market Revenue Million Forecast, by Type 2020 & 2033
- Table 5: Global Crosslinkers Market Revenue Million Forecast, by Application 2020 & 2033
- Table 6: Global Crosslinkers Market Revenue Million Forecast, by Country 2020 & 2033
- Table 7: China Crosslinkers Market Revenue (Million) Forecast, by Application 2020 & 2033
- Table 8: India Crosslinkers Market Revenue (Million) Forecast, by Application 2020 & 2033
- Table 9: Japan Crosslinkers Market Revenue (Million) Forecast, by Application 2020 & 2033
- Table 10: South Korea Crosslinkers Market Revenue (Million) Forecast, by Application 2020 & 2033
- Table 11: Rest of Asia Pacific Crosslinkers Market Revenue (Million) Forecast, by Application 2020 & 2033
- Table 12: Global Crosslinkers Market Revenue Million Forecast, by Type 2020 & 2033
- Table 13: Global Crosslinkers Market Revenue Million Forecast, by Application 2020 & 2033
- Table 14: Global Crosslinkers Market Revenue Million Forecast, by Country 2020 & 2033
- Table 15: United States Crosslinkers Market Revenue (Million) Forecast, by Application 2020 & 2033
- Table 16: Canada Crosslinkers Market Revenue (Million) Forecast, by Application 2020 & 2033
- Table 17: Mexico Crosslinkers Market Revenue (Million) Forecast, by Application 2020 & 2033
- Table 18: Global Crosslinkers Market Revenue Million Forecast, by Type 2020 & 2033
- Table 19: Global Crosslinkers Market Revenue Million Forecast, by Application 2020 & 2033
- Table 20: Global Crosslinkers Market Revenue Million Forecast, by Country 2020 & 2033
- Table 21: Germany Crosslinkers Market Revenue (Million) Forecast, by Application 2020 & 2033
- Table 22: United Kingdom Crosslinkers Market Revenue (Million) Forecast, by Application 2020 & 2033
- Table 23: France Crosslinkers Market Revenue (Million) Forecast, by Application 2020 & 2033
- Table 24: Italy Crosslinkers Market Revenue (Million) Forecast, by Application 2020 & 2033
- Table 25: Rest of Europe Crosslinkers Market Revenue (Million) Forecast, by Application 2020 & 2033
- Table 26: Global Crosslinkers Market Revenue Million Forecast, by Type 2020 & 2033
- Table 27: Global Crosslinkers Market Revenue Million Forecast, by Application 2020 & 2033
- Table 28: Global Crosslinkers Market Revenue Million Forecast, by Country 2020 & 2033
- Table 29: Brazil Crosslinkers Market Revenue (Million) Forecast, by Application 2020 & 2033
- Table 30: Argentina Crosslinkers Market Revenue (Million) Forecast, by Application 2020 & 2033
- Table 31: Rest of South America Crosslinkers Market Revenue (Million) Forecast, by Application 2020 & 2033
- Table 32: Global Crosslinkers Market Revenue Million Forecast, by Type 2020 & 2033
- Table 33: Global Crosslinkers Market Revenue Million Forecast, by Application 2020 & 2033
- Table 34: Global Crosslinkers Market Revenue Million Forecast, by Country 2020 & 2033
- Table 35: Saudi Arabia Crosslinkers Market Revenue (Million) Forecast, by Application 2020 & 2033
- Table 36: South Africa Crosslinkers Market Revenue (Million) Forecast, by Application 2020 & 2033
- Table 37: Rest of Middle East and Africa Crosslinkers Market Revenue (Million) Forecast, by Application 2020 & 2033
Frequently Asked Questions
1. What is the projected Compound Annual Growth Rate (CAGR) of the Crosslinkers Market?
The projected CAGR is approximately 5.26%.
2. Which companies are prominent players in the Crosslinkers Market?
Key companies in the market include Mitsubishi Chemical Corporation, Evonik Industries AG, Wanhua Chemical Group Co Ltd, BASF SE, Huntsman International LLC, Dow, Aditya Birla Chemicals, KUMHO P&B CHEMICALS INC *List Not Exhaustive, Allnex GMBH, Hexion, NIPPON SHOKUBAI CO LTD, Covestro AG, Nisshinbo Chemical Inc.
3. What are the main segments of the Crosslinkers Market?
The market segments include Type, Application.
4. Can you provide details about the market size?
The market size is estimated to be USD 7.26 Million as of 2022.
5. What are some drivers contributing to market growth?
Increasing Demad for Numerous Coatings; Increasing Focus on High-Performance Crosslinking Agents.
6. What are the notable trends driving market growth?
Increasing Demand for Decorative Coatings.
7. Are there any restraints impacting market growth?
Presence of Self-Crosslinking Agents.
8. Can you provide examples of recent developments in the market?
In February 2022, Hexion completed the sale of its epoxy-based Coatings and Composite businesses, which includes the epoxy specialty resins and base epoxy resins and intermediates product lines for around USD 1.2 billion to Westlake Chemical Corporation.
9. What pricing options are available for accessing the report?
Pricing options include single-user, multi-user, and enterprise licenses priced at USD 4750, USD 5250, and USD 8750 respectively.
10. Is the market size provided in terms of value or volume?
The market size is provided in terms of value, measured in Million.
11. Are there any specific market keywords associated with the report?
Yes, the market keyword associated with the report is "Crosslinkers Market," which aids in identifying and referencing the specific market segment covered.
12. How do I determine which pricing option suits my needs best?
The pricing options vary based on user requirements and access needs. Individual users may opt for single-user licenses, while businesses requiring broader access may choose multi-user or enterprise licenses for cost-effective access to the report.
13. Are there any additional resources or data provided in the Crosslinkers Market report?
While the report offers comprehensive insights, it's advisable to review the specific contents or supplementary materials provided to ascertain if additional resources or data are available.
14. How can I stay updated on further developments or reports in the Crosslinkers Market?
To stay informed about further developments, trends, and reports in the Crosslinkers Market, consider subscribing to industry newsletters, following relevant companies and organizations, or regularly checking reputable industry news sources and publications.
Methodology
Step 1 - Identification of Relevant Samples Size from Population Database


Step 2 - Approaches for Defining Global Market Size (Value, Volume* & Price*)

Note*: In applicable scenarios
Step 3 - Data Sources
Primary Research
- Web Analytics
- Survey Reports
- Research Institute
- Latest Research Reports
- Opinion Leaders
Secondary Research
- Annual Reports
- White Paper
- Latest Press Release
- Industry Association
- Paid Database
- Investor Presentations

Step 4 - Data Triangulation
Involves using different sources of information in order to increase the validity of a study
These sources are likely to be stakeholders in a program - participants, other researchers, program staff, other community members, and so on.
Then we put all data in single framework & apply various statistical tools to find out the dynamic on the market.
During the analysis stage, feedback from the stakeholder groups would be compared to determine areas of agreement as well as areas of divergence